Road Closure Obstacles and Palestinian Economic Growth A Market Access Approach
←
→
Page content transcription
If your browser does not render page correctly, please read the page content below
Road Closure Obstacles and Palestinian
          Economic Growth
     A Market Access Approach

           Roy van der Weide
              Bob Rijkers
           Brian Blankespoor
            Alexei Abrahams

           ABCDE Conference
             June 21, 2021

                                         1 / 19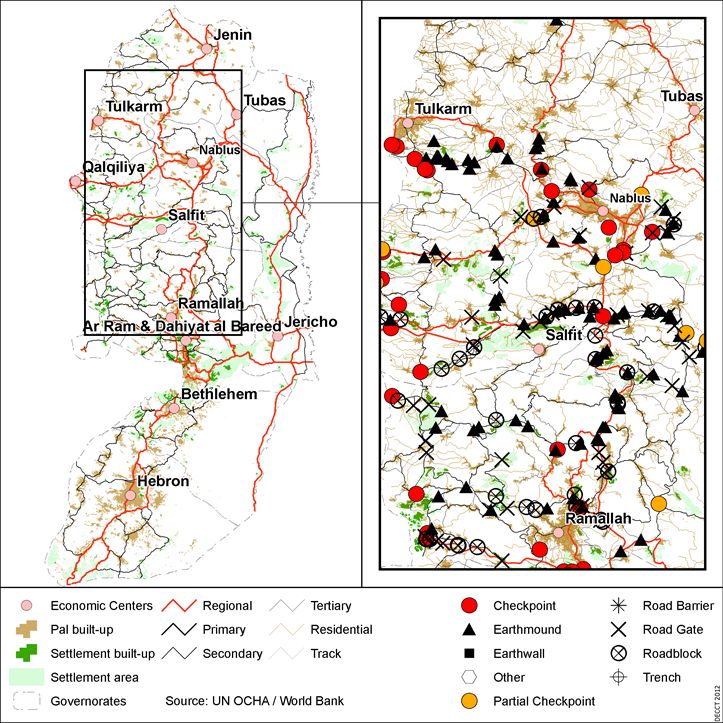
How valuable is market access?

    I Hard to assess: Market access generally evolves slowly and
      non-randomly
    I Existing studies exploit variation in:
        I Provision of transportation infrastructure (e.g. Akerman, 2012;
          Banerjee et al., 2012; Baum-Snow et al., 2013; Donaldson,
          2016; Faber, 2014; Jedwab and Moradi, 2014)
        I Placement of borders (e.g. Redding and Sturm, 2008; Brulhart
          et al., 2012)
        I Transportation costs (e.g. Storeygard, 2016; Volpe et al.,
          2014)
    I Do short-term changes in market access impact economic
      growth (proxied by night-time-lights (NTL)) in the West
      Bank?
        I Exploit variation due to mobility restrictions imposed by Israel

                                                                             2 / 19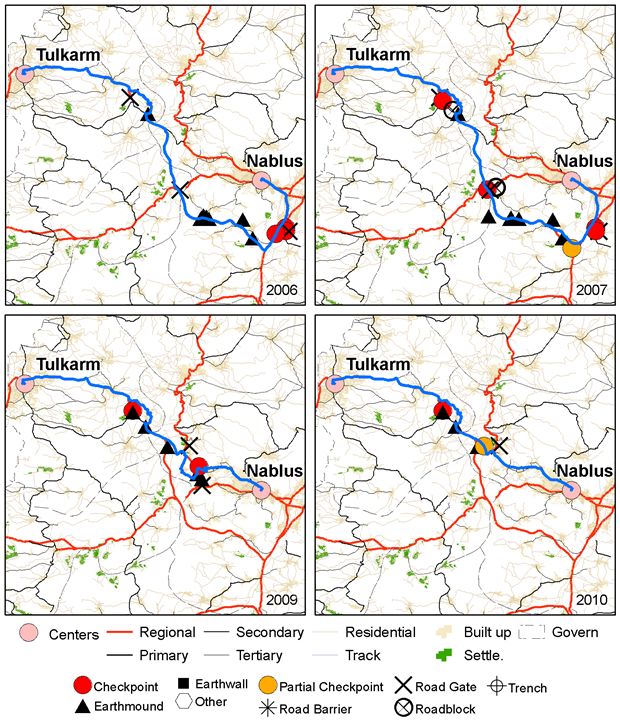
A map of the West Bank

                         3 / 19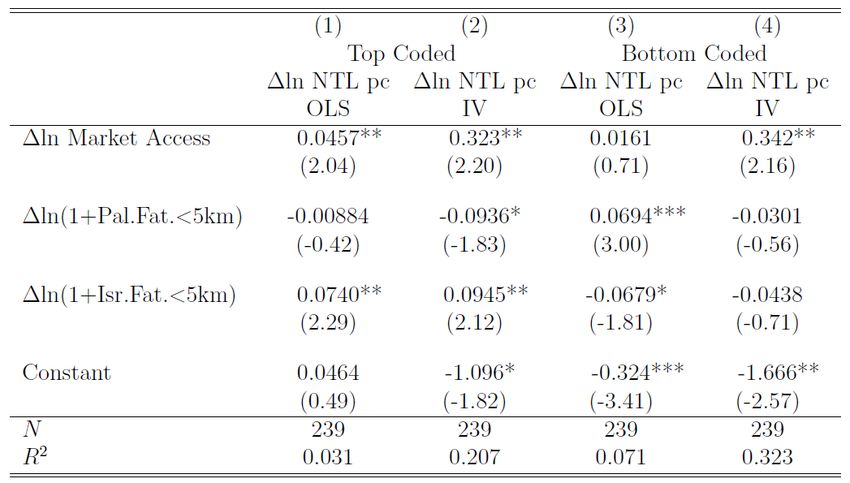
Israel’s Closure Policy

     I Israel deploys obstacles to mobility inside the West Bank
         I Checkpoints, trenches, road bloacks, a barrier wall

     I These serve to protect Israel and Israeli settlements from
       attacks, not to regulate economic performance
       ⇒ Exogeneity

     I Number, intensity and configuration of obstacles changes
       frequently and unexpectedly
       ⇒ spatial and temporal variation in market access

                                                                    4 / 19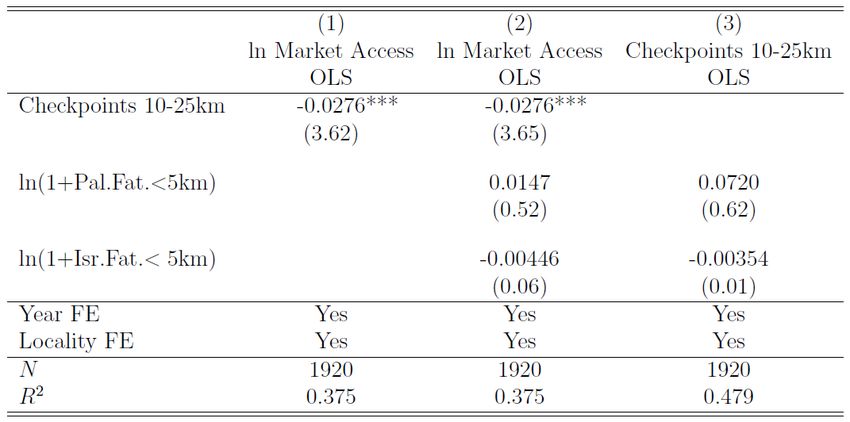
Data used

    I Road network data (incl. travel speeds) - from OCHA
    I Road closure obstacles data (incl. wait times) - from OCHA
    I Populated area data (incl. population counts) - from PCBS
    I Night-time-lights data - from NOAA
    I Stock price data - from PEX
    I Fatalities data (both Palestinian and Israeli) - from B’Tselem

                                                                       5 / 19
Optimal (commercial) routes between localities

                                                 6 / 19
Distribution of Travel Times (in minutes)
7 / 19Measuring market access
X
MAit = Pjt h(Tijt ),
j
where
I MAit is market access at locality i and time t
I h(T ) = T −θ is the “distance function” with distance decay
parameter θ
I Tijt is the travel time between origin i and destination j (at
time t)
I Pjt is the population in destination j (at time t)
I The set of destinations comprise the governorate capitals
8 / 19Density of market access (θ = 3)
.3
.2
density
.1
0
-2 0 2 4
ln market access
2007 2008 2009 2010
9 / 19Market access by locality: 2006 (left) versus 2010 (right)
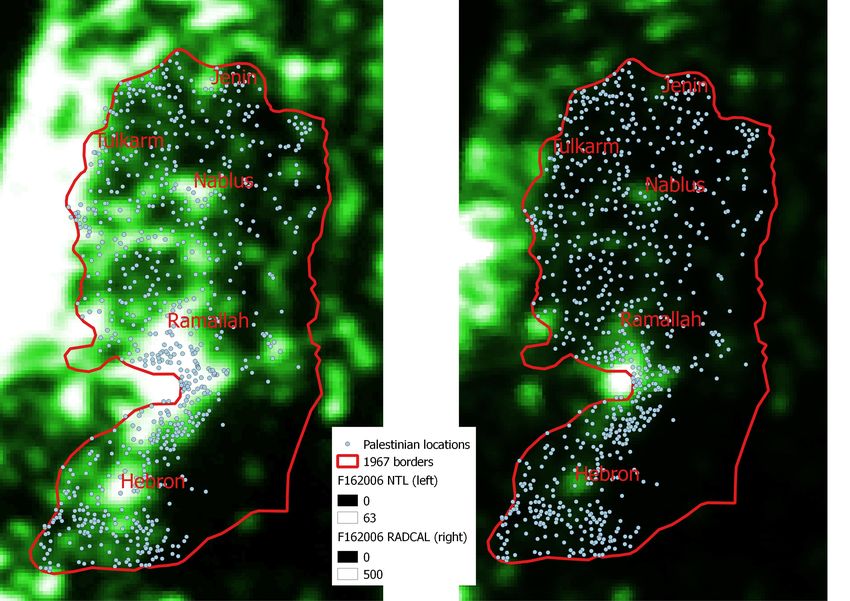
10 / 19Night Time Lights (NTL) - a proxy for economic output
Figure: Top-coded (left) vs. bottom-coded (right) Night Time Lights
(2006)
11 / 19NTL versus GDP
2.4 2.2
ln(output)
2
1.8
2000 2002 2004 2006 2008 2010
Year
ln(GDP) ln(NTL)
12 / 19Main empirical specification
ln Yit = β ln MAit + γXit + λi + δt + εit ,
where:
I Yit : NTL per capita at location i and time t
I Xit : ln fatalities (within 5km radius)
I λi : locality fixed effects
I δt : time fixed effects
13 / 19Identification
I OLS estimates of β may be biased
I complementary penalties ⇒ positive bias
I fixed checkpoints being replaced by flying checkpoints (not
captured in our database) ⇒ negative bias
I measurement error in MA ⇒ negative bias
I Instrument number of checkpoints located in a radius
between 10 and 25 km from the locality
I Correlated with MA, but orthogonal to local conditions
14 / 19First stage
15 / 19Main results
16 / 19Difference-in-Difference Regressions 2006-2010
17 / 19Counterfactual growth upon removing all obstacles
.4
log difference in NTL per capita
.25 .2.3 .35
2004 2006 2008 2010 2012
year
θ=1 θ=2
θ=3 θ=4
θ=5 θ=6
18 / 19Conclusion
I Exploiting quasi-experimental variation in market access
generated by the deployment of Israeli army obstacles this
paper demonstrates that short-run fluctuations in market
access impact local economic performance.
I Israel’s closure policy reduced GDP per capita in the West
Bank between 6.0% and 7.5% each year between 2006 and
2012
I Preliminary estimates obtained using firm-census data
suggests that changes in market access primarily impact the
manufacturing sector
19 / 19You can also read