Road Safety Impact of Increased Rural Highway Speed Limits in British Columbia, Canada - MDPI
←
→
Page content transcription
If your browser does not render page correctly, please read the page content below

sustainability

Article
Road Safety Impact of Increased Rural Highway
Speed Limits in British Columbia, Canada
Jeffrey R Brubacher 1, *, Herbert Chan 1 , Shannon Erdelyi 1 , Gordon Lovegrove 2
and Farhad Faghihi 2
 1    The University of British Columbia, Department of Emergency Medicine, Faculty of Medicine, Vancouver,
      British Columbia V6T 1Z4, Canada; herbert.chan@ubc.ca (H.C.); shannonerdelyi@gmail.com (S.E.)
 2    The University of British Columbia (Okanagan Campus), School of Engineering, Faculty of Applied Science,
      Kelowna, British Columbia V1V 1V7, Canada; gord.lovegrove@ubc.ca (G.L.);
      farhad.faghihi1985@gmail.com (F.F.)
 *    Correspondence: Jbrubacher@shaw.ca; Tel.: +1-604-219-0698

 Received: 22 August 2018; Accepted: 28 September 2018; Published: 4 October 2018

 Abstract: Control of vehicle speed is a central tenet of the safe systems approach to road safety.
 Most research shows that raising speed limits results in more injuries. Advocates of higher speed
 limits argue that this conclusion is based on older research, that traffic fatalities are decreasing
 despite higher speed limits, and that modern vehicles are able to safely travel at higher speeds.
 These arguments were used to justify raising speed limits on rural highways in British Columbia,
 Canada (July 2014). We used an interrupted time series approach to evaluate the impact of these
 speed limit increases on fatal crashes, auto-insurance claims, and ambulance dispatches for road
 trauma. Events were mapped to affected road segments (with increased speed limits) and to nearby
 road segments (within 5 km of an affected segment). Separate linear regression models were fitted
 for each outcome and road segment group. Models included gasoline sales to account for changes in
 vehicle travel. Our main findings were significant increases in (i) total insurance claims (43.0%; 95%
 Confidence Interval [CI] = 16.0–76.4%), (ii) injury claims (30.0%; 95% CI = 9.5–54.2%), and (iii) fatal
 crashes (118.0; 95% CI = 10.9–225.1%) on affected road segments. Nearby segments had a 25.7%
 increase in insurance claims (95% CI = 16.1–36.1%).

 Keywords: speed; speed limits; road trauma; road fatalities

1. Introduction
     Road trauma is a global public health problem that results in over 3000 deaths per day [1]. Moving
vehicles are the source of kinetic energy (EK) that causes injury in motor vehicle crashes (MVCs) and
the phrase “speed kills” highlights the central role of vehicle speed in road trauma. Higher speed
means more EK and more severe injury in event of a crash, regardless of the cause. Furthermore,
higher travel speeds make the task of driving more difficult, because drivers must perceive, interpret,
and respond to relevant stimuli at a faster rate. In complex driving environments, this may overwhelm
a driver’s perceptual or cognitive capacity, resulting in failure to recognize or respond to hazards [2–4].
Even when the driver perceives a hazard and responds appropriately, higher speed results in greater
distance travelled by the vehicle during perception and reaction times [5], and in exponentially greater
braking distance [6]. In addition, higher speeds make it more difficult to negotiate curves or manoeuver
around road hazards, and faster vehicles are more difficult for other road users to avoid.
     Most research shows that higher traffic speed results in higher rates of crashes and injuries.
In 1982, Nilsson studied a series of speed limit changes on rural highways in Sweden. He found
that, for a given highway, the rate of fatal crashes was proportionate to the fourth power of mean

Sustainability 2018, 10, 3555; doi:10.3390/su10103555                      www.mdpi.com/journal/sustainability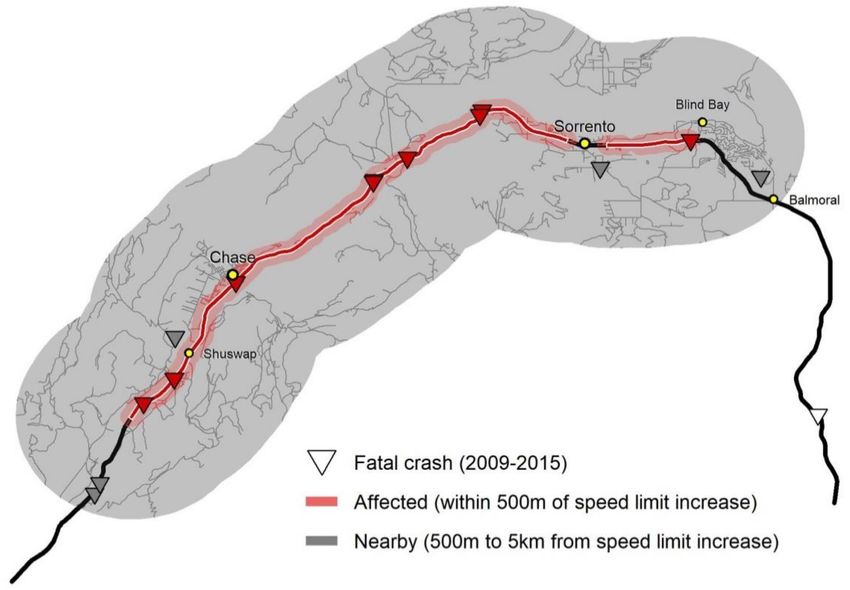
Sustainability 2018, 10, 3555                                                                         2 of 19

traffic speed, the rate of serious injury crashes to the third power, the rate of injury crashes to the
second power, and the rate of property damage only crashes were proportionate to the first power of
mean traffic speed [7]. According to this model, a 5% increase in mean traffic speed (e.g., from 100 to
105 kph), would result in a 22% increase in fatal crashes. Several meta-analyses found that Nilsson’s
“power model” is still a good fit for predicting the road trauma rate following speed limit changes on
rural highways around the world [8–10].
      The relationship between speed and injury is complex [11]. Roads can be designed for safe, high
speed travel by controlling access points, using barriers to separate opposing traffic and to prevent
drivers from running off the road, providing adequate lane width and gradual curves, and including
crash mitigation features [12–15]. Baruya analyzed speed and crash data from 139 European rural two
lane highways and found a higher frequency of injury crashes in roads with more junctions (i.e., poorly
controlled access) and/or narrower lanes, as well as roads with higher speed limits [16]. The role
of road design is reflected in the risk of fatality after a crash on different types of high speed roads.
French researchers found that crashes on rural highways were more than twice as likely to be fatal as
crashes on high speed motorways. Motorways have median barriers to prevent head-on collisions
and controlled access to prevent side impact (T-bone) collisions [17]. Crash mitigation features of
the vehicle (e.g., airbags) or road (e.g., energy absorbing barriers) can also reduce injury severity
following a collision. However, these measures are insufficient to prevent injuries in very high speed
collisions or in certain types of crashes [18,19]. The risk of fatality for properly restrained motor vehicle
occupants increases steeply at speeds >50 kph in side impact collisions and at speeds >70 kph in frontal
collisions [20,21]. Conversely, side swipe or rear end collisions between vehicles moving at similar
speeds might not cause injury even in higher speed collisions.
      There are several approaches used to set highway speed limits. North American speed limits have
traditionally been set according to the 85th percentile speed of vehicles in “free flowing traffic” [22].
The rationale is that this speed is considered safe by most drivers and extensive enforcement will be
not required, since most drivers “naturally” travel at or below this speed. Speed limits can also be set
according to roadway features, such as road geometry (narrow, curving roads have lower limits than
wide, straight roads) or roadside development (lower speed limits in areas with more “urban” roadside
development and/or more driveways). Another approach is to choose “optimal speed limits” that
minimize competing costs, such as travel time, crashes, noise, pollution, and road maintenance, as well
as safety [9,23,24]. Jurisdictions with the safest roads approach road safety from a “safe systems”
perspective [21] and set speed limits based on the type of crashes that could occur and the human
body’s capacity to tolerate kinetic energy in different crash types. These limits are 30 km/h in areas
where pedestrians or bicyclists may be struck by motor vehicles, 50 km/h in intersections where
side impact vehicle–vehicle collisions may occur, 70 km/h on undivided highways, where head-on
crashes may occur, and above 70 km/h on divided highways, where a median or guard rail provides
protection from head-on crashes [6,25,26].
      In Canada, vocal motorist groups such as SENSE (Speed Education Not Speed Enforcement) in
British Columbia (BC) [27] and Stop100 in Ontario [28] lobby for higher speed limits and reduced
speed enforcement. Proponents of higher speed limits note that road trauma is decreasing [29,30]
despite increased traffic speed [31]. Because modern vehicles are safer and handle better at high
speed, they argue that older studies, such as those evaluating the US National Maximum Speed Limit
(NMSL), no longer apply. Many proponents of higher speed limits suggest that increasing speed
limits will reduce speed variance and therefore decrease dangerous encounters between vehicles,
and ultimately improve road safety. The thinking is that drivers exceeding the speed limit are driving
at their comfort level and will continue at that speed after the limits are increased, whereas slower
drivers will drive faster if the limits are increased [27,32,33]. Indeed, there is evidence that roads
with higher speed variance have higher crash rates [19,34–36]. However, instead of decreasing speed
variance, the evidence suggests that higher speed limits either have no effect [37–39], or increase
variance [19,40,41]. Another pro-speed argument is that, when speed limits are higher, fewer drivers
Sustainability 2018, 10, 3555                                                                        3 of 19

exceed the speed limit, so police can divert enforcement efforts onto more dangerous roads [33]. Some
also suggest that increased freeway speed limits will divert traffic from unsafe secondary highways
onto safer freeways. However, Grabowski (2007) analyzed US crash statistics from 1982–2002 and
found that the repeal of the NMSL was associated with a 36% increase in fatalities on rural interstates
with little support for any decrease in non-interstate driving or fatalities [42].
     On 2 July 2014, following a public consultation, the British Columbia (BC) Ministry of
Transportation and Infrastructure (MoTI) increased speed limits on 1300 km of provincial highways
(9% of BC’s paved highways). They increased the maximum speed in BC from 110 kph to 120 kph—the
highest in Canada. MoTI stated that the goal was to improve road safety by reducing speed
variance [43]. This manuscript reports findings from a comprehensive evaluation of BC’s new speed
limits. We studied adverse motor vehicle incidents (MVIs), including ambulance calls for road trauma,
auto-insurance claims, and police-reported crashes occurring on the affected road segments. To account
for potential spillover effects [44], we also studied MVIs on nearby roads and across the province.
We use an interrupted time series approach to account for pre-existing trends and we include gasoline
sales in our model to account for changes in travel. Our evaluation will study the effects of BC’s speed
limit increases on mean traffic speed and variance and will look for changes in MVI rates on secondary
highways that were not directly affected by the speed limit changes.
     The paper is organized into the following sections: Methods, Results, Discussion, Limitations,
and Conclusions. The Methods section describes the data sources used in this evaluation and our
analysis plan. In the Results section, we present our findings in detail. The Discussion section interprets
our findings in the context of previous research. In the Limitations section, we briefly discuss how
shortcomings of available data may have affected our findings. Finally, in the Conclusions, we succinctly
summarize key findings and give recommendations.

2. Methods

2.1. Overview
     We used de-identified administrative data (data sources described in Section 2.2) and obtained
approval from our institutional research ethics board. Briefly, we obtained shapefiles of BC’s rural
highway system and used GIS coordinates to map crashes and ambulance dispatches onto relevant
road segments (mapping described in Section 2.3). Events occurring within 500 m of a road segment
where the speed limits had been increased were considered to have occurred on the affected segment.
For “nearby segments”, we considered events occurring within 5 km of an affected segment (Figure 1).
We then used an interrupted time-series approach to model the impact of the higher speed limits
on monthly rates of ambulance dispatches for road trauma and on crashes (analysis described in
Section 2.4). We assessed the intervention effects using a linear regression model with an autoregressive
integrated moving average (ARIMA) error term.
Sustainability 2018, 10, 3555                                                                       4 of 19

      Figure 1. Illustration of how crashes were mapped to “nearby” and “affected” segments. This map
      depicts fatal crashes on a segment of Highway 1 between Kamloops and Salmon Arm, where speed
      limits were increased from 90 kph to 100 kph.

2.2. Data Sources
      We obtained BC data from (i) MVC fatalities from police reports (2000–2015), (ii) automobile
insurance claims (2000–2016), (iii) ambulance call dispatches (2004–2016), gasoline sales (2009–2016),
and vehicle speed travel data from permanent count stations (2005–2016). Data included in the analysis
were chosen based on availability and completeness of each dataset. In particular, since we included
gasoline sales in our model, we did not use crash data prior to 2009 in the final analysis. Tables 1 and 2
list the crash events studied in this report.
Sustainability 2018, 10, 3555                                                                                                                                           5 of 19

              Table 1. Annual event count and percentage of events with missing GIS coordinates across all road segments in British Columbia, July 2000–June 2016.

                                                                                               British Columbia
                                      All Claims           Casualty Claims              Police Reported              Fatal Crashes     Ambulance Dispatches   Gas Sales
                                                                               Count (% Missing GIS Coordinates)                                              (Billion L)

               Total            4,242,998     (29%)      853,429       (20%)         625,988        (21%)          4,968       (17%)   375,163       (7%)        34.3
       July 2000–June 2001      248,465       (41%)       53,437       (28%)          43,081        (30%)          344         (22%)
       July 2001–June 2002      262,618       (33%)       53,684       (23%)          47,213        (25%)          382         (17%)
       July 2002–June 2003      244,508       (31%)       52,880       (22%)          47,179        (20%)          387         (13%)
       July 2003–June 2004      248,595       (29%)       52,305       (21%)          49,432        (19%)          403         (12%)
       July 2004–June 2005      248,982       (28%)       52,049       (19%)          49,576        (19%)          402         (14%)    35,712      (14%)
       July 2005–June 2006      254,562       (29%)       52,589       (20%)          50,446        (19%)          395         (14%)    36,641      (14%)
       July 2006–June 2007      274,684       (30%)       52,158       (20%)          49,367        (20%)          343         (15%)    36,496      (14%)
       July 2007–June 2008      274,093       (29%)       52,028       (20%)          44,302        (21%)          354         (13%)    35,526      (14%)
       July 2008–June 2009      276,462       (29%)       49,729       (20%)          36,518        (20%)          309         (14%)    32,138      (15%)
       July 2009–June 2010      256,543       (29%)       50,642       (19%)          34,402        (20%)          345         (18%)    30,329      (10%)        4.80
       July 2010–June 2011      259,966       (30%)       51,939       (20%)          35,229        (20%)          277         (19%)    27,845       (0%)        4.80
       July 2011–June 2012      257,546       (30%)       53,091       (20%)          34,531        (21%)          269         (29%)    27,671       (0%)        4.66
       July 2012–June 2013      260,569       (29%)       54,704       (19%)          34,880        (20%)          242         (23%)    27,223       (0%)        4.54
       July 2013–June 2014      266,920       (29%)       54,294       (21%)          34,442        (20%)          245         (24%)    26,446       (0%)        4.60
                                                                        Speed Intervention
       July 2014–June 2015      292,568       (27%)       57,214       (21%)          35,390        (17%)          271         (20%)    28,647       (0%)        5.17
       July 2015–June 2016      315,917       (22%)       60,686       (15%)                                                            30,489       (0%)        5.77
             Average            265,187       (30%)       53,339       (21%)          41,733        (21%)          331         (18%)    31,264       (7%)        4.90
Sustainability 2018, 10, 3555 6 of 19
Table 2. Annual event count on segments affected by speed limit increases and on segments nearby to speed limit increases, July 2000–June 2016.
Affected 1 Nearby 2
Casualty Police Fatal Ambulance Casualty Police Fatal Ambulance
All Claims All Claims
Claims Reported Crashes Dispatches Claims Reported Crashes Dispatches
Total 23,772 5518 24,678 488 16,298 131,109 25,657 34,994 275 22,177
July 2000–June 2001 713 206 1543 43 4731 1251 1903 20
July 2001–June 2002 1053 253 1924 40 6642 1385 2367 22
July 2002–June 2003 1100 281 2001 42 6423 1462 2644 14
July 2003–June 2004 1214 337 2195 42 6733 1547 2776 14
July 2004–June 2005 1215 292 1982 39 827 7157 1617 2823 23 1856
July 2005–June 2006 1280 303 2139 46 940 7468 1646 2965 29 1943
July 2006–June 2007 1438 315 2176 39 1075 8286 1644 2902 14 2039
July 2007–June 2008 1696 387 1843 30 1164 8881 1651 2531 27 1981
July 2008–June 2009 1676 370 1527 27 1054 8979 1638 2224 22 1812
July 2009–June 2010 1460 341 1278 25 1089 8238 1620 1966 22 1859
July 2010–June 2011 1607 395 1401 30 1770 8417 1611 1985 14 1857
July 2011–June 2012 1445 322 1267 26 1568 8265 1583 1899 10 1700
July 2012–June 2013 1473 352 1136 7 1486 8467 1609 1930 19 1619
July 2013–June 2014 1728 396 1050 19 1575 9392 1668 1921 16 1654
Speed Intervention
July 2014–June 2015 2122 443 1216 33 1720 10,817 1728 2158 9 1883
July 2015–June 2016 2552 525 2030 12,213 1997 1974
Average 1486 345 1645 33 1358 8194 1604 2333 18 1848
1 2
Road segments that are within 500 m crow-flies distance of a segment where speed limits were increased. Road segments that are between 500 m and 5 km crow-flies distance from
a segment where speed limits were increased.Sustainability 2018, 10, 3555 7 of 19
2.2.1. Fatal Crashes
The BC traffic accident system (TAS) contains details of all police-reported crashes in BC, including
crash locations. The TAS is reconciled with coroner’s data to ensure that it captures all fatal crashes
(i.e., those died on a public road and within 30 days of the crash). Not all non-fatal crashes are captured,
since police attendance at non-fatal crashes is discretionary. For this reason, the only data used from
TAS were fatal crashes. For our analysis, we included fatal crashes occurring between 2009 and 2015.
2.2.2. Insurance Claims
The Insurance Corporation of British Columbia (ICBC) is the sole provider of basic automobile
insurance in BC. All crashes that involve a BC registered vehicle and result in an insurance claim
are reported to ICBC. Claims are based on driver’s reports and include date and location of
crash, crash configuration, crashes involving vulnerable road users (pedestrians, pedal cyclists,
and motorcyclists), and crashes involving a heavy vehicle. We excluded out-of-province incidents,
vandalism, and incidents occurring in a parking lot. Because they are self-reported, claims do not
include contributory factors, such as impaired driving. We included accident claims from 2009–2016 in
our analysis.
2.2.3. Ambulance Dispatches
The BC Ambulance Service provides emergency medical service for the entire province. Each call
for emergency medical assistance is assigned one of 32 Advanced Medical Priority Dispatch System
(AMPDS) numbers using standardized questions. Multiple calls for the same event are combined
into a single dispatch record. We used ambulance dispatches for Traffic/Transportation Incidents
(AMPDS # 29) as a measure of ambulance service utilization by road injury victims. Ambulance calls
for non-MVC trauma were used as controls. We included ambulance dispatches from 2010–2016 in our
analysis. Dispatches prior to 2010 were excluded because of missing location data (GIS coordinates).
2.2.4. Gasoline Sales
Gasoline sales (in liters) between January 2009 and July 2016 were obtained from the BC Ministry
of Finance. We included taxable and tax-exempt sales for gasoline and ethanol blended gas as
a surrogate for vehicle travel. Fuel purchased in BC and resold in other jurisdictions was excluded.
2.2.5. Travel Speed
In British Columbia, permanent count stations record the number of vehicles passing the count
station every hour (for each travel direction). Between 2005 and 2016, there were 336 permanent count
stations that recorded traffic volumes at 185 unique sites, with 11 of these sites located on one of the
affected segments. In addition to hourly counts, vehicle speed is captured in “speed bins” that record
the number of vehicles travelling at various speed ranges (e.g., 120 kph). Speed bin data were available for 77 unique sites, corresponding to 149 permanent
count stations. Note that different count stations use different binning schemes and the binning
schemes for a given count station sometimes change over time.
2.3. Mapping
We obtained shapefiles of affected road segments from the BC Ministry of Transportation and
Infrastructure. Crashes and ambulance dispatches were mapped to affected road segments and nearby
road segments, using GIS coordinates of the crash that are included in these datasets. For insurance
claims, crash location is reported by the claimant and then converted to GIS coordinates if the
information provided is sufficient and verifiable. To account for possible errors in mapping crashes to
exact location, we considered events occurring within 500 m of an affected segment to have occurredSustainability 2018, 10, 3555 8 of 19
on the affected segment. Crashes on nearby segments were defined as events occurring between 500 m
and 5 km from an affected segment (Figure 1).
2.4. Analysis
For each outcome, counts were aggregated by month and converted to rates per 1,000,000 BC
residents. Rates were adjusted to account for the number of days in each month. The time before
intervention was chosen a priori to accommodate data availability. Adjustment for gasoline sales
was particularly limiting, since it has the shortest date range. The period of analysis was January
2009–December 2015 (n = 66 pre, n = 18 post) for police reported crashes, January 2009–July 2016
(n = 66 pre, n = 25 post) for insurance claims, and October 2010 to July 2016 (n = 45 pre, n = 25 post) for
ambulance dispatches. Only ambulance data fail to exceed the recommended minimum number of
observations required for time series analyses [45]. The rate of missing GIS coordinates for ambulance
dispatches dropped from 13% in 2009 to zero in mid-2010 and we elected to limit our analysis to the
period of time with complete data for this outcome.
Event rates were analyzed using an interrupted time series approach. We fit separate linear
regression models for each outcome and for each road segment group (affected, nearby, and all
segments in the province). The models included the following covariates (when applicable): (1)
Speed limit intervention, (2) other BC traffic law interventions (e.g., Immediate Roadside Prohibitions
for drinking drivers—IRPs) [46], (3) gasoline sales, and (4) missing data percentage. The speed
limit (July 2014) and IRP (October 2010) interventions were modelled with indicator variables and
were both treated as abrupt and permanent. We included gasoline sales in the model to account
for changes in vehicle travel over the course of the study. During the analysis period, 21% of fatal
crashes and 27% of insurance claims could not be mapped to road segments due to missing GIS
coordinates. We included the monthly percentage of events with missing GIS coordinates to account
for improvement in reporting of crash location overtime. The residual error term was fit with a seasonal
ARIMA model to control for seasonality, autocorrelation, and data instability.
ARIMA modelling is an iterative three-step process that includes model identification, estimation,
and verification. The process repeats until model assumptions of normality and stationarity are
satisfied. In the interest of estimating a multiplicative relationship between event rates and the
intervention, we applied the natural-log transformation to the event rate as long as no assumptions
were violated. Moreover, we applied first-order non-seasonal and seasonal differencing to make the
time series stationary where necessary. We determined the ARIMA order of the stationary time series
using visual inspection of the autocorrelation function (ACF) and partial autocorrelation function
(PACF). Provided that more than one possible model represented acceptable results, the model having
the lowest corrected Akaike information criterion (AICc) was selected. The ARIMA error model was
not constrained to be the same across segment types or outcomes.
All models were fitted using conditional-sum-of-squares to find starting values. Final estimates
were obtained by maximum likelihood. All regression analyses were performed in R v3.0.1
(R Foundation for Statistical Computing, Vienna, Austria), using the forecast package [47]. p <
0.05 was considered statistically significant; all tests are two-sided.
Analysis of Speed Data
Vehicle speed statistics (mean, median, standard deviation) were calculated by assigning each
vehicle in a “speed bin” to the midpoint speed for that bin. For example, all vehicles in the 60–70 kph
bin were assigned a speed of 65 kph. Vehicles in the highest speed bin were assigned the lowest
speed in that bin (e.g., vehicles in the ≥120 kph bin would be assigned a speed of 120 kph). Similarly,
vehicles in the lowest speed bin were assigned the highest speed in that bin. Statistical analysis of
speed data was limited because of inconsistency in binning schemes between sites and over time, lack
of vehicle-level data due to use of binning, and missing data. Thus, we opted to simply report simple
speed statistics without any tests of significance.Sustainability 2018, 10, 3555 9 of 19
Hourly speed statistics were converted to an average monthly time series for each count site and
then summarized in the one-year periods before (July 2013–June 2014) and after (July 2014–June 2015)
the speed limit changes. In each period, speed statistics for both affected and non-affected roads were
averaged by season (spring, summer, fall, winter). To ensure comparability of statistics in the before
and after periods, we only included count stations with 12 months of data in each period. One hundred
and five count stations met this criterion and were included in the analysis. Forty-four count stations
were excluded due to missing data.
3. Results
Over the course of the study, there were annual averages of 265,187 crashes resulting in an
insurance claim (2000–2016), 31,264 ambulance dispatches for road trauma (2004–2016), 41,733 police
reported crashes (2000–2015), and 331 fatal crashes (2000–2015). Location data were missing for 29% of
insurance claims, 7% of ambulance dispatches, 21% of police reported crashes, and 17% of fatal crashes
(Table 1).
According to our model, there were large and statistically significant increases in total insurance
claims (43.0% increase; 95% CI = 16.0% to 76.4%, p = 0.001)), injury claims (30.0%; 95% CI = 9.5% to
54.2%, p = 0.003), and fatal crashes (118.05; 95% CI = 10.9% to 225.1%, p = 0.031) on affected road
segments. There was no significant change in ambulance dispatches on affected road segments (8.8%;
95% CI = −7.0% to 27.3%, p = 0.291). For nearby road segments, our model estimated a 25.7% increase
in insurance claims (95% CI = 16.1% to 36.1%, p < 0.001). There were no other statistically significant
changes on nearby segments, but it is worth noting that the point estimate for change in fatal crashes
on nearby segments was −46.7% (95% CI = −115.6% to −22.2%, p = 0.184). However, there were more
fatal crashes on affected segments than on nearby segments and, in a model that included both affected
and nearby segments, there was a 39.9% percent increase (95% CI = −18.5% to 98.2%, p = 0.180) in fatal
crashes. At the provincial level, our model indicated a slight increase in casualty claims (4.8%; 95% CI
= 1.6% to 8.1%, p = 0.003). Table 3 summarizes these results. Figures 2 and 3 illustrate the change in
fatal crashes on affected and nearby segments in the year before versus after the speed limit changes.
Figure 4 shows time series plots.
Table 3. Estimated percent change in the monthly event rate post speed intervention. Each estimate is
derived from a separate linear regression model with an autoregressive integrated moving average
(ARIMA) error structure.
Estimate 1 (95% CI), p-Value
Affected 2 Nearby 3 BC
All claims 4 43.0 (16.0, 76.4), 0.001 25.7 (16.1, 36.1)Sustainability 2018, 10, 3555 10 of 19
Figure 2. Map of fatal crashes on affected segments in the one-year periods before (July 2013–June 2014)
and after (July 2014–June 2015) speed limit increases. Segments of highway where speed limits were
increased are highlighted in red. Fatal crashes are indicated with red triangles.
Figure 3. Number of fatal crashes in the one year periods before (July 2013–June 2014) and after
(July 2014–June 2015) speed limit increases aggregated by proximity to road segments where speed
limits were increased.Sustainability 2018, 10, 3555 11 of 19
Figure 4. Monthly time series of crash event rates per 1,000,000 BC residents on affected segments.
Data displayed reflect the period of analysis for interrupted time series models. The red dotted
curve represents the smoothed annual average from the fitted models, with breaks allowed at traffic
policy interventions.
Speed data from the permanent vehicle count stations showed small increases in estimated
travel speed and speed variance, on both affected and non-affected segments, in the year following
the speed limit increases, compared to the year before. These changes were higher in spring and
winter (Table 4, Figure 5).Sustainability 2018, 10, 3555 12 of 19
Table 4. Average hourly speed statistics at permanent vehicle count stations by season in the one-year
periods before (July 2013–June 2014) and after (July 2014–June 2015) speed limit increases. Forty-four
count stations with missing data during these time periods were excluded.
All Stations Affected Stations Non-Affected Stations
(n = 105) (n = 16) (n = 89)
Average hourly Before After Before After Before After
Mean speed (kph) 90.0 90.7 94.0 94.3 89.2 90.0
Median speed (kph) 90.3 91.1 94.8 95.1 89.5 90.4
85th percentile speed (kph) 100.4 101.3 104.7 105.3 99.6 100.6
Standard deviation speed (kph) 11.4 11.5 11.6 11.9 11.3 11.5
Traffic volume 397 406 237 250 425 434
Spring (March, April, May)
Mean speed (kph) 90.8 92.0 94.6 96.1 90.1 91.3
Median speed (kph) 91.2 92.4 95.4 96.9 90.4 91.6
85th percentile speed (kph) 101.2 102.6 105.3 106.9 100.4 101.8
Standard deviation speed (kph) 11.3 11.5 11.5 11.8 11.2 11.4
Traffic volume 392 408 227 245 422 437
Summer (June, July, August)
Mean speed (kph) 91.0 91.3 94.7 94.5 90.4 90.8
Median speed (kph) 91.4 91.7 95.4 95.3 90.7 91.1
85th percentile speed (kph) 101.6 102.1 105.5 105.5 100.8 101.5
Standard deviation speed (kph) 11.3 11.5 11.5 11.9 11.3 11.4
Traffic volume 444 450 300 315 470 474
Fall (September, October, November)
Mean speed (kph) 90.1 90.4 94.8 94.2 89.3 89.8
Median speed (kph) 90.5 90.9 95.7 95.0 89.6 90.1
85th percentile speed (kph) 100.6 101.1 105.5 105.2 99.7 100.4
Standard deviation speed (kph) 11.4 11.6 11.6 12.0 11.4 11.5
Traffic volume 400 399 226 234 431 429
Winter (December, January, February)
Mean speed (kph) 87.8 88.9 91.7 92.5 87.1 88.3
Median speed (kph) 88.2 89.3 92.6 93.3 87.4 88.6
85th percentile speed (kph) 98.2 99.5 102.7 103.5 97.4 98.7
Standard deviation speed (kph) 11.5 11.6 11.9 12.0 11.4 11.5
Traffic volume 351 367 196 206 379 395
Figure 5. Average hourly 85th percentile speed and corresponding 95% confidence interval (nonparametric
bootstrap) in the one year periods before (July 2013–June 2014) and after (July 2014–June 2015) speed limit
increases at affected permanent count stations and non-affected permanent count stations.Sustainability 2018, 10, 3555 13 of 19
4. Discussion
4.1. Previous Evaluations of Speed Limit Changes
A large body of previous research shows that raising speed limits is associated with increased
road trauma and lowering speed limits with a reduction in road trauma [9,19,26]. In 1974, during
an international fuel crisis, the US established a national maximum speed limit (NMSL) of 55 mph.
In 1987, in a partial repeal of the NMSL, States were allowed to raise speed limits to 65 mph on rural
interstates. In 1995, NMSL laws were fully repealed and States were allowed to establish speed limits
on all roads. In 1981, the US Department of Transportation concluded that the NMSL laws had saved
over 40,000 lives between 1974 and 1979 [48]. In 1989, McKnight studied the effects of the partial NMSL
repeal and reported a 22% increase in fatalities on rural interstates [49]. Garber (1990) studied fatal
crashes in the 40 States that raised their speed limits and found 15% more fatalities than predicted on
the rural interstates and 5% more fatalities on rural non-interstates [50]. Baum (1991) reported that the
40 states that increased their speed limits had a 19% increase in fatalities on rural interstates relative
to other rural roads, whereas the States that did not increase speed limits had a 12% decrease [51].
Following the full repeal of the NMSL, Farmer (1999) studied the 12 States that increased speed limits
and found a 15% increase in fatalities on rural interstates and a non-significant 3% increase on other
highways. He concluded that the raised limits made interstates less safe and did not improve safety
on other roads [52]. Patterson found a 38% increase in fatalities in states that raised speed limits to
75 mph and a 35% increase in states that raised limits to 70 mph. In addition, speed limit increases were
associated with more road trauma in Michigan [53]. Illinois [54], New Mexico [55], Washington [40],
Alabama [56], and Utah [57], as well as in Israel [44,58], Australia [59,60], Sweden [7], and across
Europe [16,61].
It should be noted that a few evaluations of the NMSL repeal concluded that the increased
limits were associated with improved road safety. A Cato Institute report entitled “Speed doesn’t
kill” concluded that the speed limit increases were associated with significantly fewer injuries,
an insignificant increase in fatalities, and a considerable cost benefit. They did not report their
methods but seem to have used a simple before–after comparison of fatality rates (ignoring long-term
downward trends) [62]. Similarly, a New York study also used a before vs after design and found 28%
fewer fatalities per vehicle kilometer travelled (VKT) on New York freeways after speed limits were
increased from 55 to 65 mph. When compared to surrounding roads (ignoring a potential “spillover
effect”), the decrease was 52% [63]. Finally, Lave looked at statewide changes in road fatalities and
found a 3% to 5% reduction in fatalities in states that raised speed limits [32]. However, Lave’s
analysis ignored the long-term downward trend in fatalities, did not account for changes in VKT, and
included fatalities on urban roads which were not affected by speed limit changes [42,64]. Greenstone
reanalyzed the same data as Lave and found a sharp increase in fatalities on rural interstates as well
as an even larger decline in urban fatalities, which together resulted in a non-significant decline in
statewide fatalities [64].
4.2. There Were More Crashes Following the Speed Limit Increases in British Columbia
Consistent with the majority of previous evaluations of speed limit increases (see Section 4.1),
our evaluation found increases in fatal, injury, and total crashes on the road segments where speed
limits were increased. The increase in crashes, and especially fatal crashes, in our analysis was larger
than previously reported. In particular, we found that the number of fatal crashes on affected road
segments more than doubled (118% increase) following BC’s speed limit increases, whereas previous
evaluations of speed limit increases from other jurisdictions found increases in fatalities ranging up
to 38%. Part of this difference may be explained by BC’s unique environment. Travel in rural BC
is particular hazardous because of a harsh winter climate, mountainous terrain causing curvilinear
alignments, fewer roundabouts (which reduce risk of side impact collisions), and the fact that large
regions of the province are remote, with limited access to post-crash trauma care [65]. AnotherSustainability 2018, 10, 3555 14 of 19
explanation may be the “pro-speed” rhetoric that accompanied the speed limit increases in BC. Many
commentators, including the then Minister of Transportation, suggested that slower drivers, even
when traveling at the posted speed limit, were as dangerous as excessively speeding drivers [66].
Another factor is that, rather than studying provincial-level changes as was done in many previous
evaluations, we reported changes in event rates only on the road segments affected by the increased
speed limits. In addition, although we used gasoline sales to control for vehicle travel, it is possible
that drivers preferentially chose roads with higher speed limits, resulting in relatively more travel on
the affected segments and less travel elsewhere. In support of this hypothesis, we found a decrease
in fatal crashes, albeit statistically non-significant, on nearby roads. Despite this decrease on nearby
segments, there was an overall increase in fatal crashes on affected and nearby segments combined
(Figures 2 and 3).
4.3. Spillover
We were interested in investigating whether the higher speed limits resulted in a spillover effect
whereby increased travel speed on highways results in higher travel speed and increased crashes on
nearby roads as well. Results in support of this hypothesis were mixed. Our finding of significantly
higher rates of auto-insurance claims (25.7% increase) on nearby road segments supports the existence
of a spillover effect. Conversely, the reduction of fatal crashes on nearby segments, although based on
small numbers and not statistically significant, goes against spillover. It is possible that there was a true
spillover effect, but that improvements to road infrastructure on nearby segments in preparation for
the speed limit increase led to a reduction in fatal crashes (or at least prevented an increase), but were
insufficient to prevent an increase in minor crashes that resulted in insurance claims. It is also possible
that there was no spillover effect and the increase in insurance claims on the affected segments was
due to other factors, such as building of new, low speed side streets or changes in how auto-insurance
claims were measured (see limitations section).
4.4. Travel Speed
Highway traffic speed is influenced by many factors, including speed limits [67,68]. Changes
in the posted speed limit result in corresponding changes in mean traffic speed, although usually
of a smaller magnitude than the speed limit change [9,41]. Finch reviewed speed limit changes in
multiple jurisdictions and found that the change in traffic speed was approximately 14 the change in
speed limit. In other words, if the speed limit increased by 10 kph, mean traffic speed would increase
by approximately 2.5 kph [10], although the speed increase may be greater [40,69]. Speed spillover
may also occur: Increases or decreases in freeway speed limits can be associated with similar changes
in travel speed on surrounding roads with unchanged speed limits [54,58].
We were interested in studying how the increased speed limits affected travel speed, particularly
during the spring and winter seasons, when BC road conditions tend to be snowy or icy. We also
wanted to see if there was any evidence of a decrease in speed variance—one of the pro-speed
arguments put forward to justify the speed limit increases. Unfortunately, limitations in travel speed
data meant that we could not explore these questions in detail. As a result, we chose to use a simple
before/after comparison of vehicle speeds as measured on a limited number of count stations. Using
these methods, we found small increases in travel speed and no evidence of a decrease in speed
variance (in fact, variance increased slightly). Our speed analysis is limited by the fact that we do
not know the speed of vehicles in the fastest “speed bins” and we assumed that their speed did not
increase following the speed limit changes. If the speed of fastest vehicles did increase following the
speed limit increases, then both travel speed and speed variance would have increased more than
we predicted.Sustainability 2018, 10, 3555 15 of 19
5. Limitations
Our evaluation has several limitations related to data quality and completeness. In particular, the
findings related to auto-insurance claims should be interpreted with caution. In 2013, ICBC transitioned
to a new system for reporting insurance claims. Although ICBC has made every effort to ensure that
crash counts and location data generated from the new and old system are comparable, we recognize
that claims data from 2014 onward may not be directly comparable to prior data. As a result, changes
in the number of claims on affected segments in 2014 may be due to the data reporting system rather
than the speed intervention. However, this explanation does not consider the fact that there was no
change in claims at the provincial level. Note that this limitation only applies to auto-insurance claims
and not to fatal crashes, nor to ambulance dispatches. Another limitation is the large percentage of
crashes with missing location data. There were large improvements in location data for auto-insurance
claims over time. Although our model included a percentage of crashes with missing location data, it
is conceivable that the increase in insurance claims for crashes on affected segments is due to more
mappable crashes, especially if there is a location bias in the missing data. Note that the percentage of
fatal crashes with missing location data is fairly stable over time, so this problem is less likely to affect
our conclusions for fatal crashes. We should also note that missing location data do not affect our
conclusions for ambulance dispatches, since we restricted that analysis to events occurring after 2010,
when all dispatch records included the GIS location that the ambulance was sent to. Gasoline sales
data also have limitations. Sales are recorded in the month the sale occurred and do not necessarily
reflect fuel used in that month. Furthermore, since some gasoline is used for other purposes, such as
chain saws, lawn mowers, and mining equipment, sales volumes may not precisely measure fuel used
for road transportation. However, most gasoline sales are for vehicles and trends in gasoline sales are
likely to reflect temporal changes in vehicle kilometers travelled.
Vehicle speed data had many limitations. Speed data were aggregated into hourly speed bins
instead of providing actual speed of individual vehicles. This was a particular problem for vehicles in
the fastest speed bin and, as a result, we have little information on the speed of the fastest vehicles.
Another major limitation was that the binning scheme was inconsistent with different binning schemes
used at different count stations and over time on the same count station. Missing data were a limitation
at many count stations. A final limitation is that there were relatively few count stations on affected
road segments, providing a very limited picture of speed changes across the affected segments. Because
of these limitations in speed data, we chose to report simple descriptive statistics pre versus post speed
limit changes without any tests of significance.
6. Conclusions
Following the increase in rural highway speed limits in British Columbia, there was a marked
deterioration in road safety on the affected roads. The number of fatal crashes more than doubled
(118% increase) on roads with higher speed limits. Affected roads also had a 43% increase in total
auto-insurance claims and a 30% increase in auto-insurance claims for injuries due to crashes.
Evidence of a spillover effect (i.e., where higher speed limits result in increased travel speed and
more crashes on nearby roads) was mixed. In support of a spillover effect, we found a 26% increase in
auto-insurance claims on nearby road segments. However, going against a spillover effect, we also
found a reduction (although not statistically significant) in fatal crashes on nearby road segments.
It should be noted that the absolute increase in fatal crashes on affected roads was larger than the
decrease on nearby roads, and there was a net increase in the total number of fatal crashes that occurred
on either affected roads or nearby roads.
The speed limit increases generated vigorous public debate, with pro speed advocates claiming,
for example, that slower drivers were as dangerous as speeding drivers. There was concern that this
“pro-speed rhetoric” would result in increased travel speed and more crashes across the province.
Fortunately, there was only limited evidence of worsening road safety at a provincial level. We didSustainability 2018, 10, 3555 16 of 19
find a 4.8% increase in auto-insurance claims for injuries due to crashes at a provincial level, but no
significant worsening in other crash indicators.
Based on our findings, we recommend that British Columbia roll back the 2014 speed limit
increases. Future speed limits should be set in accordance with the safe systems approach and not
based on the 85th percentile of summer travel speed. Other jurisdictions, especially those with harsh
winter climates or with highways that traverse mountainous terrain, should learn from this experience
and resist pressure from pro speed advocates to raise speed limits without due consideration of
road safety.
Author Contributions: J.R.B., H.C., and G.L. conceived of the project. The analysis plan was developed by S.E.,
H.C. and F.F. S.E. conducted the analysis. J.R.B. wrote the first draft of the manuscript. All authors contributed to
the final manuscript.
Funding: The project was funded by the Canadian Institutes for Health Research (grant number: GIR-145127).
Brubacher is funded by a scholar award from the Michael Smith Foundation for Health Research.
Conflicts of Interest: The authors declare no conflicts of interest.
References
1. World Health Organization. Global Status Report on Road Safety 2013: Supporting a Decade of Action;
World Health Organization: Geneva, Switzerland, 2013.
2. Shinar, D. Speed and safety. In Traffic Safety and Human Behaviour; Shinar, D., Ed.; Emerald Group Publishing
Limited: Bingley, UK, 2007; pp. 273–322.
3. Wu, C.; Liu, Y. Queuing network modelling of driver workload and performance. IEEE Trans. Intell.
Transp. Syst. 2007, 8, 528–537.
4. Engström, J.; Johansson, E.; Östlund, J. Effects of visual and cognitive load in real and simulated motorway
driving. Transp. Res. Part F Traffic Psychol. Behav. 2005, 8, 97–120. [CrossRef]
5. Navon, D. The paradox of driving speed: Two adverse effects on highway accident rate. Accid. Anal. Prev.
2003, 35, 361–367. [CrossRef]
6. United Nations Road Safety Collaboration. Speed Management: A Road Safety Manual for Decision-Makers
and Practitioners; Global Road Safety Partnership; United Nations Road Safety Collaboration: Geneva,
Switzerland, 2008.
7. Nilsson, G. (Ed.) The effects of speed limits on traffic crashes in Sweden. In Proceedings of the International
Symposium on the Effects of Speed Limits on Traffic Crashes and Fuel Consumption; Organisation for
Economy, Co-Operation, and Development (OECD): Paris, France; Dublin, Ireland, 1982.
8. Nilsson, G. Traffic Safety Dimensions and the Power Model to Describe the Effect of Speed on Safety; Bulletin 221;
Lund Institute of Technology: Lund, Sweden, 2004.
9. Elvik, R. Speed Limits, Enforcement, and Health Consequences. Annu. Rev. Public Health 2012, 33, 225–238.
[CrossRef] [PubMed]
10. Finch, D.J.; Kompfner, P.; Lockwood, C.R.; Maycock, G. Speed, Speed Limits and Accidents; Project Report
No.: 58; Transport Research Laboratory: Crowthorne, Berkshire, 1994.
11. Shinar, D. Speed and Crashes: A Controversial Topic and an Elusive Relationship. In Managing
Speed: Review of Current Practice for Setting and Enforcing Speed Limits; Appendix, B; Special Report, 254;
Transportation Research Board TRB, Committee for Guidance on Setting and Enforcing Speed Limits;
National Academy Press: Washington, DC, USA, 1998.
12. Labi, S. Effects of Geometric Characteristics of Rural Two Lane Roads on Safety; School of Civil Engineering
and Center for the Advancement of Transportation Safety (CATS), Purdue University: West Lafayette, IN,
USA, 2006.
13. Bunn, F.; Collier, T.; Frost, C.; Ker, K.; Roberts, I.; Wentz, R. Area-wide traffic calming for preventing traffic
related injuries. Cochrane Database Syst. Rev. 2003, 1, CD003110. [CrossRef] [PubMed]
14. Jaarsma, R.; Louwerse, R.; Dijkstra, A.; de Vries, J.; Spaas, J.-P. Making minor rural road networks safer:
The effects of 60 km/h-zones. Accid. Anal. Prev. 2011, 43, 1508–1515. [CrossRef] [PubMed]
15. Public Works and Water Management. Sustainable Safe road Design: A Practal Manual; World Bank and the
Dutch Ministry of Transport; Public Works and Water Management: Hague, The Netherlands, 2005.Sustainability 2018, 10, 3555 17 of 19
16. Baruya, A. Speed-accident relationships on European roads. In Proceedings of the 9th International
Conference Road Safety in Europe, Bergisch Gladbach, Germany, 21–23 September 1998; Part 10: Speed
Management and Road Safety. Swedish National Road and Transport Research Institute: Linköping,
Sweden, 1998.
17. Martin, J.L.; Lenguerrand, E. A population based estimation of the driver protection provided by passenger
cars: France 1996–2005. Accid. Anal. Prev. 2008, 40, 1811–1821. [CrossRef] [PubMed]
18. Johnston, I. Reducing injury from speed related road crashes. Inj. Prev. 2004, 10, 257–259. [CrossRef]
[PubMed]
19. Aarts, L.; van Schagen, I. Driving speed and the risk of road crashes: A review. Accid. Anal. Prev. 2006,
38, 215–224. [CrossRef] [PubMed]
20. Richards, D.; Cuerden, R. The Relationship between Speed and Car Driver Injury Severity; Department for
transport: London, UK, 2009.
21. Howard, E.; Cameron, I.; Langford, J.; Small, M.; Jonah, B.; Stipdonk, H.; McMahon, K.; McMurray, R.;
Bliss, A.; Breen, J. Towards Zero: Ambitious Road Safety Targets and the Safe System Approach; Organization for
Economic Co-Operation and Development, International Transportat Forum: Paris, France, 2008.
22. Institute of Transportation Engineers. Speed Zone Guidelines: A Proposed Recommended Practice; Institute of
Transportation Engineers: Washington, DC, USA, 1993.
23. Elvik, R. Optimal speed limits : Limits of optimality models. Transp. Res. Rec. 2003, 1818, 32–38. [CrossRef]
24. Forbes, G.J.; Gardner, T.; McGee, H.; Srinivasan, R. Methods and Practices for Setting Speed Limits:
An Informational Report; Report No. FHWA-SA-12-004; U.S. Department of Transportation, Federal Highway
Administration: Washington, DC, USA, 2011.
25. Tingval, C.; Haworth, C. Vision Zero—An ethical approach to safety and mobility. In Proceedings of the
6th ITE International Conference Road Safety & Traffic Enforcement: Beyond 2000, Melbourne, Australia,
6–7 September 1999.
26. Richter, E.D.; Berman, T.; Friedman, L.; Ben-David, G. Speed, road injury, and public health. Annu. Rev.
Public Health 2006, 27, 125–152. [CrossRef] [PubMed]
27. Sense BC. Safety by Education Not Speed Enforcement. Available online: http://www.sense.bc.ca/
(accessed on 5 August 2014).
28. Stop100.ca. 2014. Available online: http://www.stop100.ca/ (accessed on 5 August 2014).
29. Canadian Council of Motor Transport Administrators. Canadian Motor Vehicle Traffic Collision Statistics (2011);
Canadian Council of Motor Transport Administrators: Ottawa, ON, Canada, 2013.
30. World Health Organization. Global Status Report on Road Safety: Time for Action; World Health Organization:
Geneva, Switzerland, 2009.
31. Richter, E.D.; Friedman, L.S.; Berman, T.; Rivkind, A. Death and injury from motor vehicle crashes: A tale of
two countries. Am. J. Prev. Med. 2005, 29, 440–449. [CrossRef] [PubMed]
32. Lave, C.; Elias, P. Did the 65 mph speed limit save lives? Accid. Anal. Prev. 1994, 26, 49–62. [CrossRef]
33. Lave, C.A. Speeding, Coordination, and the 55 MPH Limit. Am. Econ. Rev. 1985, 75, 1159–1164.
34. Taylor, M.C.; Lynam, D.A.; Baruya, A. The Effects of Drivers’ Speed on the Frequency of Road Accidents;
TRL Report 421; Transport Research Laboratory: Crowthorne, UK, 2000.
35. Garber, N.J.; Gadiraju, R. Factors Affecting Speed Variance and Its Influence on Accidents; Transportation Research
Record No. 1213; Human Performance and Highway Visibility: Design, Safety, and Methods, Transportation
Research Board: Washington, DC, USA, 1989.
36. McCarthy, P. Effect of Speed Limits on Speed Distributions and Highway Safety: A Survey of the Literature.
In Special Report 254: Managing Speed: Review of Current Practice for Setting and Enforcing Speed Limits;
Committee for Guidance on Setting and Enforcing Speed Limits; Transportation Research Board, National
Research Council; National Academy Press: Washington, DC, USA, 1998; pp. 277–390.
37. Freedman, M.; Williams, A.F. Speed associated with 55-mph and 65-mph speed limits in northeastern states.
ITE J. 1992, 17–21.
38. McCarthy, P.S. Highway safety and the 65-mph speed limit. Contemp. Econ. Policy 1991, 9, 82–92. [CrossRef]
39. Brown, D.B.; Maghsoodloo, S.; McArdle, M.E. The safety impact of the 65 mph speed limit: A case study
using Alabama accident records. J. Saf. Res. 1990, 21, 125–139. [CrossRef]
40. Ossiander, E.M.; Cummings, P. Freeway speed limits and traffic fatalities in Washington State.
Accid. Anal. Prev. 2002, 34, 13–18. [CrossRef]Sustainability 2018, 10, 3555 18 of 19
41. Retting, R.A.; Greene, M.A. Traffic speeds following repeal of the National maximum speed limit. Inst. Transp.
Eng. J. 1997, 67, 42–46.
42. Grabowski, D.C.; Morrisey, M.A. Systemwide implications of the repeal of the national maximum speed
limit. Accid. Anal. Prev. 2007, 39, 180–189. [CrossRef] [PubMed]
43. Shaw, R. B.C. Raises Speed Limits on a Number of Provincial Highways; Vancouver Sun; Pacific Newspaper
Group: Vancouver, BC, Canada, 2014.
44. Friedman, L.S.; Barach, P.; Richter, E.D. Raised speed limits, case fatality and road deaths: A six year
follow-up using ARIMA models. Inj. Prev. 2007, 13, 156–161. [CrossRef] [PubMed]
45. Box, G.E.P.; Jenkins, G.M. Time-Series Analysis: Forecasting and Control, 2nd ed.; Holden-Day: San Francisco,
CA, USA, 1976.
46. Brubacher, J.R.; Chan, H.; Brasher, P.; Erdelyi, S.; Desapriya, E.; Asbridge, M.; Purssell, R.; Macdonald, S.;
Schuurman, N.; Pike, I. Reduction in Fatalities, Ambulance Calls, and Hospital Admissions for Road Trauma
After Implementation of New Traffic Laws. Am. J. Public Health 2014, 104, e89–e97. [CrossRef] [PubMed]
47. Hyndman, R.; Athanasopoulos, G.; Bergmeir, C.; Caceres, G.; Chhay, L.; O’Hara-Wild, M.; Petropoulos, F.;
Razbash, S.; Wang, E.; Yasmeen, F. Forecast: Forecasting functions for Time Series and Linear Models.
R Package Version 8.4. 2018. Available online: http://pkg.robjhyndman.com/forecast (accessed on
18 July, 2018).
48. Johnson, P.; Klein, T.M.; Levy, P.; Maxwell, D. The Effectiveness of the 55 mph National Maximum Speed Limit as
a Life Saving Benefit; U.S. Department of Transportation, National Highway Traffic Safety Administration,
Office of State Vehicle Programs: Washington, DC, USA, 1981.
49. McKnight, A.J.; Klein, T.M.; Tippetts, A.S. The Effect of the 65 mph Speed Limit through 1988: A Report to
Congress; US DOT Report No. DOT HS 807 463; United States Department of Transportation: Washington,
DC, USA, 1989.
50. Garber, S.; Grahman, J.D. The effects of the new 65 mile-per-hour speed limit on rural highway fatalities:
A state-by-state analysis. Accid. Anal. Prev. 1990, 22, 137–149. [CrossRef]
51. Baum, H.M.; Wells, J.K.; Lund, A.K. The fatality consequences of the 65 mph speed limits, 1989. J. Saf. Res.
1991, 22, 171–177. [CrossRef]
52. Farmer, C.M.; Retting, R.A.; Lund, A.K. Effect of the 1996 Speed Limit Changes on Motor Vehicle Occupant
Fatalities; Insurance Institute for Highway Safety: Arlington, VA, USA, 1997.
53. Wagenaar, A.C.; Streff, F.M.; Schultz, R.H. Effects of the 65 mph speed limit on injury morbidity and mortality.
Accid. Anal. Prev. 1990, 22, 571–585. [CrossRef]
54. Rock, S.M. Impact of the 65 mph speed limit on accidents, deaths, and injuries in Illinois. Accid. Anal. Prev.
1995, 27, 207–214. [CrossRef]
55. Gallaher, M.M.; Sewell, C.M.; Flint, S.; Herndon, J.L.; Graff, H.; Fenner, J.; Hull, H.F. Effects of the 65-mph
speed limit on rural interstate fatalities in New Mexico. JAMA 1989, 262, 2243–2245. [CrossRef] [PubMed]
56. Bartle, S.T.; Baldwin, S.T.; Johnston, C.; King, W. 70-mph speed limit and motor vehicular fatalities on
interstate highways. Am. J. Emerg. Med. 2003, 21, 429–434. [CrossRef]
57. Vernon, D.D.; Cook, L.J.; Peterson, K.J.; Michael Dean, J. Effect of repeal of the national maximum speed
limit law on occurrence of crashes, injury crashes, and fatal crashes on Utah highways. Accid. Anal. Prev.
2004, 36, 223–229. [CrossRef]
58. Richter, E.D.; Barach, P.; Friedman, L.; Krikler, S.; Israeli, A. Raised speed limits, speed spillover, case-fatality
rates, and road deaths in Israel: A 5-year follow-up. Am. J. Public Health 2004, 94, 568–574. [CrossRef]
[PubMed]
59. Sliogeris, J. 110 Kilometre Per Hour Speed Limit—Evaluation of Road Safety Effects; Report No GR 92-8; VicRoads:
Carlton, Victoria, Australia, 1992.
60. Woolley, J. Recent advantages of lower speed limits in Australia. J. East. Asia Soc. Transp. Stud. 2005,
6, 3562–3573.
61. Helfenstein, U. When did a reduced speed limit show an effect? Exploratory identification of an intervention
time. Accid. Anal. Prev. 1990, 22, 79–87. [CrossRef]
62. Moore, S. Speed Doesn't Kill: The Repeal of the 55 mph Speed Limit; Policy analysis No. 346; The Cato Institute:
Washington, DC, USA, 1999.
63. Jehle, D.V.K.; Connolly, S.; Godzala, M.; Cole, A. Speed kills? Not always: The New York State thruway
experience. J. Trauma-Inj. Infect. Crit. Care 2010, 69, 708–714. [CrossRef] [PubMed]Sustainability 2018, 10, 3555 19 of 19
64. Greenstone, M. A reexamination of resource allocation responses to the 65-mph speed limit. Econ. Inq. 2002,
40, 271–278. [CrossRef]
65. Simons, R.; Brasher, P.; Taulu, T.; Lakha, N.; Molnar, N.; Caron, N.; Schuurman, N.; Evans, D.; Hameed, M.
A population-based analysis of injury-related deaths and access to trauma care in rural-remote Northwest
British Columbia. J. Trauma-Inj. Infect. Crit. Care 2010, 69, 11–19. [CrossRef] [PubMed]
66. Kines, L. Transportation Minister Went His Own Way on Raising Speed Limits. Times Colonist 2014.
67. Haglund, M.; Åberg, L. Speed choice in relation to speed limit and influences from other drivers. Transp. Res.
Part F Traffic Psychol. Behav. 2000, 3, 39–51. [CrossRef]
68. Mannering, F. Effects of insterstate speed limits on driving speeds: Some new evidence. In Proceedings of
the Transportation Research Board 86th Annual Meeting, Washington, DC, USA, 21–25 January 2007.
69. Retting, R.; Cheung, I. Traffic speeds associated with implementation of 80 mph speed limits on West Texas
rural interstates. J. Saf. Res. 2008, 39, 529–534. [CrossRef] [PubMed]
© 2018 by the authors. Licensee MDPI, Basel, Switzerland. This article is an open access
article distributed under the terms and conditions of the Creative Commons Attribution
(CC BY) license (http://creativecommons.org/licenses/by/4.0/).You can also read