Roads Through Rural Communities - TECHBRIEF Traffic Calming on Main
←
→
Page content transcription
If your browser does not render page correctly, please read the page content below

TECHBRIEF Traffic Calming on Main
                             Roads Through Rural
                             Communities
                             FHWA Publication No.: FHWA-HRT-08-067

                             FHWA Contact: Ray Krammes, HRDS-05, (202) 493-3312,
                             ray.krammes@fhwa.dot.gov or Edward Sheldahl, HSSD,
                             (202) 366-2193, edward.sheldahl@dot.gov

                             Introduction
                             Speed management is a significant challenge for most comm-
                             unities in the United States. This is particularly true for small,
                             rural communities where the main roadway through the town
                             serves a dual role. Outside the town, the roadway provides
                             high-speed travel over long distances; within the built-up area,
                             however, the same roadway accommodates local access,
                             pedestrians of all ages, on-street parking, bicycles, and the
                             many other features unique to the character of a community.
                             This convergence of roadway purposes presents both an
                             enforcement challenge for the community and a potential
                             safety problem for the public.

                             Addressing the issue through law enforcement alone often
                             leads to temporary compliance at a significant cost. A more
                             permanent way to reinforce the need to reduce speed is to
                             change the look and feel of the road by installing traffic calm-
                             ing treatments that communicate to drivers that the function
                             of the roadway is changing. Traffic calming has been
                             evaluated and used extensively within low-speed urban areas
                             in the United States but less so in rural areas where driver
                             expectations and traffic characteristics are different.
Research, Development, and
Technology                   Traffic calming is more common in rural communities in Europe
Turner-Fairbank Highway      where multiple measures such as colored pavement, physical
Research Center              lane narrowing, signing, and landscaping are often combined.(1,2)
6300 Georgetown Pike         A gateway treatment intended to evoke lower speed on the
McLean, VA 22101-2296        approach and entrance to the community is usually followed by
                             a series of other measures repeated throughout the community
www.tfhrc.gov                to encourage drivers to maintain appropriate speeds. Speed
                             reductions up to 15 mi/h from rural traffic calming have been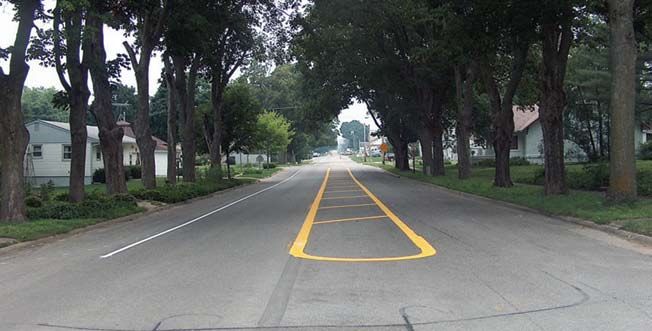
reported in France, Denmark,          and the UK,      calming treatments used in the urban areas of the
    although speed reductions of          5 mi/h were      United States and treatments used specifically
    more typical.(1,3) Total accidents   were reduced      for major roads in small communities (identified
    by 50 percent and injury             accidents by      from European and other literature) was com-
    25 percent or more.(3,4)                               piled. The appropriateness of each treatment for
                                                           use in built-up areas along main rural roads was
    This TechBrief summarizes an evaluation of the
                                                           determined based on the following criteria:
    effects on speed of low-cost, traffic-calming
    treatments on main rural highways passing              •    Low cost.
    through small, rural communities in Iowa. The
                                                           •    Ability to accommodate farm vehicles and
    full report, Appropriate Traffic Calming Tech-
                                                           large trucks.
    niques for Small Iowa Communities (TR-523), is
    available on Iowa State University’s Web site at:      •    Compatibility with the rural setting and
    http://www.ctre.iastate.edu/research/detail.           driver expectations.
    cfm?projectID=-226410767.(5)                           Treatments were selected for each study location
                                                           in cooperation with local agencies.
    Study Methodology
                                                           A request for experimentation was submitted and
    Site Selection                                         approved by the Federal Highway Administration
    Thirty rural communities (with populations less        (FHWA) for three of the treatments that did
    than 5,000) were identified as potential pilot-study   not meet current provisions of the Manual on
    locations through solicitation in a rural comm-        Uniform Traffic Control Devices.(6)
    unity newsletter. Site visits were conducted for
                                                           Seven different low-cost, traffic-calming
    each community; 18 met the initial selection
                                                           treatments were implemented and evaluated in
    criteria, which included the following:
                                                           the five communities as shown in table 1. In some
    •   Through, paved, major county or state              communities, a single traffic calming measure
    highway.                                               was installed, and in others, a combination of
    •    No traffic calming currently in place or          measures was implemented and evaluated. Speed
    planned.                                               limits ranged from 55 mi/h to 60 mi/h outside the
                                                           community and from 25 mi/h to 35 mi/h inside the
    •    No construction, reconstruction, or signifi-
                                                           community where the treatments were applied.
    cant maintenance activities planned along the
    route during the study period.                         Unless otherwise noted, treatments were placed
    •    No access control.                                from July through August 2006. Any treatment
                                                           that included pavement markings was repainted
    •    No adverse geometry such as sharp
                                                           in May 2007, just before the 12-month “after”
    horizontal curves or steep vertical curves where
                                                           data-collection period.
    treatments would be placed.

    Initial speed studies were conducted in the            Data Collection
    18 communities, and 5 were selected as pilot-          Speed and volume data were collected by a
    study locations. These five locations were found       roadside traffic recorder using pneumatic road
    to have the most significant speeding problems,        tubes placed across the road. Data were collected
    as determined by the difference between the            immediately downstream of each treatment or
    posted speed and prevailing travel speed.              in the case of road narrowing near the midpoint
                                                           of the section. For Roland and Union where
    Treatment Selection                                    combinations of treatments were applied, data
    An extensive list of both traditional traffic-         were also collected 0.5 mi upstream of the first

2
Table 1. Summary of treatments by Iowa community.
    City           Treatment                                    Roadway                     AADT        Cross section
    (population)                                                                            (veh/day)   (all are two-lane)

    Union          Transverse pavement markings1 with speed     D-65 (west edge of City)    830         Asphalt (22.4 ft),
    (427)          feedback sign                                                                        unpaved shoulders
                   Transverse pavement markings1 with speed     S-62/SH 215 (from           1,680       Concrete (40.0 ft),
                   feedback sign                                intersection with D-65 to               curb and gutter
                                                                north city limit)
                   Lane narrowing using painted center island
                   and edge line markings
                   Transverse pavement markings1                SH 215 (near south city     1,000       Asphalt (22.4 ft),
                                                                limit)                                  unpaved shoulders
    Roland         Converging chevrons1 with “25 MPH”           E-18 (near east and west    2,300       Asphalt (22.6 ft),
    (1,324)        pavement legend                              city limits)                            unpaved shoulders
                   Lane narrowing using shoulder widening       E-18 (from intersection     2,300       Concrete (36.0 ft),
                   and “25 MPH” pavement legend                 with R-77 to east city                  curb and gutter
                                                                limit)
                   “25 MPH” pavement legend                     E-18 (from intersection     2,300       Asphalt (22.6 ft),
                                                                with R-77 to west city                  unpaved shoulders
                                                                limit)
    Gilbert        Speed table                                  E-23 (center of             1,480       Asphalt (22.0 ft),
    (987)                                                       community)                              shoulders
    Slater         Lane narrowing with center island using      R-38 (from intersection     2,060       Concrete (25.8 ft),
    (1,306)        tubular markers channelizing markers         with SH 210 to south                    curb and gutter
                                                                city limit)
                   Speed feedback sign                          R-38 (near north city       2,870       Asphalt (22.6 ft),
                                                                limit)                                  unpaved shoulders
                   “SLOW” pavement legend                       SH 210 (west from           2,940       Asphalt (22.5 ft),
                                                                intersection with R-38 to               unpaved shoulders
                                                                west city limit)
    Dexter         “35 MPH” pavement legend with red            F-65 (near east and west    1,000       Asphalt (25.4 ft),
    (689)          background1                                  city limits as well as at               unpaved shoulders
                                                                curve before west city
                                                                limit)
1
    A request for experimentation was submitted to and approved by FHWA for this treatment.

treatment in order to determine whether speed                   Most of the communities do not have any police
changes observed were due to the treatments                     officers and have no regular traffic enforce-
or to normal variation in speeds.                               ment, instead relying mostly on county sheriffs
                                                                who drive through the community occasionally.
Results in this TechBrief are presented only for
                                                                Each community was asked to not change
vehicles in the direction of travel that actually
                                                                or request additional enforcement during
passed through the treatment. An in-depth
                                                                the study period and to report any unusual
discussion on data collected at other locations
                                                                speed enforcement or any other unusual
is presented in the full report.
                                                                activities. When additional enforcement or
After final locations were selected, a formal                   any unusual situation coincided with data
“before” speed study was conducted to est-                      collection, the data were discarded and
ablish baseline speeds and volumes. Speeds                      recollected the following week. For instance,
of all vehicles were collected continuously                     one community decorated the area around the
for at least 48 hours during each deployment.                   roadway for Flag Day, and in one community
Data collection was planned at 1-, 3-, 6-, 9-                   roadway maintenance occurred during a data-
and 12-month intervals after installation of the                collection period. In both cases, data were
traffic-calming treatments. In several cases,                   discarded and recollected. Data were only
data were not collected for a particular “after”                collected during nonholiday weekdays.
period, mainly due to adverse winter conditions.

                                                                                                                              3
Measure of Effectiveness                                Transverse Markings With and Without Speed
                                                            Feedback Signs
    Vehicular speed was the primary measure used
    to evaluate the effectiveness of each treatment.        Description
    This report presents changes observed in the            The transverse markings consisted of a series of
    85th percentile speed of all vehicles. The 85th         parallel bars on the inside edges of the travel lane.
    percentile speed is the speed at or below which         The spacing between bars decreased approach-
    85 percent of the vehicles are traveling. Each data     ing the community. The series of markings are
    set had at least 630 vehicle speed samples. In          intended to create the perception that the vehicle’s
    almost all cases, differences were statistically        speed is increasing to trigger driver awareness of
    significant at the 95-percent confidence level.         the need to slow down. The transverse markings
    The effects on mean speed and the percent of            were 12 inches wide (parallel to roadway edge)
    vehicles exceeding the speed limit by various           by 18 inches long (figure 1). The markings were
    amounts, along with statistical significance, are       installed at the north, south, and west entrances
    presented in the full report but not within this        to the city of Union. Markings were placed in
    TechBrief. In most cases, only minor reductions         advance of and terminated at the speed limit
    in mean speed resulted. The changes in the              sign which established the speed within the
    percentage of vehicles exceeding the speed limit        community.The length of each series and distance
    by various amount correlated with the changes           between bars varied based upon each speed
    in 85th percentile speeds. Overall, the treatments      transition and location within the series.
    appeared to have a greater effect on drivers            Speed feedback signs (figure 2) were also installed
    traveling at higher speeds.                             within Union. These signs consisted of a static
                                                            “Your Speed” sign and an electronic display of
    Results                                                 the approaching vehicle speed measured by
    The effectiveness of each traffic-calming               radar. These signs were installed for inbound
    treatment is discussed in the following sections.       motorists at the north and west city entrances
    A brief description and photograph of each              and were placed immediately downstream of
    treatment is provided, along with a summary of          the transverse markings as shown in figure 3.
    the effects on speed.                                   Due to purchasing and installation problems,

     Figure 1. Experimental transverse markings at entrance to Union.

4
Figure 2. Speed feedback sign in Union.                       speed by location and observation period. For the
                                                              south entrance (U5) where transverse markings
                                                              were the only treatment installed, there was
                                                              little change in prevailing speed. Similar results
                                                              were found for southbound traffic entering the
                                                              north side of town (U2) and eastbound traffic
                                                              entering from the west (U1) prior to the installa-
                                                              tion of speed feedback signs.

                                                              After the feedback signs were installed, speeds
                                                              dropped an additional 3 mi/h to 6 mi/h at the
                                                              north and west entrances during the 9- and
                                                              12-month analysis periods. Since the signs were
                                                              only in place for a short period of time, it is
                                                              not known if the observed speed reductions
                                                              persisted over the longer term.

                                                              Lane Narrowing Using Painted Center Island
the signs did not become operational until just               and Edgeline Markings
before the 9-month data collection period.
                                                              Description
Results                                                       Median and shoulder pavement markings
Table 2 shows the change in 85th percentile                   shown in figure 4 were used to reduce lane

 Figure 3. Treatment and data collection locations in Union.

                   Transverse Pavement Markings
                                                                                                Union, IA
                                                                        S-62 / SH 215

                                                                                        North

                                YOUR SPEED
                     Speed
                     Feedback
                     Sign
                                  47                                                              U2

                                  Lane Narrowing
                                  (center island                                                  U3
                                  widening)
                      D-65
                                                                                                   D-65
                                                              All
                                                              Way

                                                                                                  U4
                                                        S-62 / SH 215

                         YOUR SPEED

                             47                                                                   U5

                                      U1

                                                                                                                   5
Table 2. Speeds before and after transverse pavement markings with and without speed feedback sign (SFS)
    at the entrances to Union.
    Location and analysis period   Sample size   Posted speed        85th percentile   Change in 85th percentile speed
                                         (veh)          (mi/h)               (mi/h)        from “before” period (mi/h)
    U2 SB Before                         1,870             30                    41
    1-month                              1,785             30                    41                                       0
    3-month                              1,794             30                    40                                  -1
    9-month (+SFS)                       1,737             30                    35              -6
    12-month (+SFS)                      1,693             30                    34         -7
    U5 NB Before                          886              25                    46
    1-month                               783              25                    45                                  -1
    3-month                               943              25                    45                                  -1
    9-month                               908              25                    44                             -2
    12-month                              871              25                    45                                  -1
    U1 EB Before                          893              25                    53
    1-month                               659              25                    51                             -2
    3-month                               684              25                    52                                  -1
    9-month (+SFS)                        749              25                    49                   -4
    12-month (+SFS)                       666              25                    50                        -3

    widths for a section of S-62/SH 215 within                   travel lane from an 8 ft parking lane. Drivers
    Union. The existing two-lane roadway was                     were expected to slow down due to feeling
    40 ft wide from curb to curb with parallel                   constrained by narrower lanes.
    parking allowed on one side. A 10-ft-wide
    painted center island was used to reduce                     Results
    the existing lane widths from roughly 16                     Table 3 summarizes speed data collected mid-
    to 11 ft in each direction. A solid 6-inch                   way through the narrowed section (U3), as
    channelizing line was painted to separate the                shown in figure 3. Results are presented for both

    Figure 4. Painted center island and edgeline used to narrow lane.

6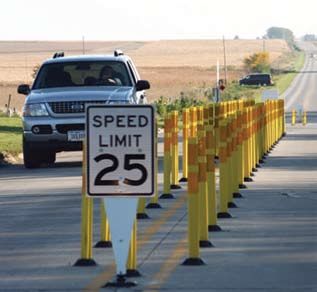
directions of traffic, as both were exposed to                began 221 ft in advance of and terminated at
the lane narrowing. No other traffic-calming                  the speed limit sign which established the
measures were in place at this location.                      speed within the community. The distance be-
                                                              tween chevrons gradually decreased from
No consistent changes in 85th percentile speed
                                                              25 ft to 18 ft, and the width of the markings
were observed for either direction. In some
                                                              decreased from 36 inches to 6 inches in the
cases, vehicle speeds decreased; in other cases,
                                                              direction of travel, giving the perception of
vehicle speeds increased. The variability in
                                                              increasing speed. The pavement marking
speeds suggests that the treatment was not
                                                              legend “25 MPH” was installed at the end of
effective and that other factors may have
                                                              each chevron series to reinforce the
influenced speeds. Speed data collected at a
                                                              posted speed.
point upstream of the north section where
vehicles were not influenced by any of the
                                                              Results
traffic-calming treatments exhibited an overall
                                                              As shown in table 4, the 85th percentile speed
upward speed trend. This suggests the observed
                                                              decreased up to 4 mi/h, while 1 mi/h was more
increases in speed were due in part to general
                                                              typical for the various analysis periods. Although
time trends.
                                                              the chevron markings were somewhat effective in
Even though the roadway was reduced from                      reducing vehicle speeds, prevailing speeds were
16 ft to 11 ft lanes in each direction, the lanes may         still 7 mi/h to 9 mi/h above the posted speed
have still been too wide to affect driver behavior.           limit 12 months after implementation.
A more drastic reduction in lane width (e.g., 9 ft
lanes) or a physical barrier (e.g., raised curb) may          Figure 5. Experimental converging chevron
                                                              markings followed by “25 MPH” pavement legend.
be necessary to produce the desired effect since
there are no consequences for driving over the
pavement markings.

Converging Chevrons with “25 MPH”
Pavement Marking Legend

Description
A series of converging chevron markings shown
in figure 5 were installed on County Road E-18
on both entrances to Roland. The markings

 Table 3. Speeds before and after narrowing lane using painted center island and edge line markings.
 Location and analysis period   Sample size   Posted speed        85th percentile   Change in 85th percentile speed
                                      (veh)          (mi/h)               (mi/h)        from “before” period (mi/h)
U3 NB Before                          2,055             30                    35
1-month                               1,808             30                    36                     +1
3-month                               1,840             30                    32    -3
9-month                               1,807             30                    36                     +1
12-month                              2,064             30                    35                 0
U3 SB Before                          2,058             30                    33
1-month                               1,930             30                    33                 0
3-month                               1,911             30                    37                               +4
9-month                               1,881             30                    32          -1
12-month                              1,771             30                    34                     +1

                                                                                                                      7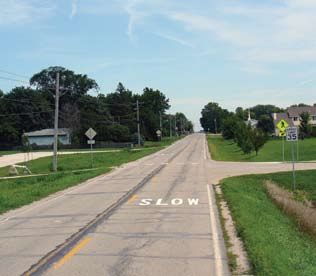
Table 4. Speeds before and after installing converging chevron markings and “25 MPH” pavement legend.
     Location           Analysis   Sample size   Posted speed       85th percentile   Change in 85th percentile speed
                         period          (veh)          (mi/h)              (mi/h)        from “before” period (mi/h)
    West entrance         Before         4,216              25                  35
                        1-month          4,135              25                  34                                  -1
                        3-month          3,812              25                  32                        -3
                        9-month          3,958              25                  35                                       0
                       12-month          3,945              25                  34                                  -1
    East entrance         Before         2,397              25                  36
                        1-month          2,426              25                  35                                  -1
                        3-month          3,413              25                  35                                  -1
                        9-month          2,196              25                  34                             -2
                       12-month          1,778              25                  32                   -4

    Lane Narrowing Using Shoulder Widening                       slower due to feeling constrained. White pave-
    with “25 MPH” Legend                                         ment marking legends indicating “25 MPH”
                                                                 were placed at regularly spaced intervals
    Description                                                  within the narrowed section to remind drivers
    A wide edgeline and cross-hatch markings, as                 of the speed limit.
    illustrated in figure 6, were used to create a shoul-
    der on both sides of the roadway and reduce lane             Results
    widths for a section of E-18 within Roland. The              Data were collected at the midpoint of the
    existing two-lane roadway was 36 ft wide from                narrowed section. As shown in table 5,
    curb to curb. The painted shoulders reduced the              the lane narrowing and speed limit markings
    lane width to 10.5 ft in both directions. The                were not effective in reducing vehicle speeds.
    narrow lane was intended to make drivers travel              There were no consistent changes in the 85th

     Figure 6. Shoulder markings used to narrow travel lanes in Roland.

8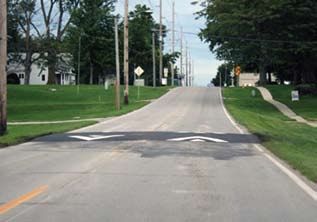
percentile speed by analysis period or direction            speeds were reduced at the hump location by
of travel with both increases and decreases                 4 mi/h to 5 mi/h over all “after” periods to within
recorded. In most analysis periods, there was               a few miles per hour of the 25 mi/h posted
no change in traffic speed compared to speeds               speed limit. Approximately 200 ft downstream
measured before the lane narrowing. No data                 of the speed table, speeds were still 4 mi/h
were collected 6 months after the change due
to adverse winter weather.                                  Figure 7. Aerial view of speed table in Gilbert.

Even though the eastern section of E-18 was
reduced from a 36 ft cross-section to 10 ft lanes,
the lanes may have still been too wide to affect
driver behavior. A more drastic reduction in
lane width (e.g., 9 ft lanes) or a physical barrier
(e.g., raised curb) may be necessary to produce
the desired effect since there are no con-
sequences for driving on pavement markings.

Speed Table

Description
A speed table (figures 7 and 8) was installed on
County Road E-23 within the center of Gilbert.              Figure 8. Driver view of speed table in Gilbert.
The two-lane asphalt roadway has grass shoul-
ders, no curb, and a 25 mi/h posted speed limit.
The speed table was 3 inches high and 22 ft in
the direction of travel, including 6 ft ramps
at both ends. The asphalt speed table was
designed to be traversed at 30 mi/h to acc-
ommodate heavy trucks and farm vehicles.

Results
The speed table was very effective in reducing
speeds. As shown in table 6, 85th percentile

Table 5. Speeds before and after lane narrowing using shoulder markings combined with “25 MPH”
pavement legend.
Direction of       Analysis   Sample size   Posted speed        85th percentile    Change in 85th percentile speed
traffic             period          (veh)          (mi/h)               (mi/h)         from “before” period (mi/h)
Outbound             Before         2,884             25                    34
                   1-month          2,708             25                    34                   0
                   3-month          2,324             25                    34                   0
                   9-month          2,489             25                    33             -1
                  12-month          2,727             25                    34                   0
Inbound              Before         2,864             25                    31
                   1-month          2,681             25                    29        -2
                   3-month          2,361             25                    31                   0
                   9-month          2,562             25                    31                   0
                  12-month          2,835             25                    32                       +1

                                                                                                                     9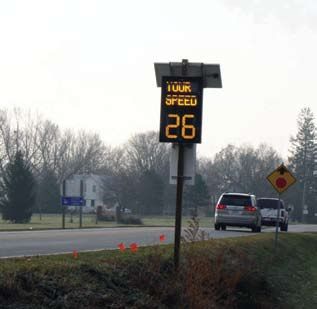
Table 6. Speeds before and after installing speed table.
     Location           Analysis   Sample size    Posted speed       85th percentile    Change in 85th percentile speed
                         period          (veh)           (mi/h)              (mi/h)         from “before” period (mi/h)
     200 ft               Before         2,257              25                   34
     downstream
                        1-month          2,199              25                   30                      -4
                        3-month          2,763              25                   30                      -4
                        9-month          3,885              25                   30                      -4
                       12-month          3,886              25                   30                      -4
     15 ft                Before         3,685              25                   32
     downstream
                        1-month          3,355              25                   27                 -5
                        3-month          3,413              25                   28                      -4
                        9-month          3,982              25                   27                 -5
                       12-month          3,279              25                   27                 -5

     lower than baseline speeds and within 5 mi/h of              between the two center islands. The data
     the posted speed.                                            indicate the islands using tubular channelizing
                                                                  markers reduced vehicle speeds; 85th percentile
     Lane Narrowing with Center Island Using                      speeds decreased by up to 3 mi/h when the
     Tubular Markers                                              tubular markers were in place and increased up
                                                                  to 4 mi/h when the tubular markers were
     Description
                                                                  removed. Similar speed changes were also
     Tubular markers shown in figure 9 were used                  observed for inbound traffic just downstream of
     to create two center islands along the southern              the second island. Even with the speed drop,
     section of R-39 in Slater. At this location, the             85th percentile speeds were still 10 mi/h to
     roadway is 26 ft wide from curb to curb. Center              15 mi/h above the posted speed limit.
     islands were formed by placing two rows of
     36-inch-tall yellow tubular channelizing markers             Speed Feedback Signs
     to reduce lane widths to 11 ft in each direction.
     The tubular markers were spaced 4 ft apart in                Description
     the taper and 8 ft elsewhere. A 25 mi/h speed                A speed feedback sign pictured in figure 10 was
     limit sign was placed on a mountable sign supp-
                                                                  Figure 9. Tubular channelizing markers used for
     ort at both ends of each island. The first island            center island to narrow lanes.
     was located at the southern entrance to Slater,
     just after the first posted 25 mi/h speed limit
     sign. The second island was located approxi-
     mately one block north of the first island.

     Although the treatment was designed to accom-
     modate agricultural equipment and mainte-
     nance vehicles such as snowplows, the mark-
     ers were damaged during winter operations and
     were removed for 6 weeks. The markers were
     reinstalled as soon as no more snow events
     were expected.

     Results
     Table 7 shows the speed data collected midway

10
Table 7. Speeds before and after lane narrowing using center islands with tubular markers for traffic entering
(NB) and leaving (SB) Slater.
Dir Analysis period Sample Posted speed 85th percentile Change in 85th percentile speed
size (veh) (mi/h) (mi/h) from “before” period (mi/h)
NB Before 2,669 25 40
1-month 2,453 25 38 -2
6-month 2,234 25 39 -1
9-month/markers removed 1,808 25 44 +4
9-month/markers replaced 1,549 25 37 -3
12-month 2,207 25 40 0
SB Before 2,806 25 45
1-month 2,657 25 42 -3
6-month 2,387 25 42 -3
9-month/markers removed 1,665 25 45 0
9-month/markers replaced 1,402 25 42 -3
12-month 2,172 25 43 -2
installed on County Road R-38 for inbound traf- stream of the sign decreased from 37 mi/h to
fic at the north entrance to Slater. This section 30 mi/h 3 months after the sign was operational.
of R-38 is adjacent to an elementary school, has It is not known if the 7 mi/h speed reduction can
a 25 mi/h posted speed limit, and has a rural be sustained over time.
cross-section with steep shoulders and open ditch
drainage. “SLOW” Pavement Legend
Description
The sign display varied based upon vehicle
speeds measured via radar. The sign remained Pavement marking legends indicating “SLOW”
blank (black) when no traffic was present or when (as shown in figure 11) were used at two locations
the approaching vehicle speed was less than along the western section of SH 210 in Slater. The
or equal to 25 mi/h (or greater than 75 mi/h). first pavement legend was placed just inside the
Between 26 mi/h and 29 mi/h, the sign displayed
Figure 10. Speed feedback sign in Slater.
the text “Your Speed” along with the measure
vehicle speed, as shown in figure 10. For
vehicles approaching between 30 mi/h and
75 mi/h, the message “Slow Down 25” was
displayed. No other traffic-calming treatments
were in place at this location.
Due to sign purchasing and installation problems,
the speed feedback sign was not installed at the
same time as the other traffic-calming treatments
in the study. Once the sign was in place, it
experienced numerous electrical failures, and the
analysis was limited to only one “after” period.
Results
The speed feedback sign, when operational,
was very effective. Speeds measured just down-
11Figure 11. “SLOW” pavement legend in Slater. Entrance Treatment Using “35 MPH” Legend
with Red Background
Description
Speed limit markings (figure 12) modeled after
European entrance treatments using colored
pavement were used at the east and west
community entrances to Dexter. The treat-
ment was also placed west of the community
on a curve just before a steel fabrication plant,
as requested by the community. Community
members were concerned about the combina-
tion of large trucks backing out of the plant
and high-speed vehicles approaching the plant
after negotiating a horizontal curve. A large
red rectangle (9.5 ft by 12 ft) was used to
frame the on-pavement “35 MPH” speed limit
western community entrance. At this location, markings. An 8 inch edgeline was also painted
there was a park and a crosswalk that children along the treatments to enhance visibility.
used to cross to and from school and the park.
The second was placed about 1,500 ft down- Results
stream of the first location. As shown in table 9, the treatment was very
effective in reducing the speed of traffic entering
Results
the community. Speeds downstream of the
The “SLOW” markings were not effective in curve on the western edge of Dexter and
reducing speeds. As shown in table 8, the 85th at the western entrance decreased from
percentile speed actually increased for traffic 4 mi/h to 9 mi/h during most analysis periods.
entering Slater just downstream of the first The speed reductions at the eastern entrance
pavement legend. There was little or no to Dexter were not as dramatic. This may be
reduction in vehicle speed just downstream of due in part to the prevailing speed in the base-
the second “SLOW” marking. Data were not line period at the east entrance, which was
collected for the 12-month data collection already lower than the west entrance to the
interval because the road was resurfaced after community.
the 9-month data collection period.
Table 8. Speeds before and after installing “SLOW” pavement legend.
Location Analysis period Sample Posted speed 85th percentile Change in 85th percentile speed
size (veh) (mi/h) (mi/h) from “before” period (mi/h)
First Before 2,812 25 41
legend
1-month 2,888 25 44 +3
6-month 2,901 25 42 +1
9-month 2,570 25 42 +1
Second Before 3,503 25 34
legend
1-month 3,294 25 34 0
6-month 2,886 25 32 -2
9-month 3,084 25 33 -1
12Summary of Effectiveness to implement. For example, farm vehicles and
Table 10 summarizes speed impact, cost, and heavy truck traffic are common in many rural
maintenance requirements for the various communities and must be accommodated.
traffic-calming treatments evaluated in this study. • Maintenance can be an issue with many
The effectiveness of the treatments in reducing traffic-calming treatments. For example, the
speeds varied widely. tubular channelizing markers used in this
The most effective treatments were the speed study to create a center island were effective
feedback signs, speed table, median island using in reducing speeds, but the tubular markers
tubular markers, and speed limit markings with were frequently struck by vehicles and
red background. The converging chevrons and required frequent maintenance. The speed
transverse pavement markings were somewhat feedback signs provide a different example in
effective with speed reductions generally less that, to be effective, agencies must establish
than 3 mi/h. Lane narrowing using pavement the capability to troubleshoot and maintain
markings to create a center island, lane narrow- these signs within a reasonable response time.
ing using shoulder markings in combination
with on-pavement speed limit markings, and • Cost effectiveness is always a factor in
on-pavement “SLOW” markings were either not selecting traffic-calming treatments. While
effective or were only marginally effective. speed feedback signs were effective in all
situations, their higher cost make them most
Lessons Learned appropriate for areas where it is critical that
The following lessons were learned during the drivers slow down, such as near schools,
course of the study and may be helpful to small playgrounds, or community pools.
communities considering traffic calming on main
• Durable pavement marking materials
rural roads:
(such as thermoplastic, tape, epoxy, or other
• Design vehicles should be considered when paint alternatives) should be considered when
determining the type of traffic-calming treatment the markings extend within wheel paths.
Figure 12. Speed limit markings with experimental red background in Dexter.
13Table 9. Speeds before and after “35 MPH” pavement legend with red background markings.
Location Analysis period Sample Posted speed 85th percentile Change in 85th percentile speed
size (veh) (mi/h) (mi/h) from “before” period (mi/h)
Before Before 2,190 35 52
curve
1-month 2,150 35 47 -5
3-month 2,022 35 47 -5
9-month 4,033 35 43 -9
12-month 2,031 35 51 -1
West Before 2,369 35 45
entrance
1-month 2,256 35 40 -5
3-month 2,119 35 41 -4
9-month 4,027 35 37 -8
12-month 3,168 35 41 -4
East Before 4,254 35 40
entrance
1-month 3,998 35 38 -2
3-month 2,900 35 39 -1
9-month 4,087 35 40 0
12-month 4,031 35 39 -1
Standard paint products wear quickly and calming. These and other implementation
without frequent reapplication can reduce issues are noted as follows:
the effectiveness of the message.
• Small communities often do not have
• Community buy-in is important. In a traffic engineer and appear to be addressing
several cases, although community leadership perceived speeding problems by lowering the
was on-board, the community was opposed speed limit, believing wrongly that this will
to the treatment, even when it was proven to change driver behavior. While lower travel
be effective. speeds may be desirable, reducing the speed
limit is not likely to have much effect.
• Lane narrowing using just pavement
markings to create a center island or shoulder • Speed limits which are not consistent with
was not effective. The lane narrowing treatment the area characteristics and roadway function
that used tubular markers to create a center lead to disregard for posted speeds and create
island was more effective, suggesting that lane animosity toward law enforcement. The recently
narrowing is most likely to be effective when released USLIMITS Web-based speed zone
drivers are presented with a physical object that advisor could be a useful tool in setting appropri-
causes deflection. ate speed limits in rural communities.(7)
• Small communities may not be • Speed limits in the transition zone between
familiar with traffic calming and may need the rural and built-up area in small communities
additional education. were often improperly set, extending well
passed the edge of the community into rural
Other Considerations agricultural areas where there was no reason
for reduced speeds. In other cases, the speed
In visiting a large number of small communities
reductions were abrupt without appropriate
to select pilot study locations, the research team
speed reduction warning signs.
observed a number of practices that could affect
the successful outcome of main road traffic • The maximum speed reduction observed
14Table 10. Summary of impacts and costs of rural traffic calming treatments.
Treatment Change in 85th percentile speed Cost Maintenance Application
(mi/h)
Transverse pavement -2 to 0 $ Regular painting community
markings1 entrance
Transverse pavement -7 to -3 $$$ Regular painting community
markings1 with speed entrance
feedback signs
Lane narrowing using -3 to +4 $ Regular painting entrance or within
painted center island community
and edge marking
Converging chevrons1 -4 to 0 $ Regular painting community
and “25 MPH” entrance
pavement markings
Lane narrowing using -2 to 4 $ Regular painting entrance or within
shoulder markings and community
“25 MPH” pavement
legend
Speed table -5 to -4 $$ Regular painting within community
Lane narrowing with -3 to 0 $$$ Tubes often struck within community
center island using needing replacement
tubular markers
Speed feedback sign -7 $$$ Troubleshooting entrance or within
(3-months after only) electronics community
“SLOW” pavement -2 to 3 $ Regular painting entrance or within
legend community
“35 MPH” pavement -9 to 0 $ Background faded entrance or within
legend with red quickly; accelerated community
background1 repainting cycle
$ = under $2,500
$$ = $2,500 to $5,000
$$$ = $5,000 to $12,000
1
Experimental approval required per Section 1A.10 of MUTCD.
in this study was 9 mi/h. Physical measures such providers should be consulted before installing
as roundabouts and curbed center islands may speed tables.
be needed to achieve the speed environment
• STOP signs should not be used for
that rural communities often desire.
traffic calming.
• Large areas of pavement markings, such
• The chevron markings, transverse mark-
as the speed limit markings with colored back-
ings, and red background for pavement legend
ground, may become slippery when wet.
evaluated in this study are not standard devices
Communities planning to use such treatments
and require experimental approval in accordance
should ensure adequate skid resistance is pro-
with section 1A.10 of the MUTCD.
vided. High friction surface material should be
considered.
References
• Speed tables are only appropriate when 1. Department for Transport. Traffic Calming on
the posted speed limit is 30 mi/h or less and Major Roads, Traffic Advisory Leaflet 01/00,
approach speeds are less than 40 mi/h. Speed London, 2005.
tables are not recommended for use on routes
with significant (more than 5 percent) truck 2. National Roads Authority. Guidelines forTraffic
and bus traffic. Because emergency response Calming for Towns and Villages on National
times may increase, emergency service Routes, Dublin, February 2005.
153. Clarke, A. and Dornfield, M.J. Traffic Evaluation of Gateway and Low-Cost Traffic
Calming, Auto-Restricted Zones and Calming Treatments for Major Routes in
Other Traffic Management Techniques, Small Communities, Center for Transportation
Publication No. FHWA-PD-93-029, Federal Research and Education at Iowa State
Highway Administration, Washington, DC, University, October 2007. (http://www.ctre.
January 1994. iastate.edu/research/detail.cfm?projectID=
-226410767)
4. Department for Transport. Village Traffic
Calming—Accident Reductions, Traffic 6. Manual on Uniform Traffic Control Devices
Advisory Leaflet 11/00, London, 2005. for Streets and Highways (2003 Ed), Federal
Highway Administration, November 2004.
5. Hallmark, S., Petersen, E., Fitzsimmons,
E., Hawkins, N., Resler, J., and Welch, T. 7. USLIMITS, (www2.uslimits.org).
Researchers—This study was performed by Center for Transportation Research and Education at Iowa
State University under Cooperative Agreement Number DTFH61-06-H-00003 with the Iowa Department
of Transportation. Tom Welch was the Project Director. Shauna Hallmark and Neal Hawkins were the
Principal Investigators. For more information about this research, contact Ray Krammes, FHWA Project
Manager, HRDS, (202) 493-3312, ray.krammes@fhwa.dot.gov or Edward Sheldahl, HSSD, (202) 366-
2193, edward.sheldahl@dot.gov.
Distribution—This TechBrief is being distributed according to a standard distribution. Direct distribu-
tion is being made to the Divisions and Resource Center.
Availability—The TechBrief may be obtained from the FHWA Product Distribution Center by e-mail
to report.center@fhwa.dot.gov, fax to (301) 577-1421, phone to (301) 577-0818, or online at http://
www.tfhrc.gov/safety. The full report is available online at: http://www.ctre.iastate.edu/research/detail.
cfm?projectID=-226410767.
Key Words—Traffic calming, speed management, transverse markings, chevron markings, speed feed-
back signs, lane narrowing, tubular channelizing markers, pavement legend, rural roads.
Notice—This document is disseminated under the sponsorship of the U.S. Department of
Transportation in the interest of information exchange. The U.S. Government assumes no liability for
the use of the information contained in this document. The U.S. Government does not endorse prod-
ucts or manufacturers. Trademarks or manufacturers’ names appear in this report only because they
are considered essential to the objective of the document.
Quality Assurance Statement—The Federal Highway Administration (FHWA) provides high-quality
information to serve the Government, industry, and public in a manner that promotes public under-
standing. Standards and policies are used to ensure and maximize the quality, objectivity, utility, and
integrity of its information. FHWA periodically reviews quality issues and adjusts its programs and
processes to ensure continuous quality improvement.
February 2009 FHWA-HRT-08-067
HRDS-05/2-09(5M)E
16You can also read