SAN FRANCISCO HOUSING INVENTORY 2017
←
→
Page content transcription
If your browser does not render page correctly, please read the page content below

2017
SAN FRANCISCO
HOUSING INVENTORY
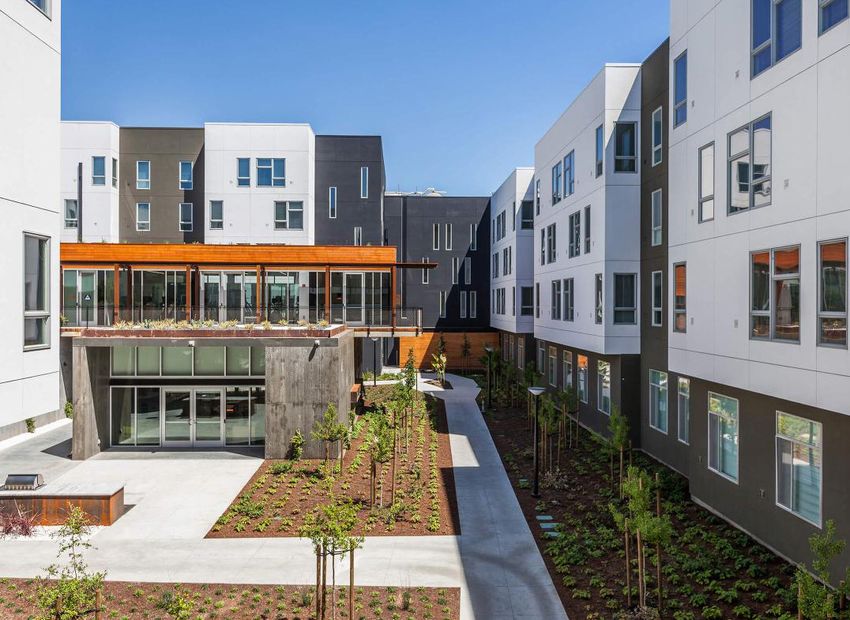
© 2018 San Francisco Planning Department
1650 Mission Street, Suite 400
San Francisco, CA 94103-3114               Front Cover: 588 Mission Bay Boulevard North (Five 88), 198 Affordable Housing Units;
www.sfplanning.org                         Photo Source:https://www.five88sf.com/
2017
SAN FRANCISCO
HOUSING INVENTORY

           San Francisco Planning Department
                                  April 2018
TABLE OF CONTENTS
Introduction 01
Highlights 05
Findings 15
Housing Stock 15
Housing Production Trends 16
New Housing Construction 16
Projects Approved and Under Review by Planning 18
Units Authorized for Construction 19
Demolitions 19
Alterations and Conversions 19
Accessory Dwelling Units 21
New Housing Unit Trends 22
Types of Buildings 22
New Housing Units Added by Zoning District 22
Condominiums 25
New Condominium Construction 25
Condominium Conversions 26
Residential Hotels 27
Affordable Housing 28
Standards and Definitions of Affordability 28
New Affordable Housing Construction 31
Inclusionary Housing 33
Affordability of Market Rate Housing 34
Affordable Housing Acquisition and Rehabilitation 35
Changes in Housing Stock by Planning District 36
Housing Stock by Planning District 38
Housing Construction in the Bay Area 41
Appendices 43
Appendix A: Project Lists 44
Appendix B: Community Plan Area Annual Monitoring 69
Appendix C: San Francisco Zoning Districts 75
Appendix D: In-Lieu Housing Fees Collected 77
Appendix E: Glossary 78
iTables
Table 1. San Francisco Housing Stock by Building Type, 2011-2017 15
Table 2. San Francisco Housing Trends, 1998-2017 17
Table 3. Projects and Units Filed at Planning Department for Review, 2013-2017 18
Table 4. Units and Projects Authorized for Construction by DBI by Building Type, 2013-2017 18
Table 5. Units Demolished by Building Type, 2013-2017 20
Table 6. Units Demolished by Zoning District, 2017 20
Table 7. Units Added or Lost Through Alteration Permits, 2013-2017 20
Table 8. Units Lost Through Alterations and Demolitions, 2013-2017 21
Table 9. Accessory Dwelling Units Added and Legalized, 2017 21
Table 10. Accessory Dwelling Units Added and Legalized by Building Type, 2017 22
Table 11. Housing Units Added by Building Type, 2013-2017 23
Table 12. Housing Units Added by Generalized Zoning, 2017 23
Table 13. Housing Units Added by Zoning District, 2017 24
Table 14. New Condominiums Recorded by DPW, 2008-2017 25
Table 15. New Condominiums Recorded by DPW by Building Type, 2013-2017 25
Table 16. Condominium Conversions Recorded by DPW, 2008-2017 26
Table 17. Condominium Conversions Recorded by DPW by Building Type, 2013-2017 26
Table 18. Changes in Residential Hotel Stock, 2013-2017 27
Table 19. 2017 Rental Affordable Housing Guidelines 29
Table 20. 2017 Homeownership Affordable Housing Guidelines 30
Table 21. New Affordable Housing Construction by Income Level, 2013-2017 32
Table 22. New Affordable Construction by Housing Type, 2013-2017 32
Table 23. New Inclusionary Units, 2013-2017 33
Table 24. Housing Price Trends, San Francisco Bay Area, 2013-2017 34
Table 25. Units Acquired or Rehabilitated, 2013-2017 35
Table 25A. Details of Units Acquired or Rehabilitated, 2017 35
Table 25B. Rental Assistance Demonstration Program, 2017 35
Table 26. Housing Units Completed and Demolished by Planning District, 2017 37
Table 27. San Francisco Housing Stock by Planning District, 2013-2017 39
Table 28. Units Authorized for Construction for San Francisco and the Bay Area Counties, 2017 42
Table A-1. Major Market Rate Housing Projects Completed, 2017 45
Table A-2. Major Affordable Housing Projects Completed, 2017 47
Table A-3. Major Housing Projects Reviewed and Entitled by Planning Department, 2017 49
Table A-4. Major Housing Projects Filed at Planning Department, 2017 56
Table A-5. Major Projects Authorized for Construction by DBI, 2017 60
Table A-6. Major Affordable Projects in the Pipeline as of December 31, 2017 62
Table A-7. Housing Trends by Neighborhood, 2017 66
Table B-1. Housing Trends by Planning Area, 2017 68
Table B-2. Units Entitled by Planning Area, 2017 69
Table B-3. Housing Units Added by Building Type and Planning Area, 2017 70
Table B-4. Units Demolished by Building Type and Planning Area, 2017 71
Table B-5. Units Lost Through Alterations and Demolitions by Planning Area, 2017 71
Table B-6. New Affordable Housing Constructed in Planning Areas, 2017 72
ii SAN FRANCI SCO PL AN N IN G DE PAR T M E N TTable C. San Francisco Zoning Districts 74
Table D. In-Lieu Housing Fees Collected, Fiscal Years 2008-2017 76
Figures
Figure 1. Housing Production Process 2
Figure 2. San Francisco Housing Stock by Building Type, 2017 15
Figure 3. Units Completed & Demolished by Planning District, 2017 37
Figure 4. San Francisco Housing Stock by Planning District, 2017 38
Figure 5. Bay Area Housing Construction Trends, 2008-2017 42
Maps
Map 1. San Francisco Planning Districts 36
iiiINTRODUCTION:
ABOUT THE 2017
HOUSING INVENTORY
iv SAN FRANCI SCO PL AN N IN G DE PAR T M E N TS a n Fr a n ci s co H ou s i n g I n vento ry | 2017
The Housing Inventory is the Planning Depart- five-year monitoring reports that detail housing
ment’s annual survey of housing production trends production trends.
in San Francisco. The report details changes
in the City’s housing stock, including housing This report was prepared from information
construction, demolition, and alterations, and received from a number of different sources
has been published regularly since 1967. This including the Department of Building Inspection,
report is 48th in the series and presents housing the Department of Public Works, and Planning
production activity completed or authorized during Department records. The Mayor’s Office of Hous-
the year 2017. ing and the Office of Community Investment and
Infrastructure (Successor Agency to the San Fran-
By monitoring changes in San Francisco’s housing cisco Redevelopment Agency) provided informa-
stock, the Housing Inventory provides a basis for tion on affordable housing projects. The California
evaluating the housing production goals and poli- Homebuilding Foundation/Construction Industry
cies of the Housing Element of the San Francisco Research Board provided building permit data for
General Plan. Housing policy implications that the Bay Area region. The California Association of
may arise from data in this report, however, are Realtors provided housing rental and ownership
not discussed here. costs. Project sponsors also contributed data.
The Housing Inventory reports housing production, Copies of this report can be downloaded from
which begins when a building permit application the Publications & Reports link at the Planning
for a project is filed with the City. The application Department’s web site at http://www.sfplanning.
is first reviewed by the Planning Department for org.
compliance with the Planning Code, zoning, and
other applicable policies. If the Planning Depart- A limited number of copies are available for pur-
ment approves the project, the Department of chase from the Planning Department, 1650
Building Inspection (DBI) reviews the application Mission Street, Suite 400, San Francisco, CA
for compliance with the Building Code. If DBI 94103. Copies may also be reviewed at the
approves the application, it issues a permit autho- Government Information Center on the fifth floor
rizing construction. The next step is for the project of the San Francisco Main Library.
sponsor to begin construction on the project. Once
construction has been completed and passed all Department Staff Contact for this report is
required inspections, DBI issues a Certificate of Svetha Ambati, (415) 575-9183,
Final Completion (CFC) for the project. svetha.ambati@sfgov.org.
The Housing Inventory also reports the annual net
gain in housing units citywide by general Zoning
Districts and by Planning Districts. Net gain is
the number of newly constructed units with CFCs
issued, adjusted for alterations – which can add
or subtract units – and demolitions. Affordable
housing, condominiums, and changes in the
residential hotel stock are other areas of interest
covered by the Housing Inventory. In addition, the
report provides a regional perspective by examin-
ing housing construction activity and home prices
for the nine-county Bay Area region. Finally, major
projects completed, authorized, under review, or
in the pipeline are listed in Appendix A. The Hous-
ing Inventory also summarizes housing production
trends in the recently adopted planning areas
in Appendix B. These plan areas have separate
1Housing Production Process
The Housing Inventory describes net changes in days from the date the permit is issued. Start of
the housing stock and details units that have been construction, however, may be delayed for up to
certified complete, units that were authorized for a year. If the permit is not picked up or acted on
construction, and units that are under review by within 90 days, the permit expires. The number of
the Planning Department. units authorized for construction is a key indicator
of future housing construction.
The housing production process begins with a
project review by the Planning Department and Units Certified Complete
ends with the issuance of a Certificate of Final
Completion (CFC) by the Department of Building Projects are inspected by DBI at various stages
Inspection (DBI). Figure 1 outlines the main throughout the construction process. However,
stages of the housing production process. inspectors only issue Certificates of Final Comple-
tions (CFCs) for projects that are deemed 100%
Units Reviewed by Planning Department complete. Units certified complete are an indicator
and DBI of changes to the City’s housing supply and
include units gained or lost from new construction,
For most major projects, review by the Planning alterations, and demolitions.
Department is the first step in the process. Propos-
als are reviewed by the Planning Department for For the purposes of this report, however, units
compliance with the Planning Code, the General that have received Temporary Certificates of Occu-
Plan, environmental requirements, and other regu- pancy (TCOs) or “Final Inspection Approval” from
lations and policies. Generally, only major projects the Department of Building Inspection are also
require special Planning Department approvals, considered and counted as completed units.
such as a conditional use permit or variance. The
number and type of projects undergoing Planning Housing production is measured in terms of units
Department review are indicators of current build- rather than projects because the number of units
ing interest and production expectation within the in a project varies. Not all projects reviewed or
next two to five years. Following Planning Depart- approved are built. A project’s building permit
ment approval and entitlements, the Department application may be withdrawn, disapproved, or
of Building Inspection (DBI) reviews the project for revised; its permit may also expire if, for example,
compliance with the Building Code. a project is not financed. Housing production is
also affected by changes in market conditions and
Units Authorized for Construction the economy. However, once building construction
starts, a project is usually completed within one to
If DBI approves the project following its own two years, depending on the size of the project.
review, it issues building permits authorizing
construction. Projects with approved building
permits generally start construction within 90
FIGURE 1.
The Housing
Production Process Housing Units Housing Units Housing Units Housing Units
UNDER PLANNIng/
Under Planning/ Authorized for Under Certified
DBI REVIEW
Review Construction Construction Complete
2 SAN FRANCI SCO PL AN N IN G DE PAR T M E N T33 8th St (Trinity SF), 540 market-rate units;
Photo Source: http://trinitysf.com
3HIGHLIGHTS:
2017 SNAPSHOT
4 SAN FRANCI SCO PL AN N IN G DE PAR T M E N TS a n Fr a n ci s co H ou s i n g I n vento ry | 2017
Summary of highlights
The construction of new housing in 2017 totaled In 2017, affordable housing production increased
over 4,500 units, which represents a 14% to over 1,460 units from the 802 units built in
decrease from 2015. This production includes 2016, representing an 83% increase. This is the
4,270 units in new construction and 241 new highest point of affordable housing production
units added through conversion of non-residential since 1990. These new affordable units made
uses or expansion of existing structures. Seventy up 34% of new units added to the City’s housing
units were lost through demolition (18), unit stock. This count includes approximately 400
mergers (4), removal of illegal units (44), conver- inclusionary units and about 100 secondary units.
sions (2), and a correction to official records (2). About 85% of the new affordable units are afford-
The city experienced a 32% decrease in units able to extremely-low, very-low, and low-income
added through alterations and a 70% decrease in households. About 3% of the new affordable units
units lost through alterations since 2016. are senior housing units.
There was a net addition of 4,441 units to the In 2017, over 6,700 units were authorized for
City’s housing stock in 2017, a 12% decrease construction, representing a 65% increase from
from 2016’s net addition. The net addition in 2016. New housing authorized for construction
2017, however, is about 60% more than the over the past five years continues to be over-
10-year average net addition of 2,745, and whelmingly (93%) for buildings with 20 or more
represents an upward trend in net unit production units. The Planning Department approved and
from the lowest production point of 2011. By the fully entitled 72 projects in 2017. These projects
end of 2017, there were approximately 392,000 propose a total of 7,679 units.
dwelling units in the city.
Housing stock
Housing Stock by Building Type
392,038 1%
2017 change from 2016
28%
32% 20+ Units
10 to 19 Units
5 to 9 Units
2 to 4 Units
Single Family
10%
20%
10%
5NEW CONSTRUCTION trends
20-Year
20-year newNew Constructiontrends,
construction Trends,1998–2017
1997‒2016
6,000
5,000
4,000
Number of Units
3,000
2,000
1,000
0
1998 1999 2000 2001 2002 2003 2004 2005 2006 2007 2008 2009 2010 2011 2012 2013 2014 2015 2016 2017
Units Completed from New Construction Net Change in Number of Units
4,270 13%
20-Year Unit Demolition Trends, 1997‒2016
64%
2017 change from 2016 Above 10-year average
6,000
4,441 12% 62%
5,000
2017 change from 2016 Above 10-year average
4,000
Number of Units
3,000
2,000
1,000
0
1998 1999 2000 2001 2002 2003 2004 2005 2006 2007 2008 2009 2010 2011 2012 2013 2014 2015 2016 2017
Units demolished Net Change in Number of Units
6 SAN FRANCI SCO PL AN N IN G DE PAR T M E N T1998 1999 2000 2001 2002 2003 2004 2005 2006 2007 2008 2009 2010 2011 2012 2013 2014 2015 2016 2017
Units Completed from New Construction Net Change in Number of Units S a n Fr a n ci s co H ou s i n g I n vento ry | 2017
UNIT DEMOLITION TRENDS
20-Year Unit Demolition Trends, 1997‒2016
20-year UNIT DEMOLITION trends, 1998–2017
6,000
5,000
4,000
Number of Units
3,000
2,000
1,000
0
1998 1999 2000 2001 2002 2003 2004 2005 2006 2007 2008 2009 2010 2011 2012 2013 2014 2015 2016 2017
Units demolished Net Change in Number of Units
18 40% 83%
20-Year Units Authorization Trends, 1997‒2016
2017 change from 2016 below 10-year average
6,000
5,000
4,000
Number of Units
3,000
2,000
1,000
0
1998 1999 2000 2001 2002 2003 2004 2005 2006 2007 2008 2009 2010 2011 2012 2013 2014 2015 2016 2017
Units authorized for construction Net Change in Number of Units
71998 1999 2000 2001 2002 2003 2004 2005 2006 2007 2008 2009 2010 2011 2012 2013 2014 2015 2016 2017
Units demolished Net Change in Number of Units
UNIT AUTHORIZATION FOR CONSTRUCTION TRENDS
20-year UNITUnits
20-Year AUTHORIZATION FORTrends,
Authorization CONSTRUCTION trends, 1998–2017
1997‒2016
6,000
5,000
4,000
Number of Units
3,000
2,000
1,000
0
1998 1999 2000 2001 2002 2003 2004 2005 2006 2007 2008 2009 2010 2011 2012 2013 2014 2015 2016 2017
Units authorized for construction Net Change in Number of Units
6,731 65% 117%
2017 change from 2016 Above 10-year average
8 SAN FRANCI SCO PL AN N IN G DE PAR T M E N TS a n Fr a n ci s co H ou s i n g I n vento ry | 2017
2017 Housing Unit Trends
UNITS ADDED BY BUILDING TYPE, 2017
2%3%
1% 2%
20+ Unit BUILDINGS
94% 10 to 19 Unit BUILDINGS
3 to 9 Unit BUILDINGS
2 Unit BUILDINGS
Single Family BUILDINGS
UNITS lost through alterations and demolitions by type of loss, 2017
3%
26%
3%
6%
DEMOLITIONS
63% ALTERATIONS
ILLEGAL UNITS REMOVED
UNITS MERGED INTO LARGER UNITS
74% Correction TO OFFICIAL RECORDS
units converted
UNITS demolished by building type, 2017
19%
47%
25% 5+ Unit BUILDINGS (0%)
3 to 4 Unit BUILDINGS
2 Unit BUILDINGS
Single Family BUILDINGS
9CONDOMINIUMS in 2017
new condominiums recorded by building type, 2017
1%1%
3,216 60%
2017 change from 2016
1%
20+ Units
10 to 19 Units
5 to 9 Units
3 TO 4 Units (S a n Fr a n ci s co H ou s i n g I n vento ry | 2017
AFFORDABLE HOUSING IN 2017
AFFORDABLE HOUSING AND MARKET-RATE HOUSING, 2017
1,466 83%
2017 change from 2016
34%
MARKET RATE Units
AFFORDABLE Units
66%
Affordable units include 100% affordable units,
inclusionary units, and units built as accessory
dwelling units.
New Affordable Housing Construction by Income Level, 2017
15%
47%
Extremely Low (30% AMI) (0% Added)
Very Low (50% AMI)
38% Low (80% AMI)
Moderate (120% AMI)
New Affordable Housing Construction by Housing Type, 2017
7%
11%
4% OTher
3% FAMILY
SENIOR
INDIVIDUAL/SRO
HOMEOWNER
76%
11HOUSING TRENDS BY GEOGRAPHY
Units Authorized for Construction for San Francisco and the Bay Area Counties, 2017
County Single-Family Units Multi-Family Units Total Units Percent of Total
Alameda 2,668 5,855 8,523 27%
Contra Costa 1,739 167 1,906 6%
Marin 104 0 104 < 1%
Napa 136 56 192 1%
San Francisco 45 6,686 6,731 21%
San Mateo 487 1,088 1,575 5%
Santa Clara 2,098 8,528 10,626 34%
Solano 759 54 813 3%
Sonoma 533 351 884 3%
TOTAL 8,569 22,785 31,354 100%
Source: California Homebuilding Foundation
North Bay
Sonoma Napa
1%
3% Solano
pacific oceanS a n Fr a n ci s co H ou s i n g I n vento ry | 2017
Regional Housing Needs Allocation, Planning period 2015–2022
Housing Goals Actual Production % of Production Production Deficit
Household Affordability
2015–2022 as of 2017 Target Achieved as of 2017
Above Moderate
12,536 10,026 80% 2,510
(> 120% AMI)
Moderate Income
5,460 612 11% 4,848
(80–120% AMI)
Low Income
4,639 1,070 23% 3,569
(< 80% AMI)
Very Low Income
6,234 2,759 44% 3,475
(< 50% AMI)
TOTALS 28,869 14,467 50% 14,402
Actual production totals differ from the Housing Inventory totals for net unit production because the state allows
jurisdictions to include substantial rehabilitation to existing affordable housing units to count toward meeting up to a
quarter of RHNA goals.
Actual Production, 2015-2022
19%
The State Department of Housing and Community Development, along
with the Association of Bay Area Governments set the regional housing
needs allocation or RHNA targets for housing production in every county
in the Bay Area. Sixty percent of RHNA targets are required to be afford-
7% able to households with varying incomes. Over 28,000 net new housing
units have been allocated to San Francisco for the years 2015-2022. The
number of units produced as of 2017 are shown in the pie chart.
4%
69% VEry low income (120% AMI)
13FINDINGS:
HOUSING IN
SAN FRANCISCO
14 SAN FRANCI SCO PL AN N IN G DE PAR T M E N TS a n Fr a n ci s co H ou s i n g I n vento ry | 2017
Housing Stock
The number of units in San Francisco’s housing density buildings (two to nine units – 30%), and
stock is derived by taking the total units from the higher density structures (10 or more units –
decennial census count as baseline, then adding 38%). This distribution is similar over
net unit change each subsequent year until the the last six years and will likely change in the next
next census. Because the 2010 Census did not few years as the trend has been moving towards
collect detailed housing characteristics, the 2015 increasingly larger buildings, as presented in Table
Housing Inventory used data from the 2010 11.
Five Year American Community Survey (2010
ACS5), and the 2017 Housing Inventory uses this In 2017, there was a net gain of 4,441 units in
calculation as a baseline for consistency. Annual the City’s housing stock. As of December 2017,
net unit change – the sum of units completed from units in buildings with 20 or more units comprised
new construction and alterations minus units lost 28% of the City’s total housing. Of all units added
from demolition and alterations – are added to this since the 2010 ACS5, over 92% have been in
2010 ACS5 baseline count. buildings with 20 units or more.
According to the 2010 ACS5 and new production Table 1 provides a profile of San Francisco’s
over the last six years, there are about 392,038 housing stock by building type from 2010 through
housing units in San Francisco, distributed 2017. Figure 2 illustrates San Francisco’s housing
between single family units (32%), moderate stock by building type for 2017.
TABLE 1.
San Francisco Housing Stock by Building Type, 2010–2017
Building Type Single Family 2 to 4 Units 5 to 9 Units 10 to 19 Units 20 + Units Total
2010 ACS5 123,951 79,744 37,088 37,656 93,496 372,560
Net Added
179 501 312 480 18,006 19,478
2011–2017
TOTAL 124,130 80,245 37,400 38,136 111,502 392,038
Source: U.S. Census Bureau; Planning Department
* This total includes other “housing” types that the Census Bureau counts, such as mobile homes, RVs, vans, and houseboats.
FIGURE 2.
San Francisco 4% 3%
Housing Stock
by Building
Type, 2017
1% 1%
20+ Unit BUILDINGS
10 to 19 Unit BUILDINGS
91%
5 to 9 Unit BUILDINGS
2-4 Unit BUILDINGS
Single Family BUILDINGS
15Housing Production Trends
New Housing Construction
»» New construction unit totals for 2017 – 4,270 Four of the larger projects with over 200 units
– is a 13% decrease from 2016. New con- completed in 2017 include: 33 8th Street (550
market-rate units and 82 low-income affordable
struction in 2017 is 93% above the 10-year
inclusionary units), 41 Tehama Street (319
average of 2,208 new construction units.
market rate units and 60 moderate income afford-
able inclusionary units), 801 Brannan Street (257
»» Alterations resulted in 241 units added through market rate units and 55 low-income affordable
conversion or expansion of existing structures. inclusionary units), and 1201 Tennessee Street
However, 52 units were lost due to removal (229 market rate units and 34 low-income afford-
of illegal units, mergers, conversion to non- able inclusionary units).
residential use and corrections to administrative
records. The 200 unit 588 Mission Bay Boulevard North
(100% affordable, with 198 very low and low-
income units and two managers’ units) and 2500
This means a net total of 189 units were added
Arelious Walker Drive (100% affordable, with 121
to the housing stock through “alterations”
very low and low-income units and one manager’s
of existing units or buildings. This is a 4% unit) are two major affordable housing projects
increase from the 181 net units added
in 2016 as a result of alterations.
»» Eighteen units were demolished in 2017.
»» In 2017, net addition to the City’s housing
stock decreased by 12% from 2016. This
2017 net new unit count of 4,441 is still
almost 62% more than the 10-year average of
2,745 net new units.
»» Affordable units made up 34% of new units
built in 2017. The number of affordable units
built in 2017 is 82% greater than the number
of affordable units built in 2016.
»» In 2017, the Department of Building Inspec-
tion (DBI) authorized 6,731 units for construc-
tion. This represents a 65% increase from the
number of units authorized in 2016 (4,059).
Table 2 and and the figure on page six show
housing production trends over the past 20 years.
The table and figure account for net new units
gained – which is the number of units newly
constructed and adjusted for alterations, which
can add or subtract units, and demolitions.
16 SAN FRANCI SCO PL AN N IN G DE PAR T M E N TS a n Fr a n ci s co H ou s i n g I n vento ry | 2017
TABLE 2.
San Francisco Housing Trends, 1998–2017
Units Completed Units Gained Net Change
Units Authorized Units
Year from New or Lost from In Number
for Construction Demolished
Construction Alterations of Units
1998 2,336 909 54 19 874
1999 3,360 1,225 98 158 1,285
2000 2,897 1,859 61 (1) 1,797
2001 2,380 1,619 99 259 1,779
2002 1,478 2,260 73 221 2,408
2003 1,845 2,730 286 52 2,496
2004 2,318 1,780 355 62 1,487
2005 5,571 1,872 174 157 1,855
2006 2,332 1,675 41 280 1,914
2007 3,281 2,197 81 451 2,567
2008 2,346 3,019 29 273 3,263
2009 752 3,366 29 117 3,454
2010 1,209 1,082 170 318 1,230
2011 2,033 348 84 5 269
2012 3,888 794 127 650 1,317
2013 3,168 2,330 429 59 1,960
2014 3,834 3,454 95 155 3,514
2015 2,982 2,472 25 507 2,954
2016 4,059 4,895 30 181 5,046
2017 6,731 4,270 18 189 4,441
TOTAL 58,800 44,156 2,358 4,112 45,910
Source: Planning Department
Note: Net Change equals Units Completed less Units Demolished plus Units Gained or (Lost) from Alterations.
17completed in 2017. »» In 2017, 591 projects with about 5,149 total
units were filed with the Planning Department.
A list of all market rate projects with 10 units or This is a 25% decrease from the number of
more completed in 2017 is included in Appendix projects filed in 2016 and is about 5% above
A-1. Appendix A-2 includes all major affordable the five-year average of 4,866 units.
housing projects completed in 2017.
Projects Approved and Under Review »» The Planning Department approved and fully
by Planning entitled 72 projects in 2017. These projects
propose a total of 7,679 units. Two of the
Depending on the type of project, there are vari- larger projects filed in 2017 include: 655 4th
ous approvals by the Planning Department that a Street (904 total units) and 469 Stevenson
project needs to be fully entitled. Full entitlement Street (336 total units).
of a project means that the project sponsor can
proceed with the next step in the development Table 3 shows the number of housing projects
process: securing approval and issuance of a filed with the Planning Department over the last
building permit. five years. It is important to note that Planning
may not approve all projects under review or may
TABLE 3. not approve projects at the unit levels requested.
Projects and Units Filed at Planning Department for Project sponsors may also change or withdraw the
Review, 2013–2017 project proposals. Some projects listed in Table
3 as undergoing Planning Department review
Year Projects Filed Units Filed may have reached their approval stage, been
2013 288 4,840
authorized for construction, or may have been
completed. Lastly, many of the housing projects
2014 145 2,458 under development by the Office of Community
Investment and Infrastructure (OCII) do not show
2015 409 5,099
up in Table 3 because the OCII is responsible for
2016 562 6,783 the review of those projects.
2017 591 5,149
Appendix A-3 records major projects (10 units
TOTAL 1,995 24,329 or more) that received Planning entitlements in
2017. Appendix A-4 contains a list of the major
Source: Planning Department projects (10 or more units) filed at the Planning
Department for review during 2017.
TABLE 4.
Units and Projects Authorized for Construction by DBI by Building Type, 2013–2017
Units by Building Type
Year Total Projects
Single Family 2 Units 3 to 4 Units 5 to 19 Units 20+ Units
2013 36 76 35 42 2,979 3,168 135
2014 49 144 70 75 3,496 3,834 240
2015 39 142 68 127 2,606 2,982 276
2016 52 151 105 192 3,559 4,059 386
2017 45 82 100 256 6,248 6,731 331
TOTAL 221 595 378 692 18,888 20,774 1,368
Source: Planning Department
18 SAN FRANCI SCO PL AN N IN G DE PAR T M E N TS a n Fr a n ci s co H ou s i n g I n vento ry | 2017
Units Authorized for Construction Alterations and Conversions
»» In 2017, DBI authorized 6,731 units for The majority of building permits issued by DBI are
construction, 65% more than in 2016. This for residential alterations. These alteration permits
number is also about 62% higher than the five- are for improvements within existing buildings
year average (4,155). Since units authorized or dwelling units. Some alterations expand the
for construction is one of the indicators of building envelope without increasing the number
future housing construction, the number of new of units in the building. The Housing Inventory is
units completed is expected to increase over primarily concerned with alterations which result
the next few years. in a net loss or gain in the total number of units in
the housing stock.
»» There were less projects authorized in 2017:
331 compared to 386 projects in 2016. In Dwelling units are gained by additions to existing
2017, the average project size was 20 units, housing structures, conversions to residential use,
which was above the average project size for and legalization of illegal units. Dwelling units are
the five years between 2013 and 2017 (15). lost by merging separate units into larger units, by
conversion to commercial use, or by the removal
Table 4 summarizes the number of projects and of illegal units.
units by building type authorized for construction
by the Department of Building Inspection (DBI). The net gain of 189 units from alterations in 2017
is comprised of 241 units added and 52 units
»» Majority of the units authorized for construction eliminated.
in 2017 (93%) are in projects with 20 units
or more. »» Net units gained through alterations decreased
30% from the previous year – 241 units in
»» Major projects authorized for construction dur- 2017 compared to 359 units in 2016.
ing the reporting year include: 49 South Van
Ness Avenue (550 units); 1500 Mission Street »» Of the 52 units lost through alteration in 2017,
(550 units); and 55 Chumasero Drive (313 44 were illegal units removed, 4 units were
units). lost due to mergers, 2 were units converted,
and 2 units were correction to official records.
Appendix A-5 lists all projects with ten or more This represents a 71% decrease in units lost
units authorized for construction in 2017. through alterations from 2016 (359).
Table 7 shows the number of units added or
Demolitions eliminated through alteration permits from 2013
to 2017. Table 8 profiles the type of alterations
»» A total of 18 units were demolished in 2017. and demolitions that caused the loss of units dur-
ing the same period.
»» The demolition of the 18 units in 2017 is
87% below the five-year demolition average »» The net total of 70 units lost in 2017 due to
of 119 units. demolition or alteration is 66% less than the
net total lost in 2016.
Table 5 shows the units demolished between
2013 and 2017 by building type and Table 6
shows the demolitions in 2017 by Zoning District.
It should be noted that city policies require a
minimum of one to one replacement of demol-
ished housing.
19TABLE 5.
Units Demolished by Building Type, 2013–2017
Units by Building Type
Year Buildings Total
Single 2 Units 3 to 4 Units 5+ Units
2013 11 11 - - 418 429
2014 33 18 6 32 39 95
2015 17 15 2 0 8 25
2016 17 14 0 8 8 30
2017 14 11 4 3 0 18
TOTAL 92 69 12 43 473 597
Source: Planning Department
TABLE 6.
Units Demolished by Zoning District, 2017
Units
Zoning District Buildings Total Percent of Total
Single Family Multi-Family
RH-1 4 4 0 4 22%
RH-2 8 5 7 1 67%
RH-3 1 1 0 1 6%
RM-1 1 1 0 1 6%
TOTAL 14 11 7 18 100%
Source: Planning Department
TABLE 7. Year Units Added Units Eliminated Net Change
Units Added or Lost Through
Alteration Permits, 2013–2017 2013 169 110 59
2014 200 45 155
2015 623 116 507
2016 359 178 181
2017 241 52 189
TOTAL 1,592 501 1,091
Source: Planning Department
20 SAN FRANCI SCO PL AN N IN G DE PAR T M E N TS a n Fr a n ci s co H ou s i n g I n vento ry | 2017
TABLE 8.
Units Lost Through Alterations and Demolitions, 2013–2017
Alterations
Units Total Units
Year
Illegal Units Units Merged Correction to Units Total Demolished Lost
Removed into Larger Units Official Records Converted Alterations
2013 70 38 2 0 110 429 539
2014 24 20 1 0 45 95 140
2015 100 12 1 3 116 25 141
2016 72 16 12 78 178 30 208
2017 44 4 2 2 52 18 70
TOTAL 310 90 18 83 501 597 1,098
Source: Planning Department
Accessory Dwelling Units
Accessory Dwelling Units (ADUs), also known The ADU program also allows legalizations of
as secondary units, in-law units, or cottages, existing ADUs without any prior permit history.
are independent dwelling units added to existing This voluntary program allows property owners to
residential buildings. ADUs are subordinate to the formally register and rent their unwarranted units in
primary residential unit(s), generally due to the San Francisco, and to ensure that each unit meets
location or size of the ADU. These units can either safety conditions.
be developed within the existing building, as an »» In 2017, 23 ADUs were completed. Four ADUs
extension to the existing building, or as an entirely were added in buildings with two to four units,
separate structure. and 19 ADUs were added in building with five
or more units.
As part of an effort to address growing housing
demands, the ADU program offers homeowners »» In 2017, 76 illegal secondary units were
and contractors a way to add a unit to an exist- legalized through the ADU legalization program.
ing residential building. By legally adding a unit, a Approximately 80% of these legalized units were
homeowner potentially subsidizes their mortgage in buildings with two to four units.
by creating a rental apartment, or enables the cre-
ation of a multi-generational household. Table 9 shows the number of ADUs added and
A property owner or landlord can also turn under- legalized in 2017. Table 10 shows the number
utilized spaces within an existing apartment build- of ADUs added and legalized by building type in
ing into additional dwelling units, and as a result, 2017. A detailed report on ADU production and the
increase housing options for residents. corresponding legalization program will be jointly
produced by DBI and Planning in 2018.
TABLE 9.
Accessory Dwelling Units Added and Legalized, 2017
ADUs ADU Legalizations
Year Total
Completed Completed
2017 23 76 99
Source: Planning Department, Department of Building Inspection
21TABLE 10.
Accessory Dwelling Units Added and Legalized by Building Type, 2017
Units by Building Type
Year Buildings Total
Single 2 to 4 Units 5 to 9 Units 10+ Units
2017 91 - 64 20 15 99
Source: Planning Department, Department of Building Inspection
New Housing Unit Trends
New construction and residential conversions are »» The share of units added in high-density build-
the primary engine behind changes to the housing ings (20 or more units) —90%— is just below
stock. This section examines units added to the than the five-year average of 91%.
housing stock over the past five years by looking
at the types of buildings and the Zoning Districts Table 11 shows new construction from 2013
where they occurred. For 2017, this section through 2017 by building type.
examines all units added to the housing stock
including ADUs, not just those added through new
construction.
New Housing Units Added by
Types of Buildings Zoning District
»» New housing units added over the past five Approximately 55% of units added in 2017 were
years continues to be overwhelmingly (91%) in Mixed Use zoning districts. Residential, House
in buildings with 20 or more units. and Mixed zoning districts contributed 22%, and
Commercial zoning districts followed with 21% of
»» Forty-eight single-family units were added in total units added.
2017, 27% less than the previous year’s addi-
tion. Single-family building construction made Table 12 summarizes new units added in 2017
up a very small proportion of new construction by generalized Zoning Districts. Table 13 lists the
in the past five years (1%). number of units constructed in various Zoning Dis-
tricts in the City. A complete list of San Francisco’s
»» More units were added in the “3-9 Units” Zoning Districts is included in Appendix C.
category than in the previous four years (214
units added in 2017).
22 SAN FRANCI SCO PL AN N IN G DE PAR T M E N TS a n Fr a n ci s co H ou s i n g I n vento ry | 2017
TABLE 11.
Housing Units Built by Building Type, 2013–2017
Year Single Family 2 Units 3 to 9 Units 10 to 19 Units 20+ Units Total
2013 24 0 131 122 2,222 2,499
2014 33 64 80 164 3,313 3,654
2015 48 149 90 45 2,763 3,095
2016 66 68 106 76 4,579 4,895
2017 48 138 214 68 4,043 4,511
TOTAL 219 419 621 475 16,920 18,654
"Share of Total
Units Added, 1% 2% 3% 3% 91% 100%
2013-2017"
Source: Planning Department
TABLE 12. General Zoning Districts Units Percent of Total Rank
Net Housing Units
Added by Commercial (RC, C-3-G) 944 21% 3
Generalized
Zoning, 2017 Industrial (PDR-1-G) 1TABLE 13.
Housing Units Added by Zoning District, 2017
Zoning Districts Units Percent of Total Rank
C-3-G 597 13% 3
C-3-O 319 7% 5
HP-RA 36 1% 15
MB-RA 239 5% 7
MUR 227 5% 8
NC-1 9 < 1% 22
NC-2 10 < 1% 21
NC-3 116 3% 10
NCD 119 3% 9
NCT 369 8% 4
P 93 2% 11
PDR-1-G 1 < 1% 26
RC-4 39 1% 14
RCD 28 1% 18
RED 11 < 1% 20
RH-1 57 1% 13
RH-2 74 2% 12
RH-3 30 1% 17
RM-1 741 16% 2
RM-2 8 < 1% 23
RM-3 32 1% 16
RM-4 3 < 1% 25
RTO 7 < 1% 24
RTO-M 15 < 1% 19
UMU 1,072 24% 1
WMUG 259 6% 6
TOTAL 4,511 100%
Source: Planning Department
24 SAN FRANCI SCO PL AN N IN G DE PAR T M E N TS a n Fr a n ci s co H ou s i n g I n vento ry | 2017
Condominiums
All condominium developments, whether new TABLE 14.
construction or conversions, are recorded with the New Condominiums Recorded by DPW, 2008–2017
Department of Public Works’s (DPW) Bureau of
Street-Use and Mapping (BSM). Annual condo- % Change from
Year Units
Previous Year
minium totals recorded by DPW do not directly
correlate with annual units completed and counted 2008 1,897 -44%
as part of the Housing Inventory because DPW’s 2009 835 -56%
records may be for projects not yet completed or
2010 734 -56%
from projects completed in a previous year. Large
multi-unit developments also file for condominium 2011 1,625 121%
subdivision when they are first built even though 2012 976 -40%
the units may initially be offered for rent. Condo-
minium construction, like all real estate, is subject 2013 2,586 165%
to market forces and varies from year to year. 2014 1,977 -24%
2015 2,099 6%
New Condominium Construction
2016 2,019 -4%
»» New condominium construction in 2017 2017 3,216 59%
increased to 3,216 units from 2,019 units in
2016 (an increase of 59%). TOTAL 14,748
»» Approximately 97% of the condominiums Source: Department of Public Works, Bureau of Street-Use and Mapping
recorded were in buildings with 20 or more
units (3,116 units which represented a 64%
increase from 2016).
Table 14 shows construction of new condomini-
ums recorded by DPW over the past ten years and
Table 15 shows new condominium construction
by building type over the past five years.
TABLE 15.
New Condominiums Recorded by the DPW by Building Type, 2013–2017
Year 2 Units 3 to 4 Units 5 to 9 Units 10 to 19 Units 20+ Units Total
2013 18 24 33 130 2,381 2,586
2014 20 30 34 26 1,867 1,977
2015 18 16 40 16 2,009 2,099
2016 18 29 0 77 1,895 2,019
2017 22 12 38 28 3,116 3,216
TOTAL 96 111 145 277 11,268 11,897
Source: Department of Public Works, Bureau of Street-Use and Mapping
25Condominium Conversions
The San Francisco Subdivision Code regulates TABLE 16.
condominium conversions. Since 1983, conver- Condominium Conversions Recorded by DPW, 2008–2017
sions of units from rental to condominium have
been limited to 200 units per year and to build- Year Units
% Change from
Previous Year
ings with six or fewer units. More than 200 units
may be recorded in a given year because units 2008 845 8%
approved in a previous year may be recorded in 2009 803 -5%
a subsequent year. The 200-unit cap on conver-
sions can also be bypassed for two-unit buildings 2010 537 -33%
with owners occupying both units. 2011 472 -12%
2012 488 3%
»» Condominium conversions decreased by 29%
in 2017 (296 from 417 conversions in 2016). 2013 369 -24%
This number is 47% lower than the 10-year 2014 730 98%
average of 562 units.
2015 661 -9%
»» About 40% of units converted in 2017 2016 417 -37%
occurred in two-unit buildings, followed by
2017 296 -29%
24% occurring in three-unit buildings.
TOTAL 5,618
»» Sixty-four percent of the condominium conver-
sions in 2017 (190) were in buildings with Source: Department of Public Works, Bureau of Street-Use and Mapping
two or three units, a trend repeated from 2014
through 2016.
Table 16 shows the number of conversions
recorded by DPW from 2008-2017. Table 17
shows condominium conversions by building type
over the past five years.
TABLE 17.
Condominium Conversions Recorded by DPW by Building Type, 2013–2017
Year 2 Units 3 Units 4 Units 5 to 6 Units Total
2013 198 81 68 22 369
2014 156 312 156 106 730
2015 154 267 200 40 661
2016 118 120 80 99 417
2017 118 72 48 58 296
TOTAL 744 852 552 325 2,473
Source: Department of Public Works, Bureau of Street-Use and Mapping
26 SAN FRANCI SCO PL AN N IN G DE PAR T M E N TS a n Fr a n ci s co H ou s i n g I n vento ry | 2017
Residential Hotels
Residential hotels in San Francisco are regulated »» As of 2017, 19,039 residential hotel rooms
by Administrative Code Chapter 41 – the Residen- are registered in San Francisco; 70% are resi-
tial Hotel Conversion and Demolition Ordinance dential rooms in for-profit residential hotels and
(HCO), enacted in 1981. The Department of 30% are residential in non-profit hotels.
Building Inspection (DBI) Housing Inspection
Services Division administers the HCO. This
ordinance preserves the stock of residential hotels
and regulates the conversion and demolition of
residential hotel units.
Table 18 reports the number of residential hotel
buildings and units for both for-profit and nonprofit
residential hotels from 2013 through 2017.
TABLE 18.
Changes in Residential Hotel Stock, 2012–2016
For Profit Residential Hotels Non-Profit Residential Hotels Total
Year
Buildings Resid. Rooms Tourist Rooms Buildings Resid. Rooms Buildings Resid. Rooms
2013 414 13,903 2,942 87 5,105 501 19,008
2014 412 13,678 2,901 91 5,434 503 19,112
2015 412 13,742 2,922 90 5,424 502 19,166
2016 403 13,247 2,732 95 5,781 498 19,028
2017 392 12,498 2,526 109 6,541 501 19,039
Source: Department of Building Inspection
27Affordable Housing
Standards and Definitions of Affordability
Affordable housing by definition is housing that Affordable ownership unit: A unit for which the
is either rented or owned at prices affordable to mortgage payments, PMI (principal mortgage
households with low to moderate incomes. The insurance), property taxes, homeowners dues,
United States Department of Housing and Urban and insurance equal 33% of the gross monthly
Development (HUD) determines the thresholds income of a household earning between 80% and
by household size for these incomes for the San 120% of the San Francisco HFMA median income
Francisco HUD Metro Fair Market Rent Area (assuming a 10% down payment and a 30-year
(HMFA). The HMFA includes San Francisco, 8% fixed rate loan).
Marin, and San Mateo counties. The standard
definitions for housing affordability by income level Inclusionary Affordable Housing Program —
are as follows: Ownership Units: These are units for which the
mortgage payments, PITI (principal, interest, taxes
Extremely low income: Units affordable to house- and insurance), and homeowners association
holds with incomes at or below 30% of the HUD dues equal less than 38% of the gross monthly
median income for the San Francisco HFMA; income of a household earning between 80% and
120% of the San Francisco HFMA median income
Very low income: Units affordable to households (assuming a 5% down payment and a 30-year
with incomes at or below 50% of the HUD fixed mortgage at the current market interest rate).
median income for the San Francisco HFMA;
Inclusionary Affordable Housing Program —
Lower income: Units affordable to households Rental Units: These units are rental units for
with incomes at or below 60% of the HUD households earning between 28% and 60% of
median income for the San Francisco HFMA; Area Median Income.
Low income: Units affordable to households with
incomes at or below 80% of the HUD median Tables 19 and 20 show the incomes and prices
income for the San Francisco HFMA, for affordable rental and ownership units based on
2017 HUD income limits.
Moderate income: Units affordable to households
with incomes at or below 120% of the HUD
median income for the San Francisco HFMA; and
Market rate: Units at prevailing prices without
any affordability requirements. Market rate units
generally exceed rental or ownership affordability
levels, although some small market rate units may
be priced at levels that are affordable to moderate
income households.
Housing affordability for units is calculated as
follows:
Affordable rental unit: A unit for which rent
equals 30% of the income of a household with
an income at or below 80% of the HUD median
income for the San Francisco HFMA, utilities
included.
28 SAN FRANCI SCO PL AN N IN G DE PAR T M E N TS a n Fr a n ci s co H ou s i n g I n vento ry | 2017
TABLE 19.
2017 Rental Affordable Housing Guidelines
Maximum
Income Levels Household Size Average Unit Size Monthly Rent
Annual Income
Extremely Low Income 1 Studio $24,200 $605
(30% of HUD Median Income) 2 1 Bedroom $27,700 $693
3 2 Bedroom $31,150 $779
4 3 Bedroom $34,600 $865
5 4 Bedroom $37,350 $934
6 5 Bedroom $40,150 $1,004
Very Low Income 1 Studio $40,350 $1,009
(50% of HUD Median Income) 2 1 Bedroom $46,150 $1,154
3 2 Bedroom $51,900 $1,298
4 3 Bedroom $57,650 $1,441
5 4 Bedroom $62,250 $1,556
6 5 Bedroom $66,900 $1,673
Lower Income 1 Studio $48,400 $1,210
(60% of HUD Median Income) 2 1 Bedroom $55,350 $1,384
3 2 Bedroom $62,250 $1,556
4 3 Bedroom $69,200 $1,730
5 4 Bedroom $74,700 $1,868
6 5 Bedroom $80,250 $2,006
Low Income 1 Studio $64,550 $1,614
(80% of HUD Median Income) 2 1 Bedroom $73,800 $1,845
3 2 Bedroom $83,000 $2,075
4 3 Bedroom $92,250 $2,306
5 4 Bedroom $99,600 $2,490
6 5 Bedroom $107,000 $2,675
Source: U.S. Department of Housing and Urban Development (HUD)
Note: Incomes are based on the 2017 Area Median Income (AMI) limits for the San Francisco HUD Metro FMR Area (HMFA). Rents are calculated based on 30% of gross monthly income.
(FMR = Fair Market Rents)
29TABLE 20.
2017 Homeownership Affordable Housing Guidelines
Household Average Maximum Monthly Maximum
Income Levels
Size Unit Size Annual Income Housing Expense Purchase Price
Low Income 1 Studio $56,500 $1,554 $194,193
(70% of HUD Median Income) 2 1 Bedroom $64,550 $1,775 $225,739
3 2 Bedroom $72,650 $1,998 $257,709
4 3 Bedroom $80,700 $2,219 $289,255
5 4 Bedroom $87,150 $2,397 $312,931
Median Income 1 Studio $72,650 $1,998 $273,627
(90% of HUD Median Income) 2 1 Bedroom $83,050 $2,284 $316,732
3 2 Bedroom $93,400 $2,569 $359,769
4 3 Bedroom $103,750 $2,853 $402,627
5 4 Bedroom $112,050 $3,081 $425,403
Moderate Income 1 Studio $88,750 $2,441 $352,816
(110% of HUD Median Income) 2 1 Bedroom $101,500 $2,791 $407,479
3 2 Bedroom $114,150 $3,139 $461,829
4 3 Bedroom $126,850 $3,488 $516,246
5 4 Bedroom $136,950 $3,766 $557,874
Source: U.S. Department of Housing and Urban Development (HUD)
Note: Incomes are based on the 2017 Area Median Income (AMI) limits for the San Francisco HUD Metro FMR Area (HMFA). Monthly housing expenses are calculated based on 33% of
gross monthly income. (FMR = Fair Market Rents). Maximum purchase price is the affordable price from San Francisco’s Inclusionary Housing Program and incorporates monthly fees
and taxes into sales price.
30 SAN FRANCI SCO PL AN N IN G DE PAR T M E N TS a n Fr a n ci s co H ou s i n g I n vento ry | 2017
New Affordable Housing Construction
»» About 1,460 affordable units were completed Major affordable housing projects completed in
in 2017, representing 32% of the new housing 2017 include: 588 Mission Bay Boulevard North
units added in 2017. Of these, 421 are new (100% affordable; 40 very low-income units,
inclusionary units, and 99 are new accessory 158 low-income units, and two managers’ units),
dwelling units (ADUs) or legalized through the 2500 Arelious Walker Drive (100% affordable;
ADU legalization program. 121 very low-income units and one manager’s
unit), and 848 Fairfax Avenue (100% affordable;
»» The number of affordable units built in 2017 106 very low-income units and one manager’s
(1,466) is 72% higher than the five year unit).
average of affordable units built (853 units).
This year represents the highest production All major (10 or more units) new affordable
of affordable units since the lowest point of housing projects completed in 2017 are detailed
production in 2011. in Appendix A-2. On-site affordable inclusionary
units are listed under major market rate projects in
»» Very low-income units represented 47% of the Appendix A-1. Affordable housing projects under
new affordable units that were constructed in construction, or in pre-construction or preliminary
2017; low-income units made up 38%, and planning with either the Mayor’s Office of Housing
moderate income units made up about 15%. or the Office of Community Investment and Infra-
structure are presented in Appendix A-6.
Table 21 shows the production of affordable hous-
ing by levels of affordability and Table 22 shows
new affordable housing by type. These numbers
do not include affordable units that result from
acquiring and rehabilitating residential buildings
by nonprofit housing organizations. Those units
are covered later in the report.
»» The number of new affordable units (1,466)
produced in 2017 was 83% more than in
2016 (802).
»» A total of 99 Accessory Dwelling Units (ADUs)
were added to existing residential buildings
in 2017. Typically, these are smaller units
and are sometimes referred to as secondary or
“granny” units. These are also usually afford-
able to households with moderate incomes,
however, these units are not income-restricted.
31TABLE 21.
New Affordable Housing Construction by Income Level, 2013–2017
Total % of
Extremely Low Very Low Lower Low Moderate Total All
Year Affordable All New
(30% AMI) (50% AMI) (60% AMI) (80% AMI) (120% AMI) New Units
Units Units
2013 -- 448 -- 220 44 712 2,499 28%
2014 -- 149 -- 477 131 757 3,654 21%
2015 -- 213 -- 66 *250 529 3,095 17%
2016 120 128 -- 364 *190 802 4,895 16%
2017 -- 686 -- 558 *222 1,466 4,511 32%
TOTAL 120 1,624 -- 1,685 837 4,266 18,654 23%
Source: Planning Department, Mayor’s Office of Housing
*From 2016, 53 of these units, from 2016, 65 of these units, and from 2017, 99 of these units are considered “secondary units” or ADUs and are not income-restricted
TABLE 22.
New Affordable Housing Construction by Housing Type, 2013–2017
Year Family Senior Individual/SRO Homeowner Other Total
2013 432 100 164 16 -- 712
2014 536 90 3 128 -- 757
2015 282 -- -- 194 53 529
2016 452 147 20 118 65 802
2017 1,116 39 55 157 99 1,466
2017
76% 3% 4% 11% 7% 100%
Percent of Total
Source: Planning Department, Mayor’s Office of Housing
Note: Family units include projects with a majority of two or more bedroom units. Individual / SRO includes projects with a majority of or one bedroom, residential care facilities, shelters, and
transitional housing.
The category “Other” signifies the units that are considered “secondary units” or ADUs and are not income-restricted.
32 SAN FRANCI SCO PL AN N IN G DE PAR T M E N TS a n Fr a n ci s co H ou s i n g I n vento ry | 2017
Inclusionary Housing
In 1992, the Planning Commission adopted »» Four hundred and twenty-one inclusionary
guidelines for applying the City’s Inclusionary units were completed in 2017. Two hundred
Affordable Housing Policy. This policy required and ninety-eight of these units are low-income
housing projects with 10 or more units that seek a units, and 123 are moderate income units.
conditional use (CU) permit or planned unit devel-
opment (PUD) to set aside a minimum of 10% of »» In 2017, the number of inclusionary units built
their units as affordable units. In 2002, the Board (421) represented a 6% decrease from that
of Supervisors legislated these guidelines into law provided in 2016 (449). However, the number
and expanded the requirement to all projects with of inclusionary housing units built in 2017 is
10 or more units. In condominium developments, 28% higher than the five-year annual average
the inclusionary affordable ownership units would of 329 units.
be available to households earning up to 100%
of the AMI; below market inclusionary rental units Appendix A-1 provides a complete list of projects
are affordable to households earning 60% or less with ten or more units constructed in 2017 and
of the area median income (AMI). If a housing details of inclusionary units for those projects that
project required a conditional use permit, then have them.
12% of the units would need to be made available
at the same levels of affordability. In Fiscal Year 2017, a total of $107 million was
collected as partial payments of in-lieu fees for
In 2006, the inclusionary requirements were projects. Appendix D is a summary of in-lieu fees
increased to 15% if units were constructed collected since 2008.
on-site, and to 20% if constructed off-site and
is applicable to projects of five units or more.
In 2013, the inclusionary requirements were
changed back to projects with 10 or more units
and the on-site requirement went back down to TABLE 23.
New Inclusionary Units, 2013–2017
12%. In August 2017, the inclusionary require-
ments were changed to 12% of on-site units for
projects with 10 to 24 units, and 18% on-site for Year Units
rental projects with 25 units or more and 20%
2013 220
on-site for ownership projects with 25 units or
more. For projects within the Mission Planning 2014 267
Area, North of Market Residential SUD (Tender- 2015 286
loin), and SoMa NCT (6th Street), the inclusionary
requirements will be as follows: 25% on-site for 2016 449
rental, 27% on-site for ownership in projects with 2017 421
25 or more units.These increases will apply to
new projects without an environmental evaluation TOTAL 1,643
initial study on or after January 12th, 2016. Table
23 shows inclusionary units completed from Source: Planning Department, Mayor’s Office of Housing
2013-2017.
33TABLE 24.
Housing Price Trends, San Francisco Bay Area, 20013–2017
Rental (Two Bedroom Apartment) For Sale (Two Bedroom House)
Year
San Francisco Bay Area San Francisco Bay Area
2013 $3,300 $1,955 $738,000 $473,940
2014 $4,580 $2,215 $805,000 $485,510
2015 $4,830 $2,213 $993,250 $561,170
2016 $4,870 N/A $1,257,500 $777,160
2017 $4,500 $2,846 $1,469,000 $910,350
Source: Zumper.com & Priceconomics for apartment rental prices, California Association of Realtors for home sale prices
Notes: The California Association of Realtors Bay Area data do not include Napa and Sonoma Counties
Affordability of Market Rate Housing
The San Francisco Bay Area remains one of the »» A San Francisco family of three with a
nation’s most expensive housing markets, despite combined household income that is 110%
median rents decreasing minimally since 2016. of the HUD median income (a household
which can afford a maximum sales price of
»» In 2017, median rental prices for a two- $461,829 according to Table 20) would fall
bedroom apartment in San Francisco decreased a little over $1 million short of being able to
to $4,500 per month. The fairly small rent purchase a median-priced two-bedroom home
price increases between the years 2014 and ($1,469,000).
2016 suggested rent trends began to flatten,
and 2017 indicates the first actual dip in »» A three-person household with a combined
median rental prices since 2011. household income at 80% of the median
income could pay a maximum rent of $2,075
»» The 2017 median rental price for a two- (according to Table 19) or only about 46% of
bedroom apartment in San Francisco is almost the median rent ($4,500).
60% higher than the median rental price for
the entire Bay Area. Table 24 gives rental and sales prices for 2008
through 2017. The high cost of housing continues
»» In 2017, the median price for a two- to prevent households earning less than the
bedroom home in San Francisco went up to median income from being able to purchase or
$1,469,000. This price is 17% higher than rent a median-priced home in San Francisco.
the 2016 median home price ($1,257,500).
34 SAN FRANCI SCO PL AN N IN G DE PAR T M E N TYou can also read