Searching for community wellbeing: population, work and housing in the town of Oamaru - Building Better Homes ...
←
→
Page content transcription
If your browser does not render page correctly, please read the page content below

Searching for community wellbeing:
population, work and housing in the
town of Oamaru

Building Better Homes, Towns & Cities: Thriving Regions
Working Paper: 20-08a
August 2020
Nick Taylor1, Mike Mackay2 & Katherine Russell1

1. Nick Taylor and Associates
2. AgResearch Limited

ISSN (online) 2624-0750

Title               Searching for community wellbeing: population, work and housing
                     in the town of Oamaru
 ISSN (online)       2624-0750
 Author(s)           Nick Taylor, Mike Mackay and Katherine Russell
 Series              Working Paper 20-08a

Author Contact Details
Nick Taylor
Nick Taylor and Associates
n.taylor@tba.co.nz
Mike Mackay
AgResearch Limited
mike.mackay@agresearch.co.nz

Katherine Russell
Nick Taylor and Associates
kjt54nz@gmail.com

Acknowledgements
This research is funded through the National Science Challenge: Building Better
Homes, Towns and Cities: Ko ngā wā kāinga hei whakamāhorahora (BBHTC). We
acknowledge collaboration with the Waitaki Housing Taskforce, however none of these
organisations are responsible for the information in this paper. Every effort has been made
to ensure the soundness and accuracy of the opinions and information expressed in this
report. While we consider statements in the report are correct, no liability is accepted for
any incorrect statement or information.

Recommended citation
Taylor, N., Mackay, M. and Russell, K. 2020. Searching for community wellbeing: population,
work and housing in the town of Oamaru. National Science Challenge: Building Better
Homes, Towns and Cities: Ko ngā wā kāinga hei whakamāhorahora (BBHTC). Wellington,
New Zealand. https://www.buildingbetter.nz/research/thriving_regions.html

© 2020 Building Better Homes, Towns and Cities National Science Challenge and the
authors. Short extracts, not exceeding two paragraphs, may be quoted provided clear
attribution is given. Working Papers are research materials circulated by their authors for
purposes of information and discussion. They have not necessarily undergone formal peer
review.

Building Better Homes, Towns and Cities National Science Challenge
Private Bag 50 908            www.buildingbetter.nz
Porirua 5240                  buildingbetter@branz.co.nz
New Zealand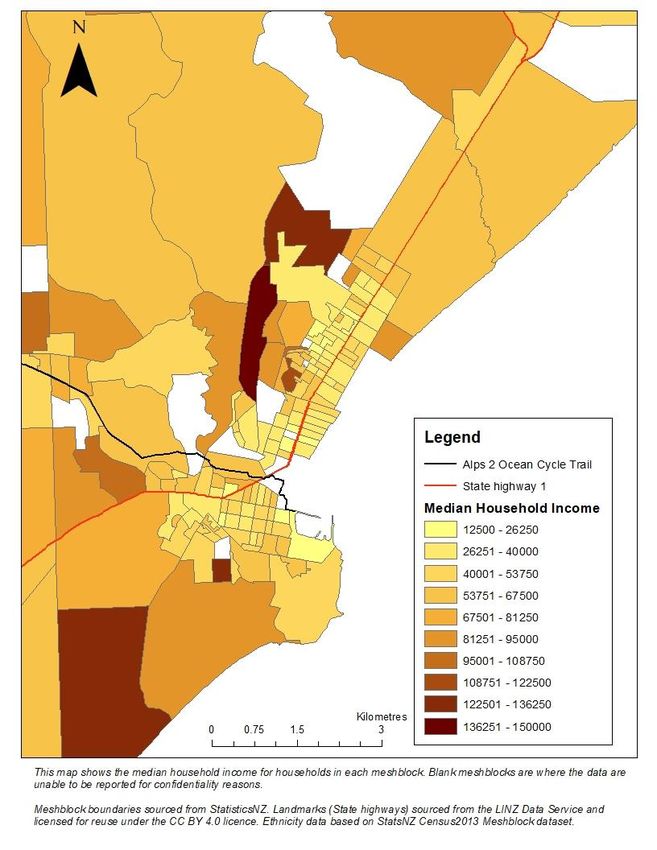
Searching for community wellbeing: population, work and housing
in the town of Oamaru

Working paper

Nick Taylor (Nick Taylor and Associates)

Mike Mackay (AgResearch Limited)

Katherine Russell (Nick Taylor and Associates)

August 2020
Contents
1      Introduction .....................................................................................................................................1
    1.1        Purpose of this working paper.................................................................................................1
    1.2        The Thriving Regions and Communities research programme ...............................................1
2      The Oamaru research - findings from Phase 1 ................................................................................2
    2.1        A change of focus in Phase 2 ...................................................................................................3
3      Lessons from elsewhere ..................................................................................................................4
4      Approach and methods ...................................................................................................................5
    4.1        The research process ...............................................................................................................5
    4.2        The Housing Task Force ...........................................................................................................6
    4.3        Research outcomes..................................................................................................................6
    4.4        Phase 2 research activities and milestones .............................................................................7
    4.5        Spatial issues and the 2018 Census .........................................................................................8
5      The changing population of Oamaru ...............................................................................................8
    5.1        Population of the Oamaru area and Waitaki Valley over time ...............................................8
    5.2        Ethnicity, newcomers and the Pacific population .................................................................10
    5.3        The district workforce and underlying trends in the workforce ...........................................12
    5.4        Social capital ..........................................................................................................................15
    5.5        Education ...............................................................................................................................16
    5.6        Housing ..................................................................................................................................17
    5.7        Household incomes and social-economic status...................................................................21
6      Conclusions – towards a housing strategy ....................................................................................25
References .............................................................................................................................................26
Appendix 1            Census 2018 spatial frame issues ..................................................................................27
1         Introduction
1.1       Purpose of this working paper

The purpose of this paper is to present recent results of the Oamaru case study of the Thriving
Regions Research Programme to the Waitaki Housing Task Force.1 It is a background paper pulling
together information gathered from a literature review, the 2018 census and other secondary data
sources. The information extends that already provided to the Task Force from their recent research
efforts and is designed to complement information that comes out of the housing survey that the
Task Force has underway.2 It is expected that all this information, together, will provide the basis for
an informed district housing strategy as well as for ongoing research by the research programme.

1.2       The Thriving Regions and Communities research programme

The Oamaru Case Study is part of a research programme considering the basis for thriving regions
and communities in New Zealand. The programme is part of the Building Better Homes, Towns and
Cities National Science Challenge (“BBHTC”) Ko ngā wā kaingā hei whakamahorahora. The
programme comprises a set of studies of South Island regions and communities that are attempting
to create positive futures for themselves, while considering issues such as the future of work in rural
areas and provincial towns, the supply of workers, demographic changes and the supply of suitable
housing and social services.

Researchers in the programme are working directly with community stakeholders in selected South
Island regions and settlements as they navigate change, determine their own aspirations, confront
impediments to social wellbeing and search for solutions to local problems through sustainable
pathways. The aim of The Programme is to reveal what practical approaches are most effective at
creating real-world change in different community settings, and document examples where
residents, local governments, community groups, and businesses have collaborated to create
change. The central research questions are as follows.

    I.    How are futures being defined, what strategies are being adopted to create them, and how
          are related plans, programmes and activities resourced and supported?

    II.   What do community leaders, councils, organisations and agencies, mana whenua groups,
          and Māori organisations need in order to develop strategies that support the capacity and
          capability of their communities to adapt to future challenges and thrive?

The research programme selected three ‘second-tier’ regional settlements in the South Island,
Ashburton, Timaru and Oamaru, which have populations in the range 10,000 to 30,000 and support
hinterlands of rural areas and small country towns. The opportunities and challenges for these
second-tier settlements differ from those facing our largest cities as they represent populations that
hold fewer formal credentials and offer lower wages. They are part of areas that tend to have
economic bases emphasising primary production and processing and services to agriculture as well

1 The research team gratefully acknowledge funding from the Building Better Homes, Towns and Cities
National Science Challenge. We appreciate the collaborative approach taken by Helen Agar and Shirley Bee of
Safer Waitaki, the Waitaki Housing Task Force and community members, and the useful comments and
suggestions from Cilla Taylor.
2 The research team has had an input to the survey design.

                                                     1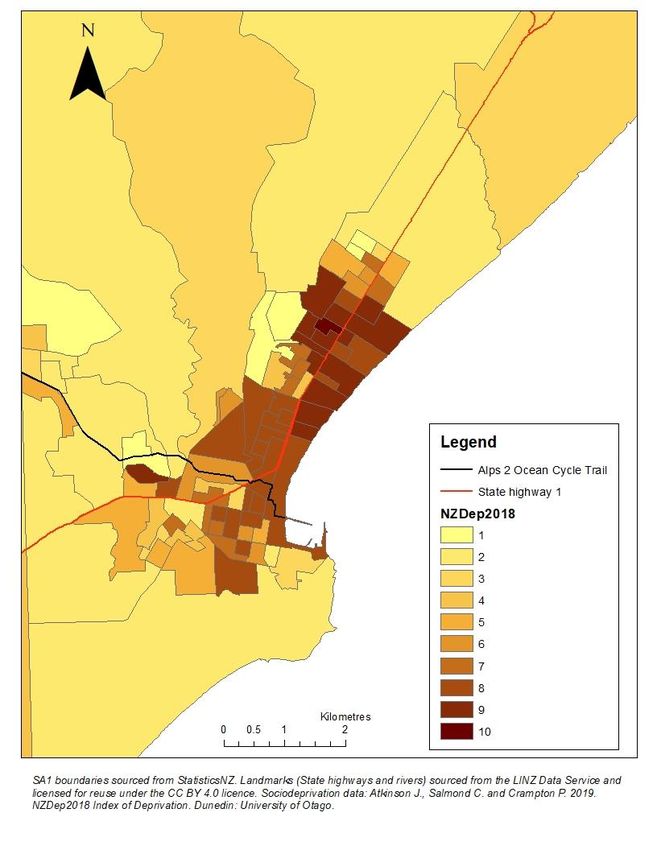
as active visitor sectors. There are fewer benefits of agglomeration than found in larger cities
(Perkins et al., 2019).

In Phase I we made good progress considering the elements for success in economic regeneration in
regional centres and how these elements of success can be encouraged. We have studied and
worked alongside stakeholders who are attempting to meet their local needs and improve the
situations in regional settlements in the South and North Islands (Perkins et al., 2019).

Our research into economic regeneration in these three towns found that in addition to their shared
characteristics they each have particular economic histories and geographical contexts (Perkins et
al., 2019). What has become apparent is the great variation in the ways that regional settlements
experience social, cultural, environmental and economic change, and the capability and resources
they have to manage change.

Additionally, and adding another layer of complexity, some settlements and regions display rapid
growth, others stasis and a number decline. What is apparent through the research programme is
that the stakeholders in regeneration in these settlements require research and other forms of
support to help them develop and establish thriving places and sustainable future pathways. So, the
success and decline of regional settlements is proving challenging, and raising important research
and policy questions:

    I.    What does a well-supported, self-sustaining and innovative regional regeneration
          framework look like and what are the best ways to institute and support such a programme?

    II.   How can we integrate improved social, economic, cultural and environmental outcomes,
          including employment, housing and social services, in ways that support people and their
          diversifying communities, now and into the future?

2         The Oamaru research - findings from Phase 1
Oamaru has an economy in the surrounding Waitaki District based on agricultural servicing,
secondary agricultural processing and tourism. The town is a settlement experiencing moderate
growth and a changing demography associated with an aging population and the in-migration of
workers from countries such as Tonga. Housing issues are evident and a housing taskforce has been
established. Also evident is the work of social entrepreneurs leading community initiatives in local
government, community development, heritage preservation, landscape enhancement, economic
diversification and social services.

In Phase one of the research, the Oamaru case study provided an analysis of Oamaru’s past, present,
and future initiatives for regeneration. It asked the essential question: How did Oamaru become an
attractive place to live, visit, work and do business? The initial findings were focused on three
ongoing and interrelated sets of initiatives evident since the town and district experienced a period
of marked economic decline and population loss in the 1980s.

The first set of initiatives is focused on urban renewal, heritage conservation and employment
generation. This set is local in nature and proved fundamental to the initial momentum of
regeneration. The initiatives are associated with planning and implementing regeneration of the
Victorian heritage precinct of Oamaru stone buildings in the harbour area and along the main street,

                                                   2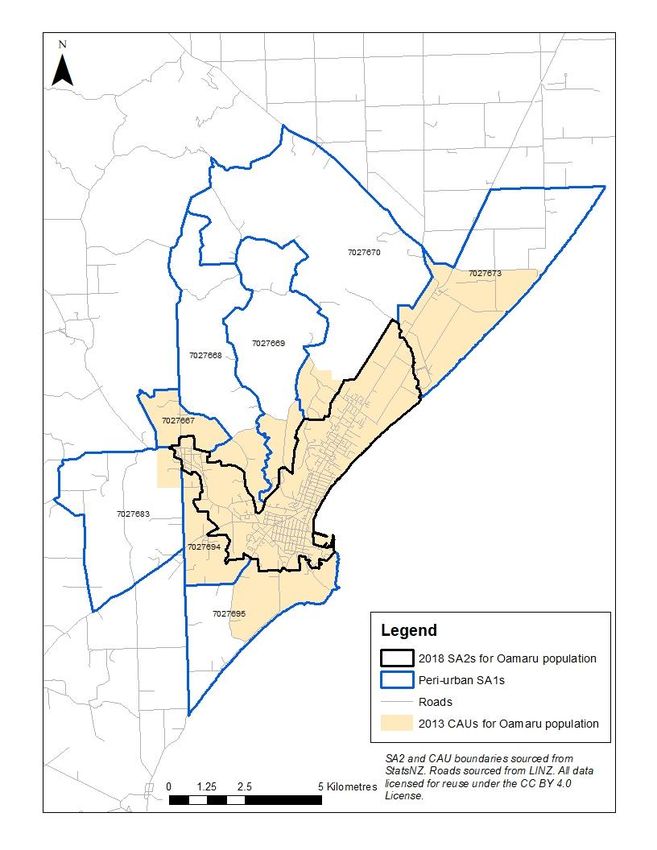
the eco-tourist attraction of the blue-penguin colony and visitor centre, and rejuvenation of the
waterfront area. Property development is a focus, such as rehabilitating former industrial spaces or
public facilities for reuse and new commercial uses such as retail or cafes. Plus there is construction
of new facilities and spaces for interaction such as playgrounds and parks, a children’s bike park,
new road access and waterfront amenities. Environmental and heritage conservation in the area
leverages natural and built amenities through public and private investment, and community effort.

The second set of initiatives is based around the Alps to Ocean (A2O) cycle trail, part of the New
Zealand Cycle Trail, initiated and organised by local groups, councils, the Department of
Conservation, Meridian Energy and local businesses. The trail, running from the mountains down
the Waitaki to Oamaru, presents many opportunities for rural businesses along it, as well as for the
hospitality sector in Oamaru.

The third set of initiatives is broadly involved with the current Geopark proposal led by the Waitaki
District Council in conjunction with partners including Ngāi Tahu, University of Otago, Vanished
World and others. The Geopark began as a local and then district initiative, then upscaled over the
last year as the New Zealand proposal put forward for formal recognition by UNESCO.

Key factors in success of these initiatives include: amenity and attractiveness; heritage, convenient
location and natural features; proximity to a range of attractions and transport corridors; and the
capacity to plan and implement regeneration. A range of organisations and leadership broadens the
base of local capacity to drive initiatives, along with a proactive local council. Influential local people
or pressure groups, political will, contributions from central government, planning and governance
arrangements are all important.

Finally, the research is considering the underlying challenges that thriving communities must
address. They must plan for and respond to cycles of decline (and growth) that are always present in
communities with an economic base in natural resources, including primary production and
processing and the visitor sector. Recovery from the Covid-19 lockdown is just one example of the
ways the resilience of regional communities is tested, alongside economic crashes and natural
disasters (droughts, storms and earthquakes). Technological changes offer many opportunities that
have to be grasped. There are also changes in demographics, with an ageing population and
increasing cultural diversity in the population.

2.1     A change of focus in Phase 2

The first phase of the research revealed important questions for this next phase of the research.

During Phase I of BBHTC, the research team had an active engagement with key people in Oamaru,
including the District Council (Mayor, CEO and senior staff), and people active in strategic thinking
about the future of work and housing and associated cultural issues in the town and District. Of
particular interest to the ongoing research was our interaction with the Safer Waitaki project, a
“whole-of-community project with a focus on community safety” including community health and
well-being. Useful ideas for further research also emerged from community leaders thinking about
the future of work and housing issues, and the wellbeing of the large migrant community of Pacific
Islanders (mainly Tongans) in Oamaru, and other migrant workers engaged in primary production
and processing.

                                                     3
The Phase I research and discussions with community stakeholders identified several new priority
research questions to address over the current two years of the programme (2019-2021):

    I.    How is the wellbeing of the people of Oamaru related to the availability of different types of
          work, housing and social services?

    II.   How well are newcomer residents, with skills and social capital, integrated into the capacity
          of the community to adapt to future challenges and inevitable shocks from external forces
          and events?

 III.     How well is a significant new group, such as the Tongan workers and families in the town,
          positioned in terms of work, affordable housing and culturally appropriate services?

3         Lessons from elsewhere
As part of this repositioning of the research programme an annotated bibliography and summary
literature review was prepared in support of the Oamaru case study and other research in the
Thriving Regions research programme of BBHTC (Wilson et al., 2020). The focus of the literature
review on strategic thinking about newcomers and their families necessitated a better
understanding of the future of work, housing and culturally appropriate services and the lessons
from elsewhere that assist the research team to address these issues.

“The material reviewed was broadly focused on rural community transformation and on a range of
issues associated with the attraction, integration and retention of immigrants in rural communities.
The bibliography therefore presents a review of material on a range of topics associated with
immigrant populations and their attraction to and retention in (mainly) rural areas and small towns,
including: acculturation; refugee relocation and settlement; labour migrants; the provision of
community support services; immigrant organisations; immigrant and immigration discourse; rural
housing; rural community transformation and revitalisation; and community resilience” (Wilson et al.
page 2).

Some of the key findings from the literature review are as follows:

The reality of successful integration is the ability of a newcomer to participate fully in their new
community. Many rural communities host multiple cultures, often with migrant workers from
several different countries and cultures, as is the case in Oamaru. Some of these new residents are
looking to settle permanently, others are more transient, driven by shorter-term opportunities to
work. Therefore, internationally, the focus of “integration” has shifted to an understanding of
multiculturalism and the needs of a complex mix of newcomers. This shift reflects the shift from a
strategy of assimilation to one recognising the social development needs for multiple groups of
residents.

In order to develop appropriate strategies it is important to be able to differentiate sub groups in the
population. Ethnicity remains a useful, basic descriptor but it is also important to recognise
differences within and between immigrant groups and the host community. These differences can
range from basic needs such as housing, to styles of work, recreation activities and participation in
other community activities. The predominance of labour migration in rural areas and communities
for work in sectors such as agriculture, manufacturing and tourism, necessitates an understanding of
the length of residence and the issues of “transience” in particular.
                                                    4
The relationships between newcomers and longer-standing residents will depend on the past
experiences a community has of migrant workers and the integration of newcomers into community
life. Types of work and work schedules, location (dispersal verses concentration), housing status,
age, family types, and participation in education and in leisure activities can all influence how well
newcomers are integrated into the new place.

The available research also shows that it is important to understand the community context that
migrants are now part of. The size of the settlement, its infrastructure, services and “social milieu”
are all important factors. Migrants may be focused in particular places in the community, for
housing, work, services, community activities and leisure. Initiatives to ensure that they can play a
full part in community life are important to community well-being as a whole. These include
educational initiatives in particular.

The provision of affordable housing is an important focus for many groups supporting migrant
populations. Rental housing is an important aspect of housing and there are many reports of
overcrowded, or otherwise substandard housing. The vulnerability of migrant families is increased
by their lack of knowledge of rights and available support services. The provision of housing for very
transient workers such as seasonal workers, or short-term construction workers, is a particular issue
in many places.

Overall, support for immigrant populations needs to be community driven and broad based –
involving a range of stakeholders. Action plans can include support for particular groups of
immigrants and often includes support for work such as specific training needs, as well as for
housing and adequate social services. The literature review provides a strong basis for developing a
strategic approach to welcoming communities, especially in the face of new challenges such as the
impacts of Covid-19 on workplaces and employment.

4       Approach and methods
4.1     The research process

The research process over phases one and two has emphasised co-construction of knowledge and a
mixed method approach to evaluation and social impact assessment, building a deep understanding
of the multifunctional Oamaru economy and issues around work, housing and social wellbeing. In
the current phase, we are continuing this approach utilising a mixture of quantitative data, mapping
(2018 census data, business frame data, sector-specific data) alongside qualitative methods such as
semi-structured interviews, small group discussions and hui, family work and housing histories, and
workshops.

The research places emphasis on building relationships with the Council, local runaka, ethnic
communities, community organisations and social entrepreneurs to build on and test the research
questions, and to identify opportunities for feasible changes in development policies, strategies and
investments.

The co-production of knowledge provides for the design and adaptation of opportunities and
investments to support future work and housing in Oamaru and associated social services. The
combined information is for use of community leaders, and a core group of local regeneration

                                                   5
leaders, including housing and social services stakeholders and providers (eg, Waitaki District
Council, Te Rūnanga o Moeraki, Te Whare Koa Community Marae, Safer Waikiki, the Waitaki
Housing Task Force, Waitaki Newcomers Network, Waitaki Multicultural Council and cultural groups)
to:

  I.    Assist with identification and resolution of issues relating to the supply of affordable, healthy
        and culturally appropriate housing for vulnerable groups in the community, including
        transient workers, and those on low incomes and currently living in costly, overcrowded or
        otherwise inappropriate conditions.

  II.   Identify and plan for opportunities to skill new and emerging workers, re-skill and up-skill
        existing workers, and attract suitably skilled newcomers to the various forms of work
        generated by a multi-functional economy through economic cycles.

 III.   Develop strategies that support the community’s capacity and capability to adapt to
        challenges around the future of work and housing.

4.2     The Housing Task Force

The Waitaki Housing Taskforce (WHT) is a community based group convened by Safer Waitaki to
address housing issues in the District. The Taskforce brings together a number of organisations to
identify and address housing needs through development of a housing strategy. These include
Waitaki District Council, Safer Waitaki, MSD, WINZ, Kainga Ora, Corrections, Methodist Mission, PSS
and local real estate agents. The research team were invited to join the Taskforce and have
attended recent meetings in person and by Zoom.

Leon de la Barra (2020), a statistician, has prepared a summary of secondary data relating to the
population and housing of the District for the Taskforce. This working paper builds on and
supplements that information, and results from the analysis and mapping of secondary data were
presented to a Task Force meeting in February this year.

The taskforce have also developed a community survey that was ready to implement prior to the
Covid 19 lockdown and is now underway with the reduction to Level 1 Alert.

At a recent meeting held by Zoom the Taskforce discussed Covid 19 and impacts of the shutdown on
the local economy, work, welfare and housing. The research team presented results of the literature
review (Section 3 above) to this meeting.

There are plans to convene a housing strategy workshop once the survey is completed. This working
paper is written in order to provide additional information to the Taskforce and an informed basis
for their strategic thinking.

4.3     Research outcomes

Collaboration between the research team and the WHT is a practical example of the research
approach that aims to co-produce knowledge with the people and stakeholders who can use it. In
this way the research helps to provide for the design of new opportunities and investments and
adjustments to existing ones, supporting future work and housing in Oamaru, and associated social
services. This information will be used by the research community to:

                                                   6
• identify and plan for opportunities to skill new and emerging workers, re-skill and up-skill
existing workers, and attract suitably skilled newcomers to the various forms of work
generated by a multi-functional economy
• assist with identification and resolution of issues relating to the supply of affordable, healthy
and culturally appropriate housing for vulnerable groups in the community, including those
on low incomes and currently living in costly, overcrowded or otherwise inappropriate
conditions.
• Develop strategies that support the community’s capacity and capability to adapt to future
challenges.
An important additional outcome is the contribution of the research programme to further
understanding what makes thriving regions in Aotearoa New Zealand, and how to support the
regions through an improved base of knowledge and particular tools such as social impact
assessment and programme evaluation. In turn, research in Oamaru benefits from the research and
lessons gained from other parts of the country.
4.4 Phase 2 research activities and milestones
In Phase 2 Year 1 we carried out the following activities:
• Exploratory discussions with stakeholders engaged in community issues around the future of
work and housing, focusing on population change, newcomer groups and housing issues
• Joining discussions with Safer Waitaki and the Housing Taskforce, including a presentation to
the Housing Taskforce.
• A preliminary paper circulated to the Housing Taskforce, Safer Waitaki and Waitaki District
Council on spatial issues with the 2018 Census (this information is incorporated in this
current working paper and Appendix 1)
• Analysis of secondary data emphasising results of the 2018 census that came available over
the first year.
• Write this draft working paper based on these initial investigations – for feedback and
discussion with research stakeholders and participants
• Present results from the research to the conference of the Agrifoods Research Network and
to the conference of the International Regional Studies Association (available on the BBHTC
website).
In Phase 2 Year 2 (from July 2020) we expect to:
• Finalise and publish this working paper on the research.
• Conduct interviews with stakeholders (not possible during the Covid 19 lockdown) to gain an
in-depth understanding of issues for the housing market and migrant workers.
7• Take part in a strategic planning workshop with district stakeholders to help formulate a
district housing strategy.
• Contribute to a workshop to discuss findings across the South Island research projects.
• Make an input to other conferences and published papers on the research.
4.5 Spatial issues and the 2018 Census
This working paper considers the Waitaki District, the town of Oamaru, the periurban area around
Oamaru and the towns of the Waitaki Valley. The research has considered the Valley in order to
obtain an understanding of part of the rural hinterland of the town. The Valley was also a focus for
the first phase of the research on economic development initiatives (Mackay, et al. 2018).
In December 2017, Statistics NZ released the Statistical Standard for Geographic Areas 2018, which
replaced the 1992 New Zealand Standard Areas Classification. The most significant change was the
creation of new geographic boundaries that are used for the 2018 census. It was important to
define these areas before undertaking more detailed analysis of 2018 census data. Further
information and maps of statistical areas are provided in Appendix 1.
To obtain a longer-term time series for the population of the towns and area, it was necessary to
identify the revised f geography of each town to ensure the population figures for each subsequent
census were from the same area. 3 Given the complexities, and costs, of obtaining the data in
consistent geographies, the usually resident population of the towns may differ slightly to the
numbers of respondents presented for other variables. 4
5 The changing population of Oamaru
5.1 Population of the Oamaru area and Waitaki Valley over time
Table 1 shows the usually resident population of the District, Oamaru and environs in the last three
censuses, showing a change of plus 8.9% for Oamaru and 10.3% for the District from 2006 to 2018.
This growing population of Oamaru over recent years is in contrast to the decline in population from
1986 to 20065 and is creating a demand for additional housing. Also noticeable is strong growth in
the population of peri-urban areas of Oamaru indicating a demand for rural lifestyle living (refer to
map in Appendix 1, Figure 7). This growth in the population indicates that the District has a
relatively strong economy that has keep people living and working there.
Table 1: Usually resident population of Oamaru 2006–18
Area 2006 2013 2018 Change 2006–18 % Change 2006–18
Oamaru 12,036 12,306 13,107 1,071 8.9%
Per-urban Oamaru 1,056 1,197 1,386 330 31.3%
3 There were some very small differences over time in the maps used by Statistics NZ. The areas were
reconciled to obtain a time series consistent with the 2018 maps.
4 Comparisons of the usual residents totals (table 1) should not be made with other census 2018 tables.
5 Based on the old census boundaries.
8Waitaki District 20,223 20,829 22,308 2,085 10.3%
However, not only is the population growing but it is changing in three important ways. There is an
increasing number of newcomers, particularly Pacific Islanders, an increasing proportion of elderly
and an increasing number seeking rural living close to town. As discussed below, these groups have
particular household characteristics and housing needs.
Also important to understanding the demand for housing is the composition of the households in
the area. Table 2 provides this data for Oamaru and the District as a whole. In Oamaru there is a
relatively low proportion of couple only households and also a low proportion of households with
children. There is a high proportion of single-person households, confirming the presence of a large
number of elderly (discussed further below). There are very few multiple family households
recorded in the 2018 Census.
Table 2: Household composition, census 2018
Oamaru Waitaki Total
Total District NZ
# 1,671 2,943
Couple only
% 31% 33% 26%
Couple only and other # 78 129
person(s) % 1% 1% 3%
# 1,104 2,076
Couple with child(ren)
One-family household (with or % 21% 23% 27%
without other people) Couple with child(ren) and # 48 75
other person(s) % 1% 1% 3%
# 441 579
One parent with child(ren)
% 8% 6% 9%
One parent with child(ren) and # 51 72
other person(s) % 1% 1% 2%
# 6 6
Two 2-parent families
% 0% 0% 0%
One 2-parent family and a 1- # 3 9
Two-family household (with or parent family % 0% 0% 0%
without other people) # 6 9
Two 1-parent families
% 0% 0% 0%
# 42 78
Other 2-family household
% 1% 1% 2%
# 6 3
Three or more family household (with or without other people)
% 0% 0% 0%
# 24 39
Household of related people
% 0% 0% 1%
Household of related and # 3 6
Other multi-person household
unrelated people % 0% 0% 0%
# 141 237
Household of unrelated people
% 3% 3% 4%
# 1,746 2,646
One-person household
% 33% 30% 23%
Total households stated # 5,364 8,910
Notes: StatsNZ rate this variable as moderate quality. Currently only SA2 data are available for this
variable; if SA1 data become available this table will be updated to include Oamaru peri-urban area and
towns of the Waitaki valley.
95.2 Ethnicity, newcomers and the Pacific population
Table 3 shows the ethnic makeup of the population as in the 2018 census. The data confirm
anecdotal information about the emerging importance of a Pacific Island (mainly Tongan) population
in Oamaru working in meat processing and other manufacturing sectors (Taylor et al. 2019). This
table indicates that the Pacific Island population is very strongly focused in the town of Oamaru,
much more so than in the peri-urban areas of Oamaru or the rural towns of the valley, although as a
proposition of the population (6%) it is still less in Oamaru than New Zealand as a whole (8%).
The background information compiled by the WHTF statistician, Leon de la Barra (2020) shows that
the number of Pacific Islanders in the population increased at least four fold from 129 in 2001 and
numerous anecdotal reports confirm the rapid increase in this part of the population. 6
Māori are an important group in the District and Oamaru (8% of those usually resident). There is
also an Asian population (5%) that has increasing importance in the town and District, including in
the dairy farming sector.
Table 3: Ethnicity for the usually resident population, census 2018
Pacific Other
European Māori Asian MELAA Total
Town Peoples Ethnicity
stated
# % # % # % # % # % # %
14
Omarama 228 78% 12 4% - 0% 42 - 0% 3 1% 291
%
Otematata 162 89% 15 8% 3 2% 12 7% - 0% - 0% 183
13
Kurow 342 92% 48 - 0% 15 4% 3 1% - 0% 372
%
Duntroon 90 94% 6 6% - 0% 6 6% - 0% - 0% 96
1,0
Oamaru 11,394 87% 8% 786 6% 621 5% 51 0% 15 0% 13,107
68
Oamaru
1,332 96% 87 6% 3 0% 27 2% 3 0% - 0% 1,386
Peri-urban
Waitaki 1,8 1,1
19,641 88% 8% 858 4% 5% 114 1% 21 0% 22,308
District 24 85
17 15
NZ total 70% 8% 1% 0%
% %
Notes: StatsNZ assesses this variable as high quality and the 2018 Census External Data Quality Panel
assesses this variable as moderate quality.
MELAA = Middle Eastern / Latin American / African. Other Ethnicity does not include 'New Zealander'.
Respondents can record more than one ethnicity therefore percentages do not add to 100%.
6 https://www.tvnz.co.nz/one-news/new-zealand/oamaru-fast-becoming-most-polynesian-town-in-nz-just-
feels-like-tonga
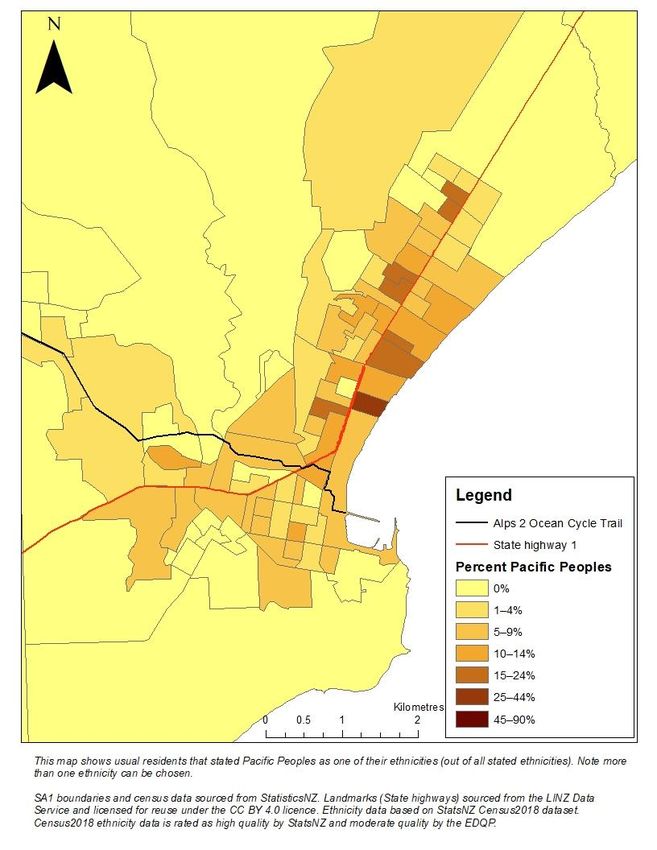
10Figure 1 shows that the Pacific Island population is spread around the town but concentrated north
of the town centre, either side of SH1.
Figure 1: Pacific people in Oamaru % of UR Population by SA1, 2018
11Table 4 provides information on the birthplaces of the usually resident population of the area,
distinguishing those who are born in New Zealand from those born overseas. This breakdown gives
a quick perspective on the likely social and cultural diversity of the population. It can be seen that
the population of the District has a considerably higher proportion of people born in New Zealand
(84%) than overseas (16%) and this is very strongly the case for the per-urban area. Omarama (26%)
and Otematata (23%) have the highest proportion born overseas (closer to the national figure of
27%). By way of comparison, the tourist town of Tekapo in Mackenzie District has a very high
proportion of people born overseas (56%), reflecting the changing social make up of tourism
communities.
Table 4: Birthplace for the usually resident population, census 2018
NZ born Overseas born
Town Total stated
# % # %
Oamaru 10,917 84% 2,058 16% 12,978
Oamaru Peri-urban 1,254 91% 135 10% 1,374
Omarama 204 73% 72 26% 279
Otematata 132 77% 39 23% 171
Kurow 324 88% 42 11% 369
Duntroon 81 84% 12 13% 96
Waitaki District 18,651 84% 3,426 16% 22,077
NZ total 73% 27%
Tekapo 237 44% 303 56% 537
Note: StatsNZ and the 2018 Census External Data Quality Panel assess this variable as high quality.
5.3 The district workforce and underlying trends in the workforce
Nearly half of the District workforce (47%) is engaged in full time work, a little less than New Zealand
as a whole (50%) and the level of unemployment is low (
12Table 5). An interesting aspect of the labour force is the low level of full time employment in
Oamaru (41%) verses the national figure (50%) and 47% for the District.
Another feature is that for Oamaru and some of the valley towns, particularly Kurow, there is a high
proportion of those aged 15 plus who are not engaged in the workforce. The primary factor in this
lack of engagement with the labour force is most likely retirement, given the high proportion of
elderly in these places.
13Table 5: Work and labour force status for the usually resident population aged 15 years and over, census
2018
Employed Full Employed Part Not in the
Unemployed Total
Town time time Labour Force
stated
# % # % # % # %
Omarama 159 61% 42 16% - 0% 60 23% 261
Otematata 87 51% 24 14% - 0% 63 37% 171
Kurow 126 40% 51 16% 6 2% 141 44% 318
Duntroon 36 46% 15 19% 3 4% 27 35% 78
Oamaru 3,927 41% 1,434 15% 273 3% 3,945 41% 9,573
Oamaru Peri-urban 579 52% 189 17% 12 1% 321 29% 1,104
Waitaki District 8,529 47% 2,826 15% 441 2% 6,441 35% 18,237
NZ total 50% 15% 4% 31%
Note: StatsNZ and the 2018 Census External Data Quality Panel assess this variable as moderate quality.
The top twelve sectors that workers in the district are engaged in are shown in Table 6. Across the
District the Agriculture, Forestry and Fishing sector has the most jobs, followed by manufacturing
and then Construction. In Oamaru town, Manufacturing and Retail Trade are important sectors and
in the valley towns of Omarama and Otematata the Accommodation and Food Services sector stands
out, confirming a strong tourism base. In Otematata, Construction is also important indicating the
original purpose of this town remains part of its economy. Kurow and Duntroon have a strong base
in the Agriculture Forestry and Fishing sector. Together the Oamaru urban and peri-urban area has a
diverse economic base and provides nearly two thirds (62%) of the District’s jobs.
14Table 6: Industry by usual residence address for the working population, census 20187
Oamaru Waitaki
Town Omarama Otematata Kurow Duntroon Oamaru NZ total
Peri-urban District
Agriculture Forestry # 24 12 42 18 252 147 2,034
and Fishing % 12% 11% 25% 35% 4% 19% 18% 6%
# 6 - 6 3 1,116 84 1,434
Manufacturing
% 3% 0% 4% 6% 18% 11% 13% 10%
# 15 24 21 3 540 78 909
Construction
% 7% 22% 12% 6% 9% 10% 8% 9%
# - - 3 6 546 51 777
Wholesale Trade
% 0% 0% 2% 12% 9% 7% 7% 5%
# 30 6 9 3 771 72 1,095
Retail Trade
% 15% 5% 5% 6% 12% 9% 10% 9%
Accommodation and # 63 24 15 6 477 30 861
Food Services % 31% 22% 9% 12% 8% 4% 8% 7%
Transport Postal and # 6 3 9 - 162 36 339
Warehousing % 3% 3% 5% 0% 3% 5% 3% 4%
Professional Scientific # 6 3 3 3 270 51 468
and Technical Services % 3% 3% 2% 6% 4% 7% 4% 10%
Public Administration # 6 - 3 - 222 18 327
and Safety % 3% 0% 2% 0% 4% 2% 3% 5%
# 15 3 21 3 399 48 648
Education and Training
% 7% 3% 12% 6% 6% 6% 6% 8%
Health Care and Social # 6 6 12 3 636 42 912
Assistance % 3% 5% 7% 6% 10% 5% 8% 9%
# 3 9 9 3 231 24 393
Other Services
% 1% 8% 5% 6% 4% 3% 3% 4%
Total stated 201 111 171 51 6,222 777 11,355
7 This table shows the top 12 industries (out of a total 19) for the total Waitaki District.
155.4 Social capital
In addition to paid work, unpaid work (Table 7) is an important part of the social make-up of the
population and helps to indicate the level of social capital present – often measured by the level of
voluntary activity in a population. Social capital enriches communities and strengthens their ability
to develop a collective response to solving problems (Taylor and Goodrich, 2011). The level of social
capital is influenced by the factors such as the age of the population and the presence of
newcomers. When there is a high proportion of people aged over 65, as is the case in Oamaru, then
this can boost the people available for voluntary work
Table 7: Unpaid activities, census 2018
Helping
Household Other
someone
activities Looking helping or
who is ill or
including after a child voluntary
has a
No looking after who does work for or
disability Total
Town activities a household not live in through any
who does stated
member own organisation
not live in
(child or household , group or
own
ill/disability) marae
household
# % # % # % # %# %
14 105 14
Omarama 27 204 27 15 8% 42 22% 195
% % %
12 100 18
Otematata 18 153 27 12 8% 30 20% 153
% % %
17 106 13 11
Kurow 45 276 33 30 48 18% 261
% % % %
118 18
Duntroon 3 5% 78 12 3 5% 15 23% 66
% %
1,08 12 10,71 116 1,37 15
Oamaru 870 9% 1,623 18% 9,231
0 % 6 % 7 %
Oamaru Peri- 10 126 19 10
99 1,236 183 99 195 20% 984
urban % % % %
1,74 11 18,42 118 2,28 15 1,42 15,61
Waitaki District 9% 2,847 18%
3 % 0 % 9 % 5 8
12 122 14
NZ total 8% 15%
% % %
Note: StatsNZ assess this variable as poor quality and the 2018 Census External Data Quality Panel did not
assess this variable. People can state more than one response, hence percentages for household activities
(a combination of 3 categories) can be >100%.
165.5 Education
Table 8 provides information on school rolls for Oamaru and Valley areas over 10 years. Some
schools in Oamaru have lost pupils in this period, especially Oamaru North, St Joseph’s, and Waitaki
Girls and Boys. Others have gained pupils, especially Ardgowan, Fenwick and Pembroke in the urban
and peri-urban area, and Papakaio, where there is a gain from the presence of dairy farm workers.
Table 8: School rolls 2010–2019 (Source MoE)
Change
2010 2011 2012 2013 2014 2015 2016 2017 2018 2019
2010–2019
Twizel Area School 185 183 186 187 183 204 208 201 205 219 34
Ardgowan School 64 63 75 118 122 127 143 150 177 165 101
Duntroon School 62 75 75 61 70 79 70 70 86 91 29
Fenwick School 262 256 265 274 286 279 292 307 302 327 65
Oamaru
295 282 286 259 295 309 283 276 260 296
Intermediate 1
Oamaru North
169 160 156 148 128 118 106 89 74 76
School -93
Omarama School 28 23 38 33 35 35 40 37 48 43 15
Papakaio School 101 102 118 120 136 127 140 143 142 140 39
Pembroke School
228 229 216 229 224 260 268 269 269 276
(Oamaru) 48
St Joseph's School
184 227 220 213 220 225 233 200 196 167
(Oamaru) -17
St Kevins College
430 411 415 405 401 419 451 445 453 449
(Oamaru) 19
Totara School 56 51 57 59 43 40 35 38 40 43 -13
Waitaki Boys' High
482 498 507 520 510 469 459 440 431 399
School -83
Waitaki Girls' High
415 412 400 441 422 409 416 430 406 402
School -13
Waitaki Valley School 92 96 105 105 114 107 102 115 115 105 13
Weston School 220 202 209 213 219 221 231 239 236 234 14
Figure 2 provides information on the presence of pupils indicating Pacific Islands ethnicity in the
schools listed in 2009 and 2019. Growth in the proportion of Pacific Islands pupils is most obvious
for Oamaru North School, Pembroke and Oamaru Intermediate, confirming the presence of Pacific
Island families in the northern areas of Oamaru urban.
17Figure 2: Oamaru schools by percent pupils with Pacific Island ethnicity
5.6 Housing
Information on dwelling ownership of households in 2018 is provided in Table 9. Across the District,
the level of home ownership is relatively high (72%) compared with the country as a whole (65%).
Home ownership is also high (72%) in Oamaru and strikingly high (91%) for the peri-urban area.
Table 9: Dwelling ownership of households, census 2018
Total owned Dwelling not owned and not held in a family trust
Town Total stated
# % # %
Omarama 72 65% 36 32% 111
Otematata 66 69% 30 31% 96
Kurow 120 73% 45 27% 165
Duntroon 27 69% 15 38% 39
Oamaru 3,957 72% 1,509 28% 5,463
Oamaru Peri-urban 444 91% 45 9% 489
Waitaki District 6,606 72% 2,556 28% 9,168
NZ total 65% # 35% #
Note: StatsNZ and the 2018 Census External Data Quality Panel assess this variable as moderate quality.
Figure 3 shows that at the time of the 2018 census the percentage of households not privately
owned, and therefore renting, was concentrated to the north of the CBD, along SH 1, in an area
north of the centre of town, and around the historic precinct (where absolute numbers are low).
18Figure 3: Oamaru percentage rental housing by SA1, 2018
19Further insight into housing is provided by data on dwelling occupancy (Table 10). The level of
unoccupied dwellings (residents away) is noticeably high for the Valley towns and Omarama in
particular) and generally low in Oamaru and Oamaru peri-urban – close to the national figure of 5%.
The number of unoccupied (empty) dwellings is very low in Oamaru and Oamaru peri-urban,
suggesting there is little flexibility in this housing market. On the other hand the number of
unoccupied (empty) dwellings in Otematata is exceptionally high and also relatively high in Kurow
and Duntroon.
The data compiled by Sophia Leon de Barra (2020) shows that across the District total unoccupied
dwellings rose a little as a proportion of total dwellings between 2001 and 2018, from 16.1% to
18.8%.
Table 10: Dwelling occupancy, census 2018
Unoccupied Unoccupied Dwelling
Occupied Total
dwelling – dwelling – under
Town dwelling dwellings
residents away empty dwelling construction
# % # % # % # #
Omarama 123 39% 171 54% 18 6% 318 3
Otematata 111 23% 93 20% 264 56% 474 6
Kurow 177 73% 27 11% 36 15% 243 -
Duntroon 42 78% 6 11% 9 17% 54 -
Oamaru 5,556 92% 297 5% 201 3% 6,069 9
Oamaru Peri-urban 498 94% 21 4% 12 2% 531 3
Waitaki District 9,411 81% 1,137 10% 1,053 9% 11,643 45
NZ total 1,673,880 89% 98,664 5% 97,842 5% 1,886,517 16,128
Note: StatsNZ and the 2018 Census External Data Quality Panel did not assess the quality of this variable.
Further information on rental housing and Airbnb is available in a complementary working paper on
Waitaki Short and Long-Term Rental Accommodation,
20Table 11 provides data on rental prices for Waitaki District and Mackenzie District for comparison.
To build this annual time series the 1 March figure is used. Over a 20 year period, rents have
increased steadily and almost tripled (rising 2.7 times) in the Waitaki District. In Mackenzie District
they increased even more and have been more volatile. In the same period, mean national rentals
increased a little less from $209 to $504 (2.4 times) and remain well above the District level.
Table 11: Mean rents for March 2000–2020 (based on rental bonds lodged with MBIE)
Mackenzie District Waitaki District
1/03/2000 $83.00 $109.00
1/03/2001 NA $110.00
1/03/2002 NA $113.00
1/03/2003 $132.00 $124.00
1/03/2004 $113.00 $140.00
1/03/2005 NA $142.00
1/03/2006 $143.00 $159.00
1/03/2007 $134.00 $174.00
1/03/2008 $198.00 $183.00
1/03/2009 $211.00 $211.00
1/03/2010 $268.00 $212.00
1/03/2011 $198.00 $211.00
1/03/2012 $247.00 $219.00
1/03/2013 $214.00 $229.00
1/03/2014 $329.00 $228.00
1/03/2015 $284.00 $240.00
1/03/2016 $273.00 $243.00
1/03/2017 $230.00 $275.00
1/03/2018 $299.00 $262.00
1/03/2019 $302.00 $300.00
1/03/2020 $325.00 $290.00
The mean rents are sourced from The Ministry of Business, Innovation
and Employment (MBIE) and licensed for use under the Creative
Commons Attribution 3.0 New Zealand License.
21In recent years house values have increased by 43% (Table 12).
Table 12: Residential house values at March 2016–2020
Change in
Average Average Average Average Average
value
value value value value value
(2016–
March 2020 March 2019 March 2018 March 2017 March 2016
2020)
Waitaki District $336,304 $322,392 $303,914 $261,295 $235,861 42.60%
Mackenzie
$570,930 $511,505 $523,181 $449,520 $344,297 65.8%
District
House values are sourced from qv.co.nz.
Sophia Leon de Barra (2020) has provided information on social housing in the District. The District
Council owns 91 community housing units, having sold 17 units in 2010 as they did not suit demand.
Turnover is very low but they receive 20-15 applications per annum. MSD have one house for
transitional purposes. They maintain a social housing register and in F2019 had 18 applications for
the social housing register. In the same year they provided Accommodation Supplements to 1,101
recipients averaging $65 per weekly. Other temporary and emergency grants are made by MSD. At
the HTF meeting in May, during the Covid 19 lockdown, MSD noted there was a noticeable increase
in applications for assistance with basic needs including housing over the previous year. Social
service providers noted concerns about hardship due to lost jobs and spiralling levels of debt.
Further data on levels of unemployment, economic hardship and benefit payments should be
available later in the year and show the impacts of Covid 19 in Oamaru and the District as a whole.
5.7 Household incomes and social-economic status
The census data allows us to map where households with low incomes and different levels of social
deprivation are mostly located in Oamaru.
Figure 4 shows household median income for census 2013, as these data are not available for 2018.
22Figure 4: Oamaru median household income by mesh block, 2013
23The Deprivation Index provides a more complete picture of social deprivation as it is based on a
number of factors and the data are available for 208 as shown in Figure 5 for Oamaru and Figure 6
for the surrounding rural areas or Waitaki and beyond.
Figure 5: Deprivation Index – Oamaru 2018
24Figure 6: Deprivation Index Oamaru Hinterland, 2018
256 Conclusions – towards a housing strategy
For community groups to establish a strategic approach to housing in Aotearoa New Zealand the
first step is to gather sufficient information on the population, housing need, areas and locations,
and potential responses (Community Housing Aotearoa (2015). Information about the population
and housing is therefore an important first step in developing a Housing Strategy for the Waitaki
District. To understand the population and housing needs of the District it is also important to
understand the nature of the economy and the employment it generates, because in rural areas
such as this employment drives both the size and nature of the population. In the Waitaki the
primary rural economy comprises agriculture and associated food processing industries and the
visitor sector.
Over recent years, the demand for labour in these sectors has required an increasing workforce of
overseas migrants, including a large population of Pacific Islanders. At the same time, it is evident
that the population has aged and there is a large component of the population who are aged 65
years or over who are not engaged in the labour market. Both these changes create their particular
needs for housing and social services and the overall goal of enhanced social wellbeing.
The data presented in this working paper is an additional source of information for the research
team and part of the research team’s involvement with the Waitaki Housing Taskforce. The data
adds to the information already provided by the WHTF statistician at the District level as a starting
point for their housing strategy. It will also add to the information gained from a housing survey that
the WHTF has initiated.
We have included here results from the 2018 census data broken down for the Oamaru Area, Peri-
urban Oamaru. Towns of the Waitaki Valley are included for a sense of differences to rural areas
and because of the ongoing research focus on the Alps to Ocean cycle trail as one of the economic
development initiatives examined in Phase 1 of the research. Data are presented in tables and
maps.
The literature review found that affordable housing, especially rental housing, is an important focus
for community organisations and stakeholder groups supporting the wellbeing of migrant workers
and populations. These people are particularly vulnerable to disadvantage in accessing housing due
to their limited capital and limited knowledge of rights such as visa requirements and available
support services. The provision of housing for very transient workers, including seasonal workers, is
a particular issue.
Responses to these issues through strategies and action plans are most successful when they are
driven by the community and involve a range of stakeholders such as the WHTF. In this next phase
of the research programme the researchers will provide an input to development of the housing
strategy, while looking for lessons that can be applied within the Thriving Regions Programme.
26References
Community Housing Aotearoa (2015). Guidance on Developing a Housing Strategy.
Leon de la Barra, Sophia (2020). Summary of Secondary Housing Data. Waitaki Housing Task Force,
Safer Waitaki, Oamaru.
Perkins et al … (2019). Revealing regional regeneration projects in three small -towns in Aotearoa -
New Zealand. NZ Geographer …
Mackay, M., Taylor, N., & Perkins, H C. (2018). Planning for regeneration in the town of Oamaru.
Lincoln Planning Review, 9(1-2), 20-32.
Wilson, J., Mackay, M., Perkins, H., Taylor, N. and Campbell, M. (2020). The Attraction, Integration
and Retention of Newcomers in Regional Settlements: Summary Literature Review & Annotated
Bibliography. Report for the BBHTC National Science Challenge, Client report RE450/2020/013, Ag
Research, Lincoln.
27Appendix 1 Census 2018 spatial frame issues
Explaining the 2018 census boundaries and how they compare to previous boundaries
From the 2018 census, the new geographical boundaries used are statistical areas 1 (SA1) and 2
(SA2), with SA2s being the larger geographical size. For 2018 and future years, the old CAU (census
area units) boundaries are no longer used.
Census 2018 data have been released for SA1 and SA2 boundaries – with some gaps and data quality
issues. There is a meshblock dataset (the smallest spatial unit of the preceding censuses) that sits
below the SA1 geographies, but data are only available by request from StatsNZ.
The new SA1 and SA2 boundaries are larger than the old meshblock and CAU boundaries,
respectively. As shown in the tables that follow, the 2006 and 2013 populations can be different
depending on the geography used, but in most of the small towns the population effects is small.
While the 2006 and 2013 census datasets have been recalculated to the new boundaries, older
census years (eg 2001) have not.
The greatest difficulties with these changes is for the urban and per-urban areas of Oamaru, where
data on both these areas are needed to understand the character of areas for potential urban
growth, recognising that peri-urban Oamaru, as defined here, has a considerable rural component
the further away the boundary is from urban Oamaru.
The following maps (Figures 7–11) compare the old CAU boundaries (in beige) with the new SA1 or
SA2 boundaries in black outline on top.
For the smaller towns, SA1 boundaries have been used.
The population of Oamaru
In previous years, the population of Oamaru was calculated from nine CAUs. In 2018, there are nine
SA2 boundaries that cover the urban area of Oamaru, but less of the peri-urban area (see Figure 7).
The population of Oamaru as calculated by SA2s in 2006 and 2013 is shown in Table 13, which shows
that the population of Oamaru increased by 1,071 or 8.9% over 12 years.
Table 13: Census usually resident population 2006-18 for Oamaru by SA2
SA2 ID SA2 Name 2006 2013 2018
343800 Weston 897 984 1050
343900 Oamaru North Milner Park 2184 2313 2529
344000 Oamaru North Orana Park 2658 2661 2907
344100 Oamaru Gardens 1008 1080 1179
344200 Glen Warren 1524 1512 1632
344300 Holmes Hill 1251 1284 1332
344400 Oamaru Central 249 273 294
344500 South Hill 2259 2199 2184
28344600 Inlet Port Oamaru 6 0 0
Total Population 12,036 12,306 13,107
Table 14 provides a comparison of the population of Oamaru by SA2 and CAU. Exclusion of the peri-
urban areas appears to have an effect of reducing the population by several hundred, reinforcing the
need to use SA1 data to understand the adjoining, peri-urban areas (see also Figure 7).
Table 14: Usually resident population Oamaru - CAU and SA2 comparison
2001 2006 2013 2018
Total Oamaru SA2 12,036 12,306 13,107
Total Oamaru CAU 12,693 12,681 13,044
Population for key towns
The populations for the towns of the Waikiki Valley are shown in Table 15, with the populations for
the new boundaries (SA1 or SA2) for 2006, 2013 and 2018. For the old CAUs the populations are
shown for 2001, 2006 and 2013.
Comparing the 2006 and 2013 populations for the two different boundary types for Omarama and
Otematata it is important to note that the populations are the same or very similar despite the
boundary changes. Kurow has a slight increase, reflecting the larger area of the SA2 compared to the
CAU. Duntroon has a lower population for the two years when using the new boundaries, reflecting
the loss of area with the new boundary (see Figure 7).
Table 15: Usually resident population for key towns by SA2 and CAU
Town Boundary type 2001 2006 2013 2018
SA1 (7027643 + 7027642) 231 270 291
Omarama
Omarama CAU 276 231 267
SA1 (7027647) 189 186 183
Otematata
Otemetata CAU 243 186 186
SA1 (7027651 + 7027652) 348 321 372
Kurow
Kurow CAU 387 339 312
SA1 (7027655) 99 75 96
Duntroon
Duntroon CAU 117 114 87
29You can also read


