Smart city solutions: What drives citizen adoption around the globe? - MCKINSEY CENTER FOR GOVERNMENT
←
→
Page content transcription
If your browser does not render page correctly, please read the page content below
MCKINSEY CENTER FOR GOVERNMENT

                   Smart city solutions:
                   What drives citizen
                   adoption around
                   the globe?
                   July 2018

Authored by:
Jonathan Woetzel
Elena Kuznetsova
This report studies the adoption of smart-city technologies in 15 leading cities around
the globe. Following the citizen-centric philosophy of modern smart-city initiatives, we focused
on the solutions that can change the daily life of citizens, and that citizens can either use
(adopt) or not. While analyzing each solution and providing the synthesis, we pointed out key
drivers of adoption and the measures that city administrations can take to enhance adoption.

We have run detailed analyses on how smart technologies are implemented and adopted
in the cities that achieved the widest usage. These analyses were based on MGI survey
usage data, as well as nonsurvey (objective) usage-related data from a sample of leading
cities. The analyses were performed for nine solutions with the necessary city-level data
available: e-hailing, online government services, digital care search and scheduling,
city presence in social networks, bike sharing, civic-engagement tools, apartment sharing,
car sharing, and smart-parking applications.

We also created an overview of smart-city solutions that are not yet widely used and lack
data for detailed analysis: local social connection solutions, smart meters and smart
thermostats, ride sharing, online education, and health wearable devices.

Recent McKinsey Global
Institute analysis on smart cities
When conducting our research, which covered 15 cities throughout the
world, we observed how widely smart-city technologies were implemented,
and how often their adoption proved successful. While our report deepens
the smart-city analysis in this area, it also follows a broader initiative of the
McKinsey Global Institute: a recently issued report titled Smart cities:
Digital solutions for a more livable future.
The core findings of the MGI report are as follows:
MGI assessed how nearly 60 current smart-city applications could affect multiple
quality-of-life dimensions in 3 sample cities with varying legacy infrastructure systems
and baseline starting points. Among other positive outcomes, these tools could reduce
fatalities by 8 to 10 percent, accelerate emergency response times by 20 to 35 percent,
shave the average commute by 15 to 20 percent, lower the disease burden by
8 to 15 percent, and cut greenhouse gas emissions by 10 to 15 percent.
MGI studied the progress of 50 cities throughout the world and learned that wealthier
urban areas are generally transforming faster, although some have low public awareness
and usage of smart solutions. Asian megacities such as Beijing, Seoul, and Shanghai,
with their young populations of digital natives and large-scale urban problems, are
achieving exceptionally high rates of adoption. Cities around the world vary widely in the
types of applications they have implemented, though focusing on mobility is a common
denominator. When measured against what is possible today even global leaders have
more work to do in building a fundamental technology base, rolling out the full range of
possible applications, and boosting adoption and user satisfaction. Since technology
never stands still, the bar will only get higher.
According to MGI research, the public sector would be the natural owner of 70 percent
of the applications examined, but 60 percent of the initial investment required to
implement the full range of applications could come from private actors. Furthermore,
more than half of the initial investment made by the public sector would generate a
positive return, whether in direct savings or opportunities to produce revenue, creating
opportunities for more public–private collaboration. City governments choreograph
Smart cities: Digital these activities: providing and tracking data, bringing stakeholders together, ensuring
solutions for a more coordination, and addressing unintended consequences. They also engage the public
livable future as active participants.
Smart city
    solutions:
    What drives citizen
    adoption around
    the globe?

4   Smart Citizen report
Contents

Smart citizen report scope and methodology
Smart city and smart citizen – study scope           7
Data and sources                                     9

Summary
Smart solution usage diversity among cities          11
Smart solutions usage diversity among technologies   14

Detailed analyses of smart solutions
E-hailing                                            19
Online government services                           22
Digital care search and scheduling                   26
City presence in social networks                     30
Bike sharing                                         32
Civic engagement tools                               38
Apartment sharing                                    42
Car sharing                                          44
Smart parking applications                           46

Overview: Smart solutions not widely used yet
Local social connection solutions                    49
Smart meters and smart thermostats                   52
Ride sharing                                         54
Online education                                     56
Health wearable devices                              57

                                                          5
Smart citizen
report scope and
methodology

Smart city and smart
citizen – study scope
The concept of smart cities first took shape in the early 2000s and focused primarily on
technology and infrastructure development. This research and investment resulted in new
technologies, massive data centers, smart sensors, automated grids, and some healthy
skepticism—sometimes even the smartest ways to implement sensors and technology
has little noticeable effect on citizens’ daily lives.
Following years of trial and error, urban specialists arrived at a new smart-city model built
around citizen engagement and how smart technology solutions are used.
2010 2012 June 2016
12/10 Rio’s Smart City China approves 90 pilot projects for Y-Combinator starts
~2016 ff.
Smart
Operations Center inaugurated smart cities; by 2013 there are 193 pilots “New Cities” initiative
EU adopts 2020 strategy
with emphasis on role
2013: Critical voices start dominating debate
10/13 Anthony Townsend book: “Technology giants building smart
City 2.0
of “smart cities”
cities are mostly paying attention to technology, not people”
12/13 Adam Greenfield book Against the Smart City
~2008–2012 12/13 Economist debate: “Are smart cities an empty hype?”
May 2015
Smart City 1.0 Sidewalk Labs founded
November 2008
IBM presents Smart 2018
Planet initiative, starting ~2013-2015 70–80% of adult citizens with
entry of tech companies access to internet using some smart
into the field Criticism of Smart City 1.0 solutions in leading megacities
Focus on discrete Companies “throwing” Focus on impact on goals of individual city,
technology use cases technology at cities not on technology itself
Mainly B2G Efficiency driven, with Multisector, multiactor game
Top-down deployments unclear benefit for citizens Citizen-engaged, citizen-centric
We are in the process A modern smart city is not just an urban area with a highly developed technological
of entering a “second era”
of smart cities, one that
infrastructure, but rather a place where citizens live in a smarter way. Through the use
could live up to its actual of technologies and digitization of offline services, citizens can allocate their resources
potential by being more and time in an efficient and productive manner—becoming smart citizens in a smart city.
citizen-centric and
outcome focused
Many reports on smart cities focus on urban technological equipment, and while the funds
and effort invested by a city’s administration continue to be the major factors of successful
implementation, many of these technologies have an indirect—or sometimes invisible—
effect on citizens’ lives and behaviors. For example, the effects of smart grids or closed-
circuit television (CCTV) cameras on the average citizen are often not noticed by citizens
because they are employed in a noncitizen-facing processes. These smart solutions are
still very important, as they save cities and citizens time, energy, and cost. However, for
this study we specifically aimed to understand what increases acceptance and usage
of smart solutions when an individual chooses whether to use that smart solution.
Our research concentrated on 21 citizen-centric solutions, or nearly one-third of the smart-city
solutions that can be widely implemented until 2025. From those, we analyzed all solutions
where city-level data needed for analysis (other than surveys) were available. Additionally, we
covered seven more solutions of interest as developing technologies while still having median
usage levels below the 25 percent threshold, as well as lacking city-level data.
Smart citizen report scope and methodology 7
The group of cities we studied includes 50 cities across the globe where MGI has conducted
customer surveys. For our deep dives on specific smart solutions, we selected 15 cities
from different parts of the world that represent various income levels and cultures, including
Barcelona, Berlin, Dubai, Hong Kong, London, Melbourne, Mexico City, Moscow, New York,
Paris, São Paulo, Seoul, Shanghai, Singapore, and Tokyo.
The smart-city benchmarking is focused
on citizen-centric smart solutions
City smart solutions
Smart infrastructure and systems
E-career center Citizen-centric smart solutions—report scope
Personalized school learning through performance analytics Citizens have a choice to use smart solution or opt out
Building automation system for commercial buildings Apartment sharing applications
Building automation systems for public buildings Civic-engagement tools
Distribution automation systems Digitization of citizen services
Dynamic electricity pricing Digital care search and scheduling
Smart streetlights Bike sharing
Real-time telemedicine Car sharing
Data-based population health interventions Private e-hailing
Environmental monitoring tools Smart-parking applications
Infectious disease surveillance system City presence/interaction on social networks
Medication adherence tools Local social connection applications (including
Body-worn cameras
volunteer applications)
Digital payment in public transport
Early disaster warning systems
Integrated multimodal info
Emergency system/dispatch optimization
Real-time public transit info
Gunshot detection
Real-time road navigation apps
Predictive analytics for safety
Food ordering online (apps)
Real-time crime mapping
Health wearable devices and remote monitoring applications
Smart surveillance & biometric platforms
Online education
Digital waste payment and management
Ride pooling
Garbage surveillance
Home energy automation
Optimized waste collection (residential)
Water consumption real-time tracking apps enabled by
Smart trash compactors (public)
smart meter
Leakage detection/control
Electricity consumption real-time tracking apps enabled
Remote water quality management
by smart meter
Smart irrigation
Autonomous vehicles
Congestion pricing Detailed analyses performed: city-level data available
Dynamic bus scheduling and routing
Intelligent traffic signals Brief overview of solutions not widely used yet:
Load pooling
median usage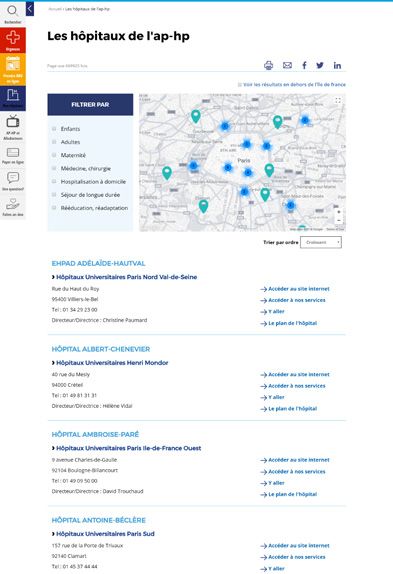
Data and sources

Our MGI survey
The McKinsey Global Institute ran a global smart solutions survey in 50 cities, covering
a representative sample of 380 to 400 citizens in each city.

The survey asked the respondents (18 and over, with personal access to the Internet)
whether they were aware of, used, or were satisfied with the smart solutions on our list.

McKinsey global transport benchmarking of megacities
We use a public-transport aggregated index, a private-transport affordability index,
and e-hailing prices per kilometer from the report’s data.

Website visits
Website visits and user behavior data as measured by SimilarWeb.

App usage
Active app user data as measured by SimilarWeb. The activity data is available for users
who downloaded the Android app after February 2016.

Facebook Audience Insights
Share of Android smartphones for each city as measured by Facebook Audience Insights
for geographies where there are no local social networks more representative than
Facebook (for example, Russia and China).

Demographia World Urban Areas
Urban area (agglomeration) population as reported by Demographia World Urban Areas.

Numbeo
Average monthly net salary after tax as reported by Numbeo.

Open sources
All other data, including the population within the administrative boundaries of the city,
was collected from city websites and press (official sources preferred).

Smart citizen report scope and methodology                                                   9

Summary
Smart solution usage
                                 diversity among cities
       Smart routine
                                 One of the first and most important outcomes of our analysis shows that smart-city
                                 solutions are widely used by citizens around the globe, and in some cities they have already
                                 become a part of nearly everyone’s daily routine.

       Leading cities
                                 Dubai, Hong Kong, Mexico City, Moscow, New York, São Paulo, Seoul, Shanghai,
                                 and Singapore form the group of cities in which the average adoption of smart solutions
                                 exceeds 30 percent.1 Furthermore, if we look at the most widely used smart technology
                                 available in each of these cities, the usage rate reaches 70 to 80 percent. That level of usage
                                 obviously goes far beyond “early adopters,” or even “followers,” and extends to nearly every
                                 citizen. This data shows that income level per capita, culture, and language do not prevent
                                 the spread of smart-city solutions. Any city administration aspiring to promote the usage
                                 of smart solutions among its citizens need look no further than the examples of leading
                                 cities with similar conditions.

  Share of citizens                                          Users of smart               Awareness of
  who have used                                              solutions1 among             smart solutions1             Average age
  smart solutions1             Examples of cities            adults                       among adults                 of adults (>18)

        >40%                   Shanghai                              52%                          72%                          40

                               Singapore,
                               Dubai, Moscow,
                               Hong Kong, São
     30–40%                    Paulo, Seoul,                         36%                           61%                          41
                               Mexico City,
                               New York

                               Paris, London,
     20–30%                    Barcelona, Berlin                     25%                          55%                            47
Dubai
Another takeaway is that many of the examples of the increase in smart-solutions usage
are in developing markets. The group of cities where usage rates exceed 30 percent is
mostly represented by urban centers outside North America and Western Europe, with
the only exception being New York. It is quite possible that the lack of well-established and
well-functioning traditional solutions is the contributing factor. That is, if conventional parking
meters were installed across the city 20 years ago, and citizens are accustomed to them,
both habit and cost consideration will lower the incentive to try a smart solution to pay for
parking. Alternatively, in places where there is no “traditional” solution, user-friendly “smart”
solutions offer the potential for explosive growth (for example, the usage of smart-parking
applications in Dubai). Another potential explanation is that customers in those markets are
more willing to try something new. Even for e-government services, the rates of usage seem
to be higher in cities outside of more developed regions, though the difference in convenience
between offline and online offerings should be convincing enough everywhere, and demand
for the underlying product is universal.
Influencing factors
Several objective factors, as well as cultural embeddedness, contribute to the usage of smart
solutions. Among the objective factors that stand out are population age and density, climate,
coverage of public transportation, vehicle ownership, and income. For example, a two-year
difference in the average age of the population equals as much as one percentage point
difference in smart-solution usage. A more densely populated area demonstrates stronger
utilization and provides a more attractive smart-solution economy for both providers and
users, especially for shared-economy services such as bike sharing and car sharing.
A warmer climate is a strong driver of smart solutions for street activities such as bike sharing,
jogging, or other social activities. Wider public transportation coverage reduces the need for
a private vehicle and supports smart-transit solutions. Vehicle ownership affects the spread
of solutions such as smart parking or navigation apps.
12 Smart city solutions: What drives citizen adoption around the globe?Income level can influence implementation of smart solutions. For example, a recent study by
the McKinsey Global Institute, Smart cities: Realizing the potential of digital intelligence, has
shown that high-income cities have higher-speed communication networks with a broader
sensor base. Nevertheless, while a better tech base allows a city to provide a better user
experience, it seems to be good enough in all the 15 cities we observed to allow the spread
of smart solutions. When the population is wealthy enough to afford broadband Internet,
personal computers, and has a 60 to 70 percent smartphone penetration, there are no
technical limitations on the implementation of the majority of citizen-centric smart solutions
that we studied. At this point, institutional and behavioral factors begin to play a greater role.
Moscow
With all the variety of factors above, a city government’s attitude toward smart solutions plays
a role. An active citizen and an active government seem like an ideal combination, especially
in the areas where government services or functions are being digitized and the private sector
is unable to take initiative. Still, even within one city we see wide variations in the usage of
specific solutions. So, what is responsible for these variations?
Summary 13Smart solutions usage diversity
among technologies
Looking deeper at the usage data, a group of five leading solutions reached a median
usage rate of around 50 percent or higher. This group is represented by widely used smart
solutions that digitize existing behavioral patterns and needs with a wide demand among
most adult citizens. For instance, an overwhelming majority of adult citizens regularly use
traditional urban services such as public transportation, taxis, or government services.
Therefore, smart-city solutions that simplify the process, improve customer experience,
and do not require significant behavioral shift become as widely used as their underlying
urban services.
The rest of the solutions show lower usage rates. Nine solutions have median usage rates
of 20 to 40 percent, while seven have been used at least once by less than 20 percent of
adult citizens. This situation may be explained by the set of factors that limit smart-solution
adoption in most of the cities.
Hong Kong
Demand limitations
One possible reason is that the demand for some smart solutions may have natural
limitations. For example, large groups of citizens may not require a solution such as bike
sharing due to the climate or insufficient cycling infrastructure. Similarly, citizens may not
widely adopt an apartment-sharing solution due to a lack of tourists or idle space. On the
other hand, where demand for the service was traditionally high, the smart solutions that
meet this demand reach wide adoption. For instance, bikes were historically popular in
China, and now bike sharing in the country is booming.
Maturity of technology
Some solutions with lower usage rates could simply be at an early stage of evolution.
They may have high potential for widespread adoption in the future, but in the meantime
the product is not yet prepared to be built into the surrounding systems, or perhaps it is not
yet well known. For example, there are potential use cases for wearable medical devices
that monitor the health of patients with chronic conditions, but there is a lack of cases of
individual devices that successfully link to the healthcare system, and a patient’s medical
records, that have managed to achieve wide usage.
14 Smart city solutions: What drives citizen adoption around the globe?Usage diversity among technologies
Real-time transit info
Food ordering apps
Real-time car navigation apps
E-hailing
E-government services
Integrated transit apps
Digital payment for public transport
Digital care search and scheduling
Government social media
Health wearable devices
Accommodation sharing apps
Civic-engagement tools
Local social connection apps
Bike sharing
Online reskilling program
Car sharing
Ridepooling
Smart parking
Electricity consumption real-time tracking
apps enabled by smart meter
Smart thermostat
Water consumption real-time tracking
apps enabled by smart meter
0% ever used 20 25
30 35 40 45 50 55
60 65 70 75 80 85
90
Each point represents one city score Minimum score Maximum score
Other scores Median score
Summary 15Need for a behavioral shift
Finally, the readiness of citizens to adopt a new technology might be a huge differentiator.
Solutions that digitize some widely used existing process are easier to adopt than solutions
that create a new pattern of behavior. For example, car navigation apps do not change the
driving experience. We still get into the same car and drive the same way, only now we rely
on a navigator rather than our own memory or paper maps. We experience riding commuting
trains and subways the same way, looking at the real-time transit info app and integrated
transit app instead of paper or board timetables. E-hailing and food-ordering apps are also
relatively easy to adopt because the only thing that really changes is pushing a button to order
rather than calling a dispatcher or an employee of the restaurant.
São Paulo
On the other hand, there are smart solutions that promote new behavioral patterns. These
solutions often require a change of attitude or force citizens to do new things, rather than
doing old things in a new way. Such solutions often lag behind in usage, probably because
behavioral or attitudinal changes take time. For instance, to use car sharing a citizen must first
grow accustomed to using a car that is also used by other citizens, in addition to the effort
spent locating it. Ride sharing requires being in a car with a stranger and readjusting regular
routes, which translates to getting used to new conditions. Likewise, civic-engagement tools
require people to change their attitudes from relying on their government, in most cases,
to proactively formulating and voting for initiatives and reporting issues.
16 Smart city solutions: What drives citizen adoption around the globe?Government actions
A city’s government plays a role in whether citizens choose to adopt smart solutions,
towards a smarter city varying from accurate regulation to government promotion or government-led
implementation. First, cities might need to set development priorities and target adoption
levels. The McKinsey Global Institute’s report Smart cities: Realizing the potential of
digital intelligence provides several analyses of the impact of various solutions on a city’s
economy, its commute times, and the health of its citizens. Besides their potential impact,
factors such as government policies and cultural embeddedness should be considered
in the prioritization of smart-city solutions.
Different approaches Second, the suitable approach to smart-solution development depends on the type
for different solutions
of smart solution.
Best practices
For the leading group of widely adopted smart solutions, best-practice cases may be
studied and applied. Many areas include cities that are strong examples to learn from,
and many of the most successful cases are described in this report.
Product development
For solutions that are still in the early stages of technical development, experimenting
and attracting private partners may be the way to boost solution development. A more
flexible regulatory regime can promote technological and economic leadership by enabling
technological pilots (for example, autonomous vehicles or telemedicine). The Dubai 10X
initiative is a vivid example of proactive, government-led smart-solutions development,
and aims to put Dubai ten years ahead of other cities. In 2017, 36 Dubai government entities
submitted more than 170 disruptive solutions projects, and 26 of them were approved
by the crown prince.
Behavior change
In cases where a significant behavioral shift is required for smart-solution adoption, one
of the core goals of a city’s government might be to promote new behaviors and attitudes.
A few methods of helping achieve this goal are the use of media campaigns, the personal
example set by the mayor, and regulatory incentives.
Summary 17Detailed analyses of smart solutions The next section shows the results of our analyses for specific solutions. We have arranged our analyses from the most universally popular to the least accepted. Our goal was to understand what factors contributed to the success of each solution in the cities where it was widely adopted and to help the next wave of cities interested in replicating the success of these leaders.
E-hailing

                                         E-hailing services provide computer or mobile-device users with a convenient way to be
                                         picked up by a vehicle and delivered to a destination. Pooled e-hailing and ride sharing were
                                         analyzed separately. E-hailing services appeared in most metropolises three to six years
                                         ago and significantly changed the face of the industry in this short period of time. E-hailing
                                         provides a great illustration of the speed of change to both traditional industries and citizen
                                         life brought by smart-city technologies.

                                         In our research, we looked at usage, client satisfaction data, the cost of a taxi (Uber or Didi)
                                         per kilometer against the average salary, and a number of available taxi licenses in each city.

                                         The arrival of e-hailing services often brings more affordable and convenient taxi services
                                         for citizens. For example, in Moscow the number of taxi trips increased by 30 percent,
                                         the time of arrival decreased from 30 minutes to 4 to 5 minutes, and the price of a trip
                                         decreased by at least 35 percent.

                                         E-hailing platforms significantly lower barriers to entry for drivers and provide an efficient
                                         order distribution, increasing utilization and decreasing the cost of the service when
                                         compared to traditional taxi stands. The lower cost also incentivizes people to switch
                                         from traditional services to e-hailing. Taking this into account, we see that cities with
                                         the highest usage of e-hailing services also experience the lowest cost.

                                                                             Cost per 1 km per                      Taxi licenses per
                                      Ever used (MGI)1, %                    average salary2, %                     1,000 citizens                         Level of satisfaction3, %

São Paulo                                               82                                0.11                          1.8                                12                88

Moscow                                                  81                       0.05                                                 4.9                  5                95

Shanghai                                               78                       0.04                                     2.0                               13                87

Mexico City                                            74                            0.08                                       3.7                        15                85

Singapore                                              72                           0.02                                            4.4                    8                92

Hong Kong                                          64                             0.06                                   2.1                                   26                74

Seoul                                             55                                0.07                                      3.0                          14                86

Paris                                             54                                   0.09                             1.6                                10               90

New York City                                     53                                0.07                                      3.0                          10               90

London                                       33                                     0.07                                  2.3                              11                89

Berlin                                   19                                               0.11                           2.0                                   24              76

Tokyo                                   14                                                  0.13                       1.3                                  21                79

1 Have you used one of those apps: e-hailing which lets you order a driver/taxi through an app?     Number of taxi licenses         Not satisfied/               Somewhat satisfied/very
2 Average cost of trips in Uber/ DiDi for China, average salary after tax.                         limited by government            not at all satisfied         satisfied/extremely satisfied
3 Divided by urban area (metropolitan area) population as provided by Demographia World
  urban Areas

                                         Detailed analyses of smart solutions                                                                                                                    19
It’s also apparent that the influence of e-hailing’s growth on traffic needs to be carefully
tracked. Each e-hailing trip in a taxi can either be new, a substitution for a private car,
or a replacement for public transportation. The implication here is that each e-hailing trip
can either have a positive or a negative effect on the efficiency of a city’s roads. For example,
New York saw e-hailing trips increase from 2014 to 2016, with bus trips declining, and
subway trips increasing in 2015 but decreasing in 2016.1
E-hailing platforms need flexible government policy that allows drivers to be integrated
into the legal market. The two cities that show the highest satisfaction with the service are
Moscow and Singapore. In Moscow, the local government issues new licenses, which
are not limited in quantity. These licenses fully cover existing demand, though there are
uniform quality requirements. The level of satisfaction of e-hailing services in Moscow
is 95 percent—the highest among the 12 cities in our sample—the share of legal taxi
drivers is at 80 percent, and more than 85 percent of taxi orders are made through mobile
applications. Singapore has the second-highest level of satisfaction in the sample. The
city’s regulations allow Uber to operate, require licensed drivers, and do not limit the number
of licenses. Both cities have the highest number of taxi licenses relative to population,
and therefore high market competition. They also have the highest quality of e-hailing
services as confirmed by users’ satisfaction and the lowest cost of service compared
with citizens salary. Sao Pãulo closely follows on usage and satisfaction figures, using the
same formula of high competition and quality standards for e-hailing drivers. Moreover,
Sao Pãulo developed an e-hailing app for traditional taxi drivers to help integrate them
into the changing market (there is a similar app in Mexico City). Special laws for network
transportation companies were enacted recently in the United States, affecting 48 states,
which provide the legal framework for the operations of e-hailing companies such as Uber.
These laws are an excellent example of integrating a recent smart solution into the legal field.
At the same time, Berlin and Hong Kong restrict the number of taxi licenses and demonstrate
a relatively low level of citizen satisfaction with e-hailing services. A limitation on licenses
might support the rise of an unregulated “grey” market, which lacks quality control when
it comes to cars and drivers. Moreover, due to limited competition in the legal segment,
the motivation of licensed drivers able to provide superior service might also be diminished.
E-hailing market and regulation overview for cities with the widest e-hailing usage
São Paulo
Uber has changed the taxi market of São Paulo: with only 37,000 active taxi licenses in the
city, Uber has amassed 150,000 drivers. Another e-hailing platform, EasyTaxi, works with
existing taxi drivers. It claims that drivers can make about 30 to 40 percent more money
while working 30 to 40 percent less time.
All Uber drivers are required to pass a 16-hour online course, similar to those available for
taxi drivers, which covers official registration, dress code, and more. A group of 100 staff
members in or around São Paulo are tasked with performing random checks to make sure
all requirements are met.
To alleviate some of the tension between taxi drivers and Uber drivers, an application
is being developed under the name of “SPTaxi.” This application aims to give traditional
1 Unsustainable?, Schaller Consulting, February 2017, schallerconsult.com.
20 Smart city solutions: What drives citizen adoption around the globe?city taxi drivers the features that Uber provides their drivers, including access to geodata, fare estimates, and discounts. Moscow The standard for taxis is the same for all regardless of e-hailing functionality; it covers the age, color, and technical condition of the vehicle, as well as tenure for the driver. E-hailing is allowed and drivers must play by the same rules. These conditions resulted in more than 85 percent of taxi orders being made through mobile applications. At the same time, the share of legal taxi drivers is 80 percent. Moscow demonstrates the highest number of taxi licenses per population in the sample. When taxi-aggregating platforms first entered the market, the average taxi arrival time decreased from around 30 minutes in 2011 to 4 to 5 minutes in 2017, and the number of trips increased by 30 percent due to aggregators taking over the market. In addition, the average bill decreased from RUR 700 in 2014 to RUR 460 ($8) in 2016, which is about 1 percent of the median salary, or 0.5 percent of the average salary. Currently 212 million taxi trips are made every year, which is around 3.5 percent of the trips made by all types of transportation. Singapore Since Uber and Grab entered the Singapore market, the total number of licensed taxis went from 29,000 in 2014 to 25,000 in 2017. As of 2017, around 10 percent of the taxis that belong to the biggest player, ComfortDelGro, stand idle. In 2014, that figure was less than 3 percent. At the same time, the number of private car rentals since 2013 tripled to 63,259, and it is estimated that 50,000 cars are used in e-hailing services. Singapore’s local government deregulated taxi fares in 1998, and since 2003 new companies have been allowed to enter the market. In 2014, a regulatory framework for third-party booking services was imposed: only licensed taxis can be dispatched through e-hailing services, and taxi fare information must be communicated to riders up front. This framework also mandates that all rider complaints and queries must be collected and handled by the service company. Detailed analyses of smart solutions 21
Online government
                                             services
                                             Government services, from tax returns to construction permits, are being digitized and
                                             made available online. Pioneers first began this process more than 15 years ago. In recent
                                             years, the majority of the world’s governments are likely digitizing their services, although
                                             adoption rates still differ widely. What drives the difference?

                                             Widespread adoption of online services might be a consequence of digitizing the maximum
                                             number of services in all spheres of interaction between citizens and their government,
                                             and not just core civil services (fines, taxes, and permits). For example, in 2017, Dubai’s
                                             government piloted an “online only” initiative in which service centers were closed for one
                                             day and 950 services from 32 public entities were provided online only.1 Dubai’s government
                                             also currently provides 55 services from 24 government entities in one mobile app, Dubai
                                             Now. Mobile-app access for the most frequently needed services helps to simplify citizens’
                                             access and increases adoption and usage. Moscow offers 250 services via the web
                                             portal, relating to business, education, healthcare, housing, private transportation, public
                                             transportation, family, social support, culture, sports, civil documents, labor, fines, disabled
                                             people, emergencies and security, environment and animals, and complaints. Ten popular
                                             services are available in the mobile app.

                                                                                                  City govt site visits                        Daily app users
                                                   Ever used (MGI)1, %                            per month per citizen                        per 1,000 citizens2

     Moscow                                                             85                                            2.9                                      9.83

     Dubai                                                         61                                 0.2                                             5.383

     Barcelona                                                    53                               0.3         1.3           1.6                0.26

     Hong Kong                                                49                                         0.3

     São Paulo                                               42                                          0.3                                             7.57

     Melbourne                                               39                                       0.2

     New York City                                           38                                      0.7

     Berlin                                             23                                         0.3                 2.3               2.6   0.03

     1 Have you used any of those services: e-government services that let you conduct important administrative processes fully online, eg,                    Services portal
     file your taxes, get your car registered, apply for permits and certificates?                                                                             Informational portal
     2 Divided by the city population in administrative borders.                                                                                               Combined services
     3 Dubai Now app usage analyzed. The sum of users of separate departments apps like DEWA or Dubai Police would lead to multiple                           and informational portal
     count of users and the result would not be comparable to other applications in the sample.

                                             At the same time in Berlin, where a relatively narrow group of people used e-government
                                             services, 75 services are available, and listed without categorization, on the city’s
                                             government services site’s “online” page. The city’s mobile-services app is only able
                                             to inform users how and where to apply for the service, rather than providing the service
                                             itself. Of course, end-to-end digitization of the government-services process is a resource-
                                             consuming operation. Berlin demonstrates an alternative way of how a city portal might
                                             serve people and be frequently visited and used. It provides an extensive informational
                                             functionality that is useful to citizens in categories such as theater tickets and job vacancies
                                             and achieves a relatively high number of visits per month per citizen.
                                             1 “950 government services in Dubai available ‘online only’ on October 26th,” Emirates News Agency, October
                                               18, 2017, warm.ae.

22                                           Smart city solutions: What drives citizen adoption around the globe?
Berlin
It’s good practice to supplement online government services with a relevant, well-
designed, and constantly updated city portal. This portal features useful content
for citizens, such as information on life in the city, policies, and assistance for small
businesses. The integration of a city’s information portal and online government services
provides access in a “one-stop shop.” People who are willing to use an online service can
find useful information on city projects or important news, driving the habit of using the
government portal for all their needs.
After a portal’s launch, a full range of services and a friendly customer interface matter
more than how long it has been available to the public. The cities that digitized their services
just 5 to 7 years ago achieved the same or better results than some cities digitized the
services 10 to 15 years ago. For example, within three years of its inception, Mexico City’s
e-services demonstrated a higher usage rate than New York’s, which launched eight years
ago. Dubai’s e-services overtook São Paulo’s, which launched two years earlier by a wide
margin. Similarly, within five years Moscow’s portal demonstrated double or triple the usage
figures over Berlin’s, New York’s, or London’s, which all launched at roughly the same time.
This could imply that after a few years of a portal’s launch the main factor of widespread
usage and adoption might be the breadth of digitization of the government’s services
and interface usability rather than the date digitization began.
Detailed analyses of smart solutions 23Moscow’s city portal and online government services
Moscow’s city portal serves as a one-stop shop for citizens; the government services portal,
mayor’s portal, and citizens’ feedback portals were all integrated in 2017. The government
services available on the mayor’s portal extend to many areas of citizens’ lives, and the
most frequently used services are included in a mobile app. The portal is built in a customer-
friendly way, with single- or double-click access to the most frequently used services. Today,
6.5 million people use the city’s government services online, and more than 75,000 people
use the mobile app daily (it includes 14 popular services). Other services and information
are also available on the mayor’s portal.
14
250
services available online
The most frequently used services are: online school
most needed issues
available in a mobile
app social card
SMS
diary, water-meter measurement reporter, doctor-
visit booking, unified bill for utilities, energy-meter
measurement reporter, information on attendance and
nutrition in schools, school exam results, registering
children for nonschool courses, registering children for status notifications
kindergartens, application for students’ social cards
City City planning
projects
City voting, problem reporting, smart apartment block
information
Transport infrastructure
construction, housing
(e-voting), housing renovation, online school education reconstruction
Culture and leisure
24 Smart city solutions: What drives citizen adoption around the globe?Berlin’s city portal and online government services
Berlin’s city portal, which has been operating for 20 years, offers news, information,
checklists, and policies on a broad range of spheres of city life:
Politics and
Culture
administration
Profile, performance,
and leisure
Tickets for almost any public events taking place in the city,
press releases, police from art exhibitions to movies and musicals; contacts and
reports, governance, descriptions of places to eat, libraries, gyms, parks etc.;
education, careers in civil highlights of social and cultural life of the city
services
Other
Tourist Car repairs and insurance, pets, pedestrians,
information sports, beauty.
Accommodation booking,
city plan, information
about transportation
sightseeing, shopping,
Job searching
Vacancies repository, labor law, application hints,
weather forecasts, design news, universities and courses
Advertising
permitted on and accurately integrated
to the website design
Economy
Macroeconomic and administrative
reports, industry list, tips on start-ups and
funding info, investment and city promotion Real estate
opportunities, business immigration
services, innovation (health, energy,
logistics, media, incubators), labor-market
and parking
Real estate search (for sale/rent),
overview designer tips
Online government services can be accessed via the website or the mobile app and cover
core civic issues in the following areas:
Documentary
procedures Healthcare
ID requests, permits, recognitions,
birth and marital certificates,
Licensing, approbation,
consultations and
services for the
Neighborhood-
related services
Eg, recovery of loss,
Other
Construction, business,
tax determination and collection, disabled, food safety, reporting waste and migration, education,
bankruptcy and other legal inquiries infection control noise sports, media, etc.
Detailed analyses of smart solutions 25Digital care search
and scheduling
Digital search and scheduling services help patients choose a doctor
or book an appointment.
We studied the share of adults who have access to the Internet and who have used digital
search and scheduling services at least once, as well as the number of website visits and
number of mobile applications users per day.
Two cases stood out by usage rates and website visits: the United Medical Information
and Analytical System of Moscow (EMIAS), a multipurpose medical IT ecosystem with
appointment-scheduling functionality; and the appointment-scheduling service for Public
Association of Paris Hospitals (AP-HP) in Paris. The private provider that built AP-HP is also
the owner of the popular European care search and scheduling platform Doctorlib.
Number of site visits per Number of daily app users
Ever used (MGI)1, % 1,000 citizens per month per 1,000 citizens
Moscow 55 145 1.656
Paris 50 114 0.008
Dubai 29 13 0.004
Barcelona 29 54
Hong Kong 19 23
Singapore 18 26 35 61 0.077
1 Have you used any of those services: digital care search and scheduling (ie, websites that let you find the Public with online appointment Private
right doctor and schedule an appointment)? Public search only
2 Divided by urban area (metropolitan area) population as provided by Demographia World Urban Areas.
The healthcare search and scheduling functionalities of both platforms have been adopted
widely and are implemented by public healthcare organizations. Centralized public
organizations have the power to impose service and IT standards and compliance with
appointments, as well as enforce the transfer of all units and personnel to a new system.
These organizations are also able to respond at scale: a big public organization is more
likely to invest in an IT ecosystem to benefit the public.
Though AP-HP was implemented three years after the launch of EMIAS, it has achieved
similar results. Moreover, it has covered a higher share of citizens than other systems
that launched four to five years ago. That comparison again suggests that high usage is
determined by the ability of a government to cover the maximum number of hospitals with
a unified appointment system, an easier feat in a city with predominant public medicine.
The basic functionality of booking medical appointments, which requires only a publicly
available calendar that allows for filling slots, is relatively easy to implement. Plenty of
private platforms and vendors can provide the required technology and skills. In addition,
these implementations come at a lower cost since no major IT infrastructure investments
or reorganizations are needed.
26 Smart city solutions: What drives citizen adoption around the globe?Broader digitization and additional functionality of medical-information systems enable
further process automation and efficiency gains but require complex implementation. These
systems might include functionality to allocate a medical organization’s resources, provide
queue management on a citywide scale, book appointments for home visits, track utilization
by doctor or medical department, and track patients between medical organizations. Such
systems may also provide communication with other organizations linked by the healthcare
system—for example, ordering and paying for laboratory analyses or medicaments and
settling accounts with insurance companies.
Moscow’s EMIAS system
In Moscow, EMIAS supports 660 public healthcare units, including 400 polyclinics and has
9.8 million people registered. The mobile app has been downloaded 800,000 times, and more
than 2 million medical appointments are processed every month. Further, citizens of Moscow
can access the functionality from the government services app as well as online. EMIAS also
provides an open application programming interface (API) to allow for third-party development.
Days from scheduling Time spent waiting
appointment to visit, % for consultation in clinic, %
>3 25 7 >20
19 min 40 33
2–3 13
Therapist
today– 74 3 13 4 5 >20 13 9
2–3 8 min
OB-GYN
today– 91 87 91
tomorrow 79Paris’s AP-HP system
The AP-HP digital care appointment system covers 39 public hospitals and 23,000 health
professionals. Its user interface was developed by the private developer who also owns
Doctorlib, a popular app for scheduling appointments with doctors in France. Working on
a number of mobile applications (AP-HP Patient, AP-HP Pro, Doctorlib) and web platforms
(the AP-HP website, the websites of various clinics, Doctorlib), the system supports
appointments with public healthcare providers. Public Association of Paris Hospitals
is the leading healthcare organization with 39 public hospitals and 676 public clinics.
AP-HP allows users to make an appointment with many types of doctors, covering
more than 120 specializations. In addition, the AP-HP website provides links to the websites
of every hospital, as well as their building plans, addresses, and areas of specialization.
Last, the site includes video content on healthcare topics, interviews with doctors, and
functionality that allows users to pay for services or donate funds.
28 Smart city solutions: What drives citizen adoption around the globe?Paris
While the AP-HP website scores high in terms of visits, the mobile app has yet to achieve
widespread adoption—fewer than 5,000 users of Android devices installed the app.
Nevertheless, the app is effective in providing functions beyond appointment scheduling.
Patients can quickly locate and navigate to one of the 39 AP-HP hospitals and their
emergency services; once they have arrived, the app will help them navigate inside
the building. Preferred hospitals can be saved to the home screen, and many of the
administrative procedures, such as hospitalization forms, patient history, and hospital bill
payments, can be completed from the app. The app also provides patient information,
including patient rights, hospital check-in and checkout procedures, disease prevention
information, and news regarding AP-HP and its 39 hospitals.
Detailed analyses of smart solutions 29City presence
in social networks
In addition to traditional meetings and press interviews, city leaders would be wise to use
social media. These platforms allow leaders to communicate directly to groups of citizens
that are otherwise insufficiently covered by other channels, including young people, and also
provide feedback from the audience in the form of likes, comments, and reposts.
First, a city’s account on social networks helps its government explain policies and
measures to citizens, and this better understanding might translate to increased adoption.
Second, these accounts may help collect feedback from citizens in the form of comments.
And third, they help citizens learn more about their city. Knowing where and how to spend
time, and an increased awareness of city-level activities, may help citizens form new
communities and raise general life satisfaction among citizens.
A majority of cities in our research have official social-media accounts for their mayor
and for the city itself. In most instances, Twitter is the social network of choice, followed
by Facebook and Instagram. The notable exception is São Paolo, where Facebook is
predominant. We analyzed the style and content of posts by successful accounts for
mayors and cities to provide examples for those who strive to develop social media into
an effective city communication channel.
Successful accounts for mayors demonstrate a large diversity of topics. Some of these
topics, which make up 10 to 13 percent of overall posts, include strategic goals and
elections, social issues, city events and holidays, the economy, security, world and country
news, culture, emergencies, civil rights and minority issues, and urban projects. By contrast,
successful accounts for cities demonstrate a high concentration of content related to city
events and holidays (34 percent) and lifestyles (30 percent).
When it comes to the style of posts, successful accounts for mayors appear to feature
a more personal tone rather than an official tone. In more than 50 percent of posts, these
accounts demonstrate an informal style of communication, as well as personal appeals
to citizens and emotional judgment. Successful accounts for cities also demonstrate casual
style of content and communications. In more than 50 percent of posts, these accounts
demonstrate an informal style of communication, as well as appeals to citizens, calls
to action, links to websites or events, and informal photos.
30 Smart city solutions: What drives citizen adoption around the globe?Have you visited any of your city’s social
media pages in the last 6 months?
Survey City accounts (links from official city sites),
results1, % Mayors’ accounts, ‘000 000 subscribers ‘000 000 subscribers
Jakarta 63 2.1
Shanghai 45 6.32
Mexico City 45 3.3
São Paulo 44 2.9
Barcelona 26 0.8
Seoul 26 2.4
Paris 20 3.0
New York City 19 1.2
Moscow 18 0.5
Berlin 14 0.1
Tokyo 14 0.5
London 14 3.1
Melbourne 13 0.3
Top 10 topics of posts in successful mayors’ accounts,4 Top 10 topics of posts in successful city accounts,5
median share of posts on the topic in an account median share of posts on the topic in an account
14% 13% 11% 34% 30%
Strategic Social problems City City events/holidays Lifestyle
goals and events and
voting holidays
11% 10% 10% 10% 20% 20% 20%
Economy Security World/ Culture Mobility Social Culture
country-
level issues
10% 10% 10% 9% 8% 5% 5% 5%
Emergencies Civil rights, Urban Urban Strategic Waste Sport Safety
minorities projects projects and goals and
planning voting
1 Survey results for adult population with access to Internet by McKinsey Global Institute 4 Mayor’s Twitter for London, Jakarta, Mexico City, Barcelona, Facebook for São Paulo.
2 Account in Weibo. 5 Paris Facebook, Melbourne Facebook, Shanghai Weibo.
3 Account in VK.com – the most popular social network in Russia similar to Facebook.
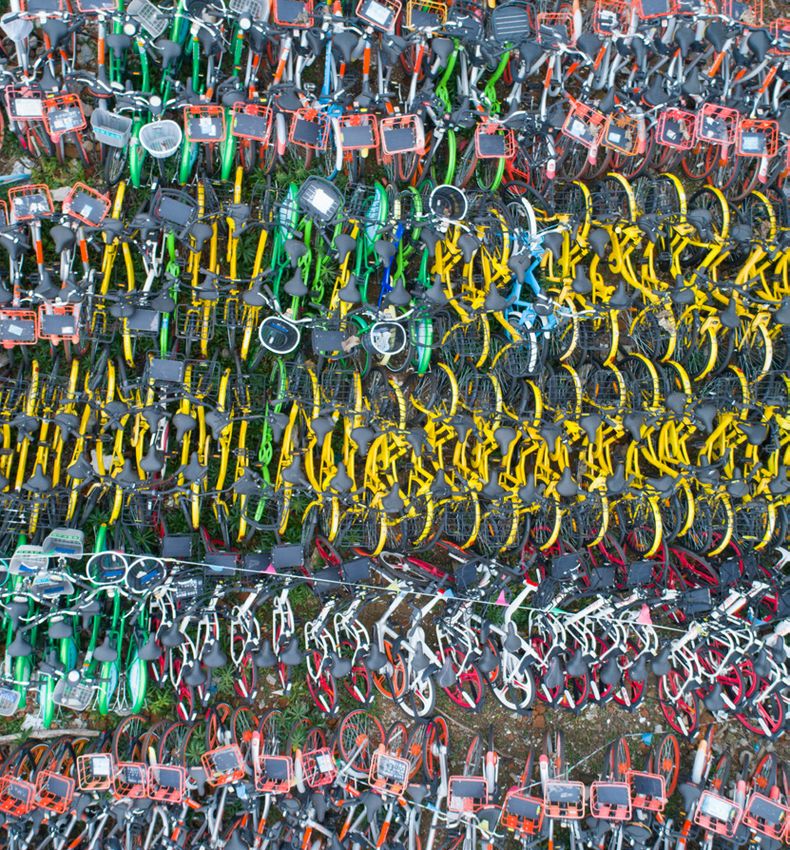
Detailed analyses of smart solutions 31Bike sharing
Bike-sharing and hiring platforms and applications give citizens convenient access
to locating, hiring, and paying for bike usage. The services can either be free floating
or station based.
We analyzed survey results, the data on the number of bikes, and the number of trips taken,
and identified two cases with widespread service adoption: Shanghai has a free-floating
model, where bikes are owned by private tech startups; and Barcelona has a government-
owned and -subsidized station-based bike-sharing service.
Average Dockless
Ever used bike sharing Trips per citizen Bikes per 1,000 annual bikes
(MGI)1, % per year citizens temperature available3
Shanghai 81 >60 64.12 17
Barcelona 31 3.0 1.3 16
Paris 30 1.8 0.8 12
New York City 25 0.7 0.6 13
Seoul 23 0.2 0.5 12
London 18 1.0 1.1 11
Moscow 14 0.1 0.2 6
São Paulo 14 0.1 0.1 20
Berlin 9 0.1 2.3 10
Tokyo 5 0.1 0.1 16
1 Have you used any of those services: bike-sharing program for short-term bike rentals?
2 Aug 2017, Shanghai municipal transportation bureau: 1,5mln sharing bikes on the streets.
3 While station-based model available in all cities in the sample.
Based on our analysis of successful cases, we uncovered important success factors
for bike-sharing services.
Bike sharing is not a major mode of transportation in most of the cities we observed. In fact,
most citizens treat bike sharing as an occasional or leisure activity, taking an average
of fewer than three trips a year.
Nevertheless, there are exceptions. Shanghai is an outstanding example of free-floating
bike-sharing service adoption, with a remarkable 7 percent modal share. This free-
floating model is the only business model that has achieved a truly widespread adoption
among citizens.
Government regulation is needed for free-floating bike sharing to prevent chaotic parking,
as well as blocking pedestrians and building exits.
32 Smart city solutions: What drives citizen adoption around the globe?Since bike sharing often serves as a means of “last mile” transportation, it spreads more quickly in urban areas where public transportation coverage is strong. Cities need to construct stands near train and bus stations. Services are also much easier to develop in urban areas with high population densities. It is easier to achieve high utilization in these areas, allowing for the potential to increase profitability and offering a return on private investments. Bikes don’t have to be expensive. Cheap bike models help to achieve higher profitability and decrease losses due to vandalism. In places where bike usage has been historically popular, citizens might be more supportive of modern bike-sharing services. In some cities with low potential for bike-sharing usage (see factors above), the scale of utilization might be naturally limited. Station-based bike-sharing services appeared in most cities five to eight years ago, while the revolutionary free-floating services came to China in the past three to four years. Their introduction was followed by a period of rapid growth. From July to December 2016, the total number of users of Ofo and Mobike grew from fewer than 10 million to around 400 million. Shanghai case Growth in bike sharing is driven by well-financed tech companies with countrywide coverage. Other factors include a historically strong bike culture, high population density, and high coverage of public transportation. Bicycles have historically been a popular means of transportation in China due to low incomes. From the 1960s through the 1970s, bikes were often given as wedding gifts, labeling China the “bicycle kingdom.” The mid-1980s saw a 60 percent modal share in Beijing, and the 1990s saw a 20 percent modal share in Guangzhou. More recently, the share of bike users declined as incomes and car ownership rose. With the advent of bike- sharing services, bike usage has rebounded in the past three to four years. Bikes are often used as last mile transportation, in combination with public transportation. Shanghai’s metro system is ranked number one in the world by operating miles (more than 600 kilometers), with around 400 stations. Around 80 percent of the trips made using this system are in the range of 1.8 to 3 kilometers, and peak usage occurs from 7:00 to 9:00 AM and 5:00 to 7:00 PM. Shanghai’s climate is relatively mild and therefore comfortable for biking. The daily mean temperature is 17°C (5°C in January, 29°C in July), which allows for year-round bikes usage. Population density is another positive factor: Shanghai’s inner core population density is around 46,100 people per square kilometer. By comparison, Manhattan has a population density of 27,000 per square kilometer, and Barcelona has 16,000 people per square kilometer. Detailed analyses of smart solutions 33
Leading bike-sharing service vendors receive financial and technological support from
                           their investors. Ofo has a capitalization of $3 billion and has so far raised nearly $1 billion of
                           investment from a reputable list of investors that includes Alibaba, an e-commerce giant.
                           Mobike’s capitalization is also around $3 billion, and it is supported by Tencent, an online
                           conglomerate with 39,000 employees.

Shanghai case:             Bikes offered by Ofo and Mobike are relatively cheap to produce: the cost of producing
stationless bike sharing
mass usage. Bikes owned    an Ofo bike is around RMB 300 ($41), and the cost of producing a Mobike Lite bike
by private tech startups   is RMB 200–500 ($30–$80).

34                         Smart city solutions: What drives citizen adoption around the globe?
You can also read