Social Media Insights During the COVID-19 Pandemic: Infodemiology Study Using Big Data
←
→
Page content transcription
If your browser does not render page correctly, please read the page content below
JMIR MEDICAL INFORMATICS                                                                                                             Tran et al

     Original Paper

     Social Media Insights During the COVID-19 Pandemic:
     Infodemiology Study Using Big Data

     Huyen Thi Thanh Tran1, MBA; Shih-Hao Lu1, PhD; Ha Thi Thu Tran2, LLM; Bien Van Nguyen3, MSc
     1
      National Taiwan University of Science and Technology, Taipei, Taiwan
     2
      Ho Chi Minh City University of Law, Ho Chi Minh, Vietnam
     3
      Dynimlabs, Oulu, Finland

     Corresponding Author:
     Shih-Hao Lu, PhD
     National Taiwan University of Science and Technology
     No 43, Keelung Rd, Sec 4, Da'an Dist
     Taipei, 106335
     Taiwan
     Phone: 886 2 2737 6735
     Fax: 886 2 2737 6360
     Email: shlu@mail.ntust.edu.tw

     Abstract
     Background: The COVID-19 pandemic is still undergoing complicated developments in Vietnam and around the world. There
     is a lot of information about the COVID-19 pandemic, especially on the internet where people can create and share information
     quickly. This can lead to an infodemic, which is a challenge every government might face in the fight against pandemics.
     Objective: This study aims to understand public attention toward the pandemic (from December 2019 to November 2020)
     through 7 types of sources: Facebook, Instagram, YouTube, blogs, news sites, forums, and e-commerce sites.
     Methods: We collected and analyzed nearly 38 million pieces of text data from the aforementioned sources via SocialHeat, a
     social listening (infoveillance) platform developed by YouNet Group. We described not only public attention volume trends,
     discussion sentiments, top sources, top posts that gained the most public attention, and hot keyword frequency but also hot
     keywords’ co-occurrence as visualized by the VOSviewer software tool.
     Results: In this study, we reached four main conclusions. First, based on changing discussion trends regarding the COVID-19
     subject, 7 periods were identified based on events that can be aggregated into two pandemic waves in Vietnam. Second, community
     pages on Facebook were the source of the most engagement from the public. However, the sources with the highest average
     interaction efficiency per article were government sources. Third, people’s attitudes when discussing the pandemic have changed
     from negative to positive emotions. Fourth, the type of content that attracts the most interactions from people varies from time
     to time. Besides that, the issue-attention cycle theory occurred not only once but four times during the COVID-19 pandemic in
     Vietnam.
     Conclusions: Our study shows that online resources can help the government quickly identify public attention to public health
     messages during times of crisis. We also determined the hot spots that most interested the public and public attention communication
     patterns, which can help the government get practical information to make more effective policy reactions to help prevent the
     spread of the pandemic.

     (JMIR Med Inform 2021;9(7):e27116) doi: 10.2196/27116

     KEYWORDS
     COVID-19; Vietnam; public attention; social media; infodemic; issue-attention cycle; media framing; big data; health crisis
     management; insight; infodemiology; infoveillance; social listening

     https://medinform.jmir.org/2021/7/e27116                                                     JMIR Med Inform 2021 | vol. 9 | iss. 7 | e27116 | p. 1
                                                                                                            (page number not for citation purposes)
XSL• FO
RenderX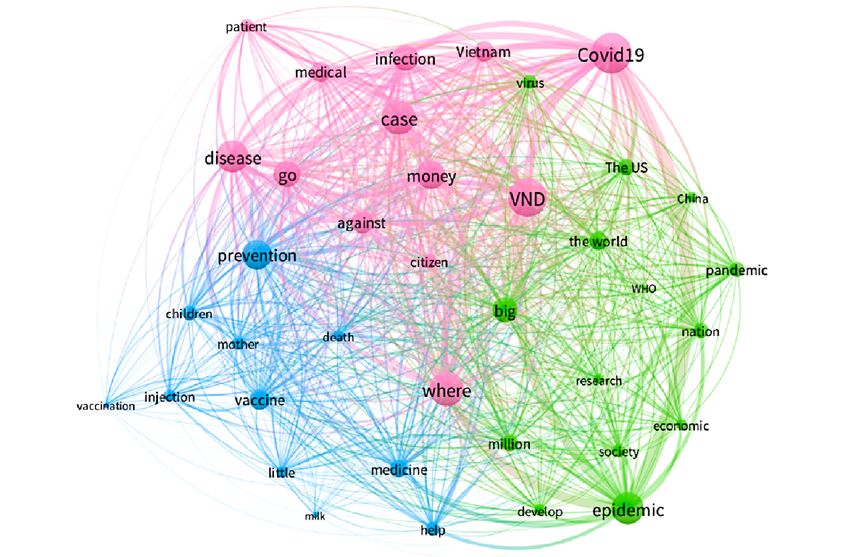
JMIR MEDICAL INFORMATICS                                                                                                                Tran et al

                                                                          COVID-19 pandemic. Another study [16] examined hot search
     Introduction                                                         lists on Sina Microblog, China’s most popular social media
     Background                                                           platform, to learn about public attention to COVID-19 in China.
                                                                          Several research papers have focused on public reaction to the
     The COVID-19 pandemic situation remains complicated, with            COVID-19 pandemic in Vietnam. Trevisan et al [17] examined
     nearly 82 million infection cases worldwide as of January 1,         the country’s reaction to and control of the pandemic; another
     2021 [1]. Due to Vietnam’s shared 1350 km land border with           study [18] described the pattern of the pandemic’s early stage
     China, it was considered at high risk of an uncontrollable           in Vietnam using a secondary data set provided by the country’s
     outbreak [2]. Yet Vietnam learned many lessons from the severe       Ministry of Health. Other researchers [19] used a survey to
     acute respiratory syndrome (SARS) epidemic when it failed to         understand COVID-19 risk perception from socioeconomic and
     properly assess the infection risk from patients coming from         media attention perspectives.
     the epidemic area for treatment at the Vietnamese French
     hospital, which triggered the SARS outbreak within its borders.      In this study, we analyze big data collected from popular online
     Ultimately, Vietnam was the first country that the World Health      sources where people obtain, create, or discuss news and
     Organization (WHO) removed from its list of those with               information in Vietnam, including Facebook, news websites,
     community SARS infections [3]. During the first wave of the          YouTube, forums, blogs, Instagram, and e-commerce sites. Data
     COVID-19 pandemic in Vietnam, the government quickly                 were collected from December 2019 to November 2020 to offer
     evaluated the novel coronavirus as a strange and dangerous           a wider view from diverse sources and a longer observation
     virus with a high transmission risk that could easily result in an   period. We analyzed this data to describe a pattern of the social
     outbreak. The Vietnamese government executed preventive              reaction during two different waves of the COVID-19 pandemic
     measures early, taking action a month before the WHO declared        in Vietnam using the issue-attention cycle and media framing
     a Public Health Emergency of International Concern. The              theories as foundations to develop our research questions.
     outcomes were impressive, as only 415 infections and no deaths       Issue-Attention Cycle Theory
     were reported between January and June 2020 [4,5]. Following
     more than 3 consecutive months without cases of community            The risk of COVID-19 infection is still high worldwide given
     spread infection, the second wave of the COVID-19 outbreak           that vaccination is not yet widely used and some countries are
     in Vietnam began when the 416th patient was declared infected        trying to resume normal commercial operations, including
     in Danang on July 25, 2020. Vietnam recorded its first               commercial flights, in an attempt to recover economically from
     COVID-19 deaths during this period [6].                              the consequences of the pandemic. The need to seek and discuss
                                                                          information during a pandemic crisis like COVID-19 is obvious.
     Pandemics are inherently negative situations; therefore,             However, many people try to simplify complex information or
     COVID-19–related news usually includes negative information          rely on their current beliefs; this may create conflict if they must
     such as infection rates, deaths, and quarantine information.         force new information into previous constructs. Facing the risk
     Being surrounded by negative information can increase negative       of illness or death, as in the COVID-19 pandemic, can change
     emotions, thereby driving perceptions of pandemic-related risk       people’s attitudes toward “accepting information, handling and
     [7,8]. Unlike the SARS epidemic in 2003, connecting with             taking action on it” [20-22]. In 1972, Downs [23] introduced
     potential medical users still mainly relies on email and personal    the issue-attention cycle theory that refers to the attention trend
     communication (rather than other internet tools) to connect with     line an environmental issue could receive from the public or
     each other and share information [9]. Many people have actively      media, as described in five main stages. In the first stage, only
     used the internet as their main source of information about the      experts or a small number of people interested in the issue are
     COVID-19 pandemic. However, the substantial amount of                aware of it. In the second stage, the issue captures more attention
     information in cyberspace may confound internet users who are        as awareness of it increases; at this stage, people are optimistic
     trying to find and correctly evaluate reliable sources. This         that the problems will be solved one way or another. The third
     potentially harmful situation is known as an “infodemic” [10],       stage is marked by chaos, which peaks when people realize the
     which the WHO [11] defines as “an overabundance of                   issues might be far different from their expectations, out of their
     information—some accurate and some not—that makes it hard            control, and present with high financial or social benefit costs.
     for people to find trustworthy sources and reliable guidance         A steady drop in public attention to the issue characterizes the
     when they need it” [12]. Therefore, understanding the dynamics       fourth stage, which is known as the postproblem phrase. The
     of public attention during a pandemic such as COVID-19 is            final stage is marked by replacement of the concerning issues
     necessary to help governments, health ministries, or health          in public attention [23].
     educators design better guidelines to promote disease prevention
     and self-protection to return to social life and the “new normal”    However, some researchers argued that the issue-attention cycle
     after resolution of the COVID-19 pandemic [13]. Previous             can differ depending upon culture [24] and in cases of epidemic
     research related to this field focused on analyzing community        hazards [25]. Moreover, the issue-attention cycle is not always
     attention on a specific social media platform that is popular in     fully integrated or fully explanatory in some health-related
     the researchers’ country or region. Abd-Alrazaq et al [14]           research, as evidenced by the “Charlie Sheen effect”
     discussed Twitter users’ top concerns during the COVID-19            phenomenon, introduced by Ayers et al [26] in 2016 when they
     pandemic by analyzing collected data in English. Ahmad and           used results from Google’s search engine data set to show the
     Murad [15] conducted an online survey on Facebook to                 correlation between actor Charlie Sheen’s disclosure of his
     determine how social media has affected people during the

     https://medinform.jmir.org/2021/7/e27116                                                        JMIR Med Inform 2021 | vol. 9 | iss. 7 | e27116 | p. 2
                                                                                                               (page number not for citation purposes)
XSL• FO
RenderX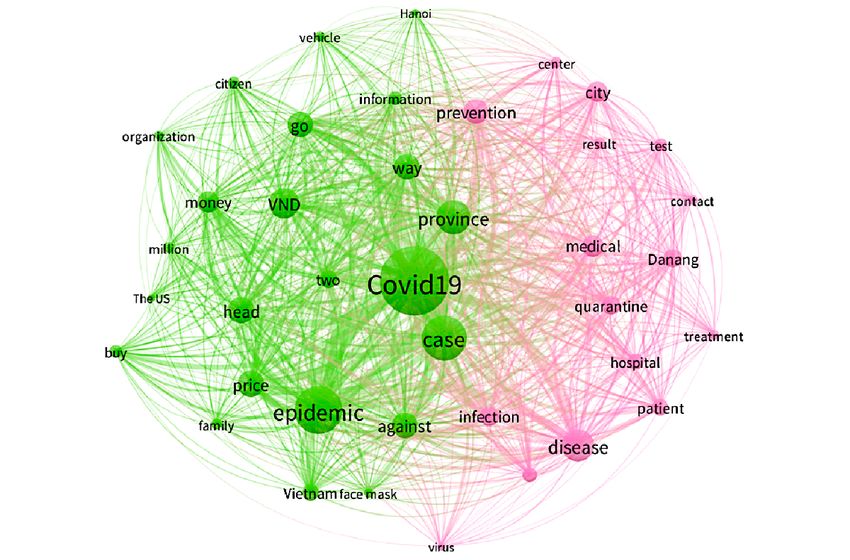
JMIR MEDICAL INFORMATICS                                                                                                                Tran et al

     HIV-positive status with the level of public attention to HIV         concept of “news,” which was once considered the product of
     and its prevention.                                                   a journalist [33]. The concept has broadened now that anyone
                                                                           can create news by uploading it to the internet in the form of
     Our study investigates public attention during the COVID-19
                                                                           pictures, text, video, etc [34]. Sometimes this news is only 140
     pandemic by examining internet discussion volume to find
                                                                           characters long [35], and its credibility depends on the number
     patterns and determine similarities or differences to the
                                                                           of interactions garnered from readers, including likes, shares,
     issue-attention cycle theory. The amount of public discussion
                                                                           and comments [36]. The nature of this news formulation and
     on social media has changed over time based on the public’s
                                                                           discourse is dynamic, so it is important to examine how frames
     response to each real event that occurred during the pandemic.
                                                                           used to report on epidemic hazards may change and develop
     Capturing the amount of public discussion not only helps to
                                                                           over time [31,37,38]. Understanding the critical role framing
     point out or compare patterns in issue-attention cycle theory
                                                                           plays in communication, scholars have monitored frames over
     but also shows how the public’s attention to specific events is
                                                                           the past decade to detect patterns in problem descriptions,
     different. From there, it is possible to help the government and
                                                                           analyze media attention, and investigate differences across forms
     stakeholders evaluate the severity of each event to the public
                                                                           of media [39]. Thus, in our study, we seek answers to the
     and from there learn lessons for possible pandemic prevention
                                                                           following questions:
     in the future. Hence, the research questions related to this theory
     are:                                                                  •   RQ5: What frames are used and how frequently are they
                                                                               used in communications that occur during the pandemic?
     •    RQ1: What is the level (volume) of public attention to
                                                                               What main topics gained the most discussion and attention
          COVID-19 in this study?
                                                                               during the COVID-19 pandemic?
     •    RQ2: What does the pattern of public attention to the
                                                                           •   RQ6: Were different types of frames used during the first
          pandemic look like?
                                                                               and second waves of the COVID-19 pandemic in Vietnam?
     Throughout the COVID-19 pandemic, a concurrent infodemic
     has bombarded the public, hindering the reception of reliable         Methods
     information sources so citizens can follow recommendations
     and protect themselves. Therefore, in addition to pointing out        All information related to COVID-19 in Vietnam was obtained
     patterns of pandemic-related discussions, it is necessary to dig      from the Ministry of Health of Vietnam’s official COVID-19
     deep into sources that get the most public attention, which can       disease page [6] and the website thuvienphapluat.vn [40], an
     help government and disease control centers stop inaccurate           electronic library of legal documents issued by the Vietnamese
     news that has reached a large number of people in a timely            government. We used this information to create a foundation
     manner. These patterns can also help identify popular public          for collecting data from social platforms and as a basis for
     channels to help legitimate agencies broadcast disease                comparison with the results obtained after data analysis.
     prevention messages more efficiently. Additionally, analyzing         Data Collection and Processing
     the public sentiment about the pandemic can help governments
     and the Centers for Disease Control and Prevention deliver more       This study aims to understand the public reaction to the
     accurate prevention messages to appease public anxiety and            COVID-19 pandemic via discussions among Vietnamese people
     insecurity. Therefore, we developed the third and fourth research     on social media. We used SocialHeat, a fee-based social
     questions:                                                            listening tool developed and sponsored by YouNet Group, to
                                                                           crawl data while following the terms of use from 7 types of
     •    RQ3: Which types of sources gained the most public               sources: Facebook, Instagram, news, blogs, forums, e-commerce
          attention and engagement during the pandemic?                    sites, and YouTube. SocialHeat collected public data on social
     •    RQ4: How did people react to the pandemic, as measured           networks in real time using COVID-19–related keywords
          by expression of their emotions on social media?                 (coronavirus, nCoV, SARS-CoV-2, COVID-19, Covid).
     Media Framing Theory                                                  Counted topics were written in Vietnamese only and pulled
                                                                           from the Facebook application programming interface (API),
     The mechanism by which individuals create a clear                     Instagram API, YouTube API, and Google API (for news, blogs,
     conceptualization or reorient their thoughts about an issue is        e-commerce, and forum websites). All data from spam and noise
     referred to as framing theory. The concept is based on the            mentions were deleted by applying deep learning and natural
     acceptance of an issue that can be presented from a number of         language processing in the SocialHeat system (the data set still
     viewpoints and is perceived as having implications for different      might contain seeding posts or brand commercial posts, but the
     principles or factors [27]. Frames matter, especially in              numbers of those posts are negligible).
     communications meant to influence an audience’s attitudes and
     behaviors. Frame use is learned and may be adopted from person        The data set was collected from December 1, 2019, to November
     to person. Previous studies have shown that politicians have          13, 2020, from 63 million Facebook IDs (pages, individual
     been inspired by the communication styles of other politicians,       profiles, and groups), 1.2 million YouTube accounts, 9000 news
     the media, or even citizens [28-30]. It is understandable that        websites, and 300 forums in Vietnam. On account of the amount
     even in conversation and discussion with others, individuals          of data and technology limitations, we divided the timeline into
     typically adopt the frames that they have learned [30-32].            7 periods to crawl data, then reconnected the data in a complete
                                                                           and continuous timeline. To divide the timeline, we relied on
     The explosive growth of information technology and social             highlighted events that took place during the period observed
     networking in the digital age has resulted in changes to the
     https://medinform.jmir.org/2021/7/e27116                                                        JMIR Med Inform 2021 | vol. 9 | iss. 7 | e27116 | p. 3
                                                                                                               (page number not for citation purposes)
XSL• FO
RenderX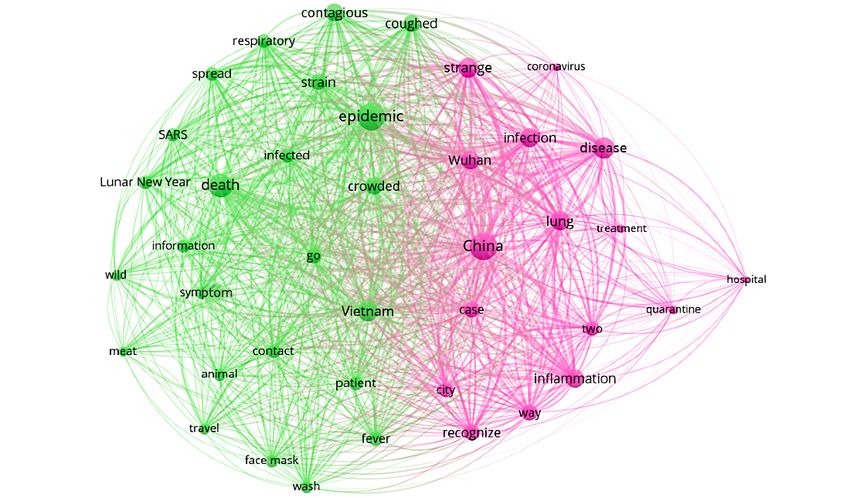
JMIR MEDICAL INFORMATICS                                                                                                                   Tran et al

     (December 1, 2019, to November 13, 2020). Specifically, we             the four main stages of the COVID-19 outbreak in Vietnam as
     used data tracking new daily infections in Vietnam, which was          described by La et al [41] (as of April 4, 2020) to inform
     updated by the Ministry of Health of Vietnam [6] and included          additional development into 7 main phases (Table 1).

     Table 1. The 7 periods of the COVID-19 pandemic in Vietnam.
      Period Date                                  Total days, n   Events
      1         Before January 23, 2020            54              No confirmed cases in Vietnam
      2         January 23 to February 26, 2020    35              First confirmed case in Vietnam; 16th infected case discharged from hospital
      3         February 27 to March 5, 2020       8               No new cases in Vietnam
      4         March 6 to March 31, 2020          26              17th infected case confirmed and more reported afterward
      5         April 1 to April 15, 2020          15              Implementation of social isolation
      6         April 16 to July 24, 2020          100             No new cases in the community
      7         July 25 to November 13, 2020       112             A new case in the community and the first deaths

                                                                            Previous studies about the information shared on social media
     Mention Trend Line                                                     by users during crisis events had different ways of classifying
     The volume of total mentions (a mention can be an original             content based on real events. For example, Vieweg [43], who
     post, a comment, or a share) about COVID-19–related topics             studies communications and behavior during mass emergencies,
     on digital channels, including Facebook, Instagram, news sites,        categorized the types of information that users create into three
     forums, blogs, etc, was tallied and expressed by day to show           main groups: social environments (eg, caution, advice, medical
     how Vietnamese citizens reacted to COVID-19                            attention, and offering help), built environment (eg,
     pandemic–related events timeline-by-timeline. This study also          infrastructure damage), and physical environment (eg, weather
     integrates the real flow of facts and disease coping measures          forecast and general information about hazards). Based on
     adopted by the government to analyze the relationship between          research of Vieweg [43], Imran et al [44] has inherited and
     government policies and peoples’ reactions during the pandemic.        continues to categorize the content collected from researching
                                                                            on social media messages related to disasters into types of
     The 500 Most Engaging Sources
                                                                            content such as caution and advice; casualties and damage;
     To explore which sources attracted the most attention and              donations of money, goods, or services; people missing, found,
     engagement, we calculated the total interactions on                    or seen; and information source. Meanwhile, Mirbabaie et al
     COVID-19–related topics across all ID sources (Facebook,               [45] studied what happened on social media during the
     YouTube, and Instagram) and unique links on news, blog,                Hurricane Harvey incident to find lessons in dealing with the
     forum, and e-commerce sites, then ranked them in order from            COVID-19 pandemic and classified the information into seven
     highest to lowest. The total interaction with an engaging source       categories based on the information gathered during the data
     equal to the total COVID-19–related posts was posted by                analysis process: official statement, news and crisis information,
     observed source, plus total likes, shares, and comments that           personal opinion, personal experience, forwarding message,
     those posts gained.                                                    solicitousness, and humor.
     Facebook is the most popular social platform in Vietnam [42].          The research on the nature of information spread about the
     It is not only popular with individuals but also used for official     COVID-19 pandemic on Weibo by Li et al [46] classified
     brand fan pages, key opinion leaders (KOLs), TV channels,              content into 7 groups based on the previous work of Rudra et
     news, and government departments that use Facebook as a                al [47] and Vieweg [43], including notifications or measures
     connecting bridge with customers, readers, citizens, etc.              taken; donating money, goods, or services; emotional support;
     Therefore, we categorized Facebook accounts into 8 clusters:           help seeking; doubt casting and criticizing; counter rumors; and
     community pages, news, TV channels, KOLs, forums, groups,              policy reaction. In the process of applying the aforementioned
     government, and unknown (minor accounts that could not be              classifications, we identified 5 types of content that appeared
     categorized into any source). Due to the limitations of hand           frequently but are not suitable for distribution into the 7 existing
     categorization, we chose only the top 500 sources by mentions          content groups, including caution and advice; international
     each period and categorized them for analysis.                         situation updates; medical issues, treatment, and vaccine; effects
     Top 50 Posts by Mentions                                               of the pandemic on the economy; and entertainment. Thus, in
                                                                            this study, the 50 posts with the most public engagement
     We analyzed top posts created during the COVID-19 pandemic
                                                                            (interaction) were categorized and sorted into 12 groups of
     to understand which topics attracted the most citizen attention
                                                                            content.
     and their associated reactions via discussion sentiment analysis.
     Top posts were COVID-19–related posts that gained the most             Sentiment Trend Line, COVID-19–Related Topics’
     mentions (shares, comments) on Facebook, Instagram, YouTube,           Keyword Frequency, and Social Networks
     news sites, blogs, e-commerce sites, and forums.                       For all COVID-19 data downloaded from Facebook, Instagram,
                                                                            news sites, forums, blogs, etc, the SocialHeat tool excluded

     https://medinform.jmir.org/2021/7/e27116                                                           JMIR Med Inform 2021 | vol. 9 | iss. 7 | e27116 | p. 4
                                                                                                                  (page number not for citation purposes)
XSL• FO
RenderX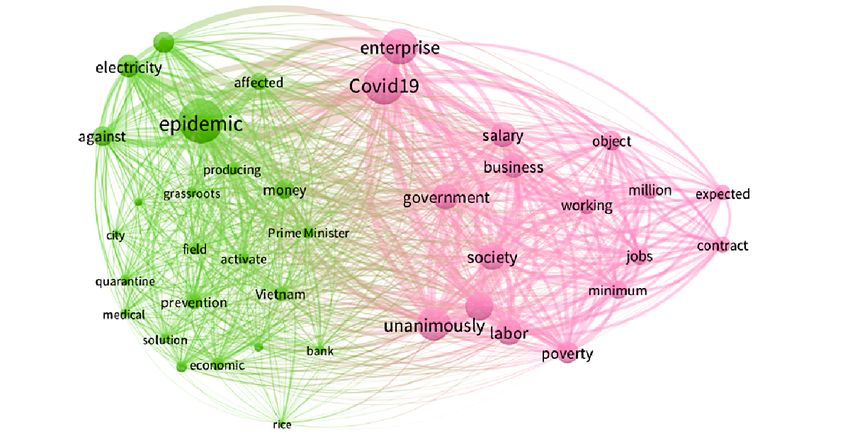
JMIR MEDICAL INFORMATICS                                                                                                              Tran et al

     noise, spam, and advertising posts before using natural language    26, 2020), public attention increased significantly when Vietnam
     software developed by the YouNet Company for sentiment              confirmed that the first COVID-19 case in the country was from
     classification and to extract the top 50 keywords’ frequency for    a Chinese traveler [50]. Period 3 (February 27, 2020, to March
     the 7 observed periods.                                             5, 2020) saw very low public attention when no new infections
                                                                         were confirmed by the government. In period 4 (March 6, 2020,
     The most frequently mentioned keywords for each period were
                                                                         to March 31, 2020), total posts peaked with more than 1.2
     analyzed and visualized using VOSviewer (Nees Jan van Eck
                                                                         million mentions about COVID-19 after the 17th case was
     and Ludo Waltman) [48]. A social network and clusters for each
                                                                         confirmed. The highest total collectible mentions (1,255,175
     period were created using the keywords matrix, in which every
                                                                         mentions) were made on March 31, one day before the
     two keywords are linked by co-occurrence frequency. In other
                                                                         Vietnamese government’s implementation of a social isolation
     words, the frequency of occurrence of two keywords in the same
                                                                         mandate throughout the country. Period 5 (April 1, 2020, to
     article will be shown through the link between two dots. The
                                                                         April 15, 2020) had a deep drop but a stable number of total
     larger the dot, the more often the keyword appears. The thicker
                                                                         and collectible mentions about COVID-19–related topics
     and closer the link between two dots (two keywords), the more
                                                                         compared to period 4. Period 6 (April 16, 2020, to July 23,
     frequency the two keywords will appear together.
                                                                         2020) had a significant steady decrease in public attention
                                                                         toward the pandemic when the government removed the social
     Results                                                             isolation order and simultaneously did not report new
     Total Discussions About COVID-19 on Social Media                    community infection cases. However, there was a small
                                                                         fluctuation indicating increased discussions starting on June 22,
     in Vietnam During the First Two Waves of the
                                                                         2020, and peaking July 1, 2020, with 320,089 discussions, due
     Pandemic                                                            to information about a COVID-19 vaccine developed in Vietnam
     There was a total of 37,917,631 collectable mentions and            that was expected to be clinically tested in humans in October
     22,652,638 posts about COVID-19 from December 1, 2019, to           or November 2020. Additionally, a suspected COVID-19
     November 13, 2020. Collectable mentions refers to mentions          infection had been discovered in Danang; public attention
     set in public mode on the online channels; therefore, only public   gradually decreased through period 7, when a community
     data was collected due to privacy settings. The data set was        infection was confirmed in Danang.
     summarized daily and put in chronological order (see
     Multimedia Appendix 1). Facebook was the channel that gained        Sources With the Most Interaction During the First
     the most mentions (27,191,922 mentions, accounting for 96.4%        Wave of the COVID-19 Pandemic in Vietnam
     of total mentions), while other channels shared the rest (forums:   Total Interactions on the Top 500 Most Engaging
     232,131 mentions; news sites: 757,582 mentions; blogs: 1058
                                                                         Sources
     mentions; reviews: 224 mentions; e-commerce sites: 2231
     mentions; YouTube: 20,599 mentions; Instagram: 1857                 As shown in Table 2, the community page sources remained
     mentions).                                                          the most popular throughout the whole period. The remaining
                                                                         interactions were split among other types of sources, including
     There was a positive correlation between total collectable          news sites, KOLs, government sites, etc.
     mentions on social media and daily new COVID-19 infection
     cases (β0=74,451.4; β1=9366.9; P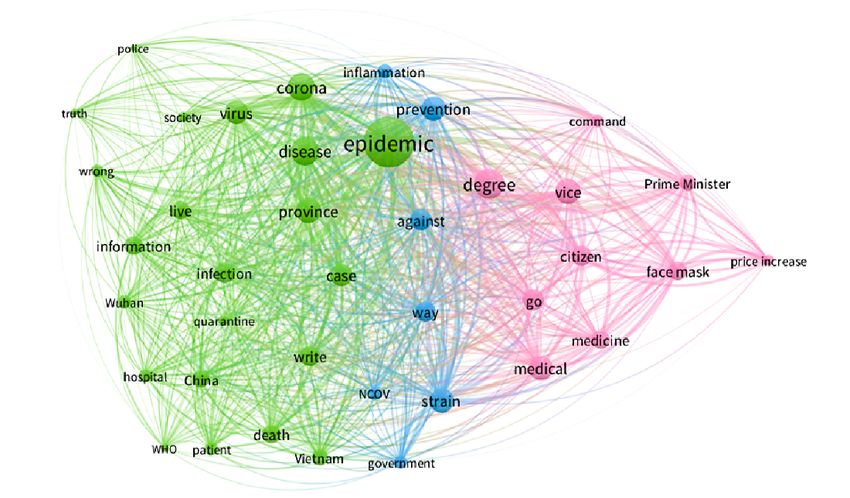
JMIR MEDICAL INFORMATICS                                                                                                                                Tran et al

     Table 2. Total reactions on the top 500 most engaging sources.
      Source                     Period 1            Period 2           Period 3           Period 4        Period 5        Period 6                   Period 7
                                 (n=265,679), n      (n=3,217,036),     (n=137,642), n     (n=39,200,553), (n=10,086,791), (n=567,114), n             (n=96,832,404),
                                 (%)                 n (%)              (%)                n (%)           n (%)           (%)                        n (%)
      Community page             63,251 (23.81)      1,600,342          50,549 (36.72)     21,392,949        4,734,704          170,131 (30.00) 42,131,669
                                                     (49.75)                               (54.57)           (46.94)                            (43.51)
      Forum                      5819 (2.19)         16,918 (0.53)      498 (0.36)         540,775 (1.38)    128,025 (1.27)     0 (0.00)              528 (0.00)
      Government                 346 (0.13)          85,434 (2.66)      0 (0.00)           1,350,699         431,201 (4.27)     98,005 (17.28)        8,340,435
                                                                                           (3.45)                                                     (8.61)
      Group                      11,934 (4.49)       266,640 (8.29)     15,806 (11.48)     3,367,923         727,409 (7.21)     38,046 (6.71)         7,794,693
                                                                                           (8.59)                                                     (8.05)
      Key opinion leaders        39,234 (14.77)      309,160 (9.61)     45,529 (33.08)     3,889,108         1,903,164          165,804 (29.24) 11,732,842
                                                                                           (9.92)            (18.87)                            (12.12)
      News                       73,982 (27.85)      346,683 (10.78) 15,043 (10.93)        3,300,849         724,832 (7.19)     63,080 (11.12)        10,681,121
                                                                                           (8.42)                                                     (11.03)
      TV channel                 65,330 (24.59)      359,969 (11.19) 3863 (2.81)           4,107,847         1,384,393          26,499 (4.67)         16,057,180
                                                                                           (10.48)           (13.72)                                  (16.58)
      Unknown                    5783 (2.18)         231,890 (7.21)     6354 (4.62)        1,250,403         53,063 (0.53)      5549 (0.98)           93,936 (0.10)
                                                                                           (3.19)

                                                                                         As can be seen from Table 3, government sources were leading
     The Average Interaction on the Top 500 Most Engaging                                in periods 2, 4, 5, and 6 with nearly 32% to 67% of the average
     Sources                                                                             interactions for the top 500 most engaging sources. News and
     Total interactions on the most engaging sources were calculated                     TV channel sources alternated in the second position in periods
     by summarizing the number of each source’s COVID-19–related                         1 and 6 and periods 2, 3, 4, and 5 (TV channels). Period 7 was
     posts, likes, shares, and comments. We analyzed the average                         unique in that KOLs received the highest average engagement
     interaction on the top 500 most engaging sources to understand                      (2,330,684/3,745,249, 62.23%), followed by news from
     the efficiency of each COVID-19–related post created by each                        community sites (861,254/3,745,249, 23%).
     source.

     Table 3. The average interaction on the top 500 most engaging sources.
      Sources                        Period 1          Period 2            Period 3        Period 4            Period 5            Period 6              Period 7
                                     (n=10,167), n     (n=102,421), n      (n=3184), n (%) (n=1,111,044),      (n=645,151), n      (n=12,802), n         (n=3,745,249),
                                     (%)               (%)                                 n (%)               (%)                 (%)                   n (%)
      Community page                 427 (4.20)        5443 (5.31)         468 (14.70)       74,540 (6.71)     16,327 (2.53)       915 (7.15)            861,254
                                                                                                                                                         (23.00)
      Forum                          1940 (19.08)      5639 (5.51)         249 (7.82)        90,129 (8.11)     32,006 (4.96)       0 (0.00)              528 (0.01)
      Government                     346 (3.40)        42,717 (41.71)      0 (0.00)          450,233 (40.52) 431,201 (66.84) 4900 (38.28)                321,134
                                                                                                                                                         (8.57)
      Group                          385 (3.79)        5442 (5.31)         368 (11.56)       57,083 (5.14)     13,989 (2.17)       865 (6.76)            87,847
                                                                                                                                                         (2.35)
      Key opinion leaders            162 (1.59)        3964 (3.87)         149 (4.68)        54,015 (4.86)     17,954 (2.78)       825 (6.44)            2,330,684
                                                                                                                                                         (62.23)
      News                           2000 (19.67)      11,556 (11.28)      1003 (31.50)      94,310 (8.49)     25,887 (4.01)       2426 (18.95)          67,245
                                                                                                                                                         (1.80)
      TV channel                     4666 (45.89)      17,998 (17.57)      644 (20.23)       228,214 (20.54) 81,435 (12.62)        2409 (18.82)          75,552
                                                                                                                                                         (2.02)
      Unknown                        241 (2.37)        9662 (9.43)         303 (9.52)        62,520 (5.63)     26,352 (4.08)       462 (3.61)            1005 (0.03)

                                                                                         onward, the diversity of content types increased to include
     Top Posts About COVID-19 Topics With the Most                                       caution and advice, policy reaction, and international situation
     Comments or Shares                                                                  updates (Table 4).
     The type of COVID-19–related content that received the most
     attention varied from time to time. Starting from phase 2

     https://medinform.jmir.org/2021/7/e27116                                                                        JMIR Med Inform 2021 | vol. 9 | iss. 7 | e27116 | p. 6
                                                                                                                               (page number not for citation purposes)
XSL• FO
RenderX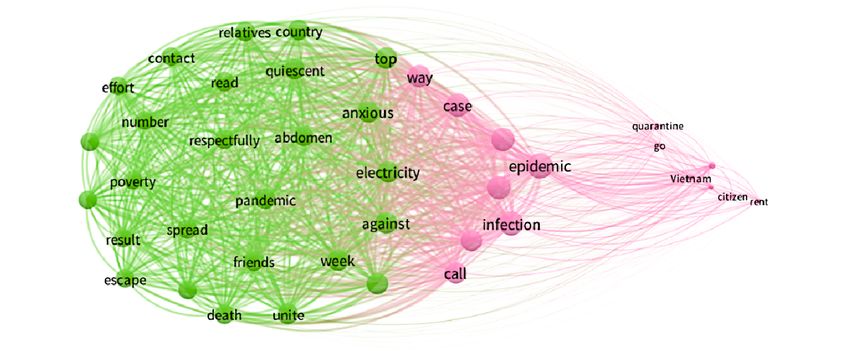
JMIR MEDICAL INFORMATICS                                                                                                                            Tran et al

     Table 4. Top posts with the most comments or shares.
      Categories                 Period 1         Period 2         Period 3          Period 4         Period 5             Period 6               Period 7
                                 (n=49,480), n    (n=337,865), n   (n=24,173), n     (n=1,375,260),   (n=312,851), n       (n=986,403), n         (n=9,161,011),
                                 (%)              (%)              (%)               n (%)            (%)                  (%)                    n (%)
      Caution and advice         27,607 (55.79)   28,869 (8.54)    0 (0.00)          191,017 (13.89) 28,067 (8.97)         129,076 (13.09) 347,096 (3.79)
      Notifications or mea- 7116 (14.38)          13,222 (3.91)    2229 (9.22)       162,502 (11.82) 0 (0.00)              23,978 (2.43)          2,120,104
      sures have been taken                                                                                                                       (23.14)
      Donation money,            0 (0.00)         0 (0.00)         0 (0.00)          12,167 (0.88)    4982 (1.59)          89,919 (9.12)          1,477,020
      goods, or services                                                                                                                          (16.12)
      Emotional support          0 (0.00)         0 (0.00)         4905 (20.29)      328,056 (23.85) 153,652 (49.11) 195,632 (19.83) 970,817 (10.60)
      Help seeking               0 (0.00)         0 (0.00)         0 (0.00)          9045 (0.66)      0 (0.00)             0 (0.00)               133,675 (1.46)
      Doubt casting and          0 (0.00)         112,297 (33.24) 3284 (13.59)       186,581 (13.57) 2537 (0.81)           0 (0.00)               666,394 (7.27)
      criticizing
      Counter rumors             0 (0.00)         55,397 (16.40)   0 (0.00)          0 (0.00)         0 (0.00)             0 (0.00)               0 (0.00)
      Policy reaction            1226 (2.48)      116,869 (34.59) 11,642 (48.16)     289,200 (21.03) 112,505 (35.96) 0 (0.00)                     1,132,238
                                                                                                                                                  (12.36)
      International situation 13,531 (27.35)      11,211 (3.32)    1678 (6.94)       196,692 (14.30) 11,108 (3.55)         107,243 (10.87) 100,369 (1.10)
      updating
      Medical issues: treat-     0 (0.00)         0 (0.00)         0 (0.00)          0 (0.00)         0 (0.00)             432,389 (43.83) 0 (0.00)
      ment, vaccine
      Effects of the pandem- 0 (0.00)             0 (0.00)         435 (1.80)        0 (0.00)         0 (0.00)             8166 (0.83)            0 (0.00)
      ic on the economy
      Entertainment              0 (0.00)         0 (0.00)         0 (0.00)          0 (0.00)         0 (0.00)             0 (0.00)               2,213,298
                                                                                                                                                  (24.16)

     In period 1, when the first COVID-19 cases were found in                      the most attention (432,389/986,403, 43.87%) followed by
     Wuhan and had not yet spread to Vietnam, it is understandable                 emotional support (195,632/986,403, 19.87%). When
     that content concerning caution and advice received the most                  community cases reappeared and though there were more
     attention, accounting for 55.8% (27,607/49,480). Content about                COVID-19 deaths in Vietnam, peoples’ response was quite
     international updates was next, accounting for 27.3%                          optimistic, with attention almost equally divided between the
     (13,531/49,480). In period 2, when Vietnam confirmed that two                 topics of entertainment (2,213,298/9,161,011, 24.3%) and
     Chinese tourists were infected with COVID-19 and that these                   notifications or measures being taken (2,120,104/9,161,011,
     were the first two cases of COVID-19 to appear in Vietnam,                    23.2%).
     articles regarding policy reaction were of most interest,
     accounting for 34.6% (116,869/337,865); content about doubt
                                                                                   Sentiment
     casting and criticizing received almost equal attention,                      After all text data related to COVID-19 was crawled, it was
     accounting for 33.2% (112,297/337,865). In the third stage                    processed by a sentiment analysis tool developed by SocialHeat.
     when Vietnam had no community cases, people remained                          All discussions were evaluated and sorted into one of three
     interested in topics classified as policy reaction (11,642/24,173,            emotional categories, positive, negative, and neutral, based on
     48.2%) and began to pay attention to content on emotional                     natural language. In general, we found that people’s emotions
     support (4905/24,173, 20.3%). During phase 4, as community                    when discussing COVID-19–related topics fluctuate and are
     cases peaked and new infections were recorded, people were                    unstable. Emotional neutrality almost always took first place.
     most interested in the topic of emotional support                             This is understandable because sources from government
     (328,056/1,375,260,        23.9%)       and     policy     reaction           organizations and especially television and newspapers are
     (289,200/1,375,260, 21%). This was also the period when                       expected to report “independent, reliable, accurate, and
     interest was shared between the greatest variety of content types             comprehensive information” [33]. However, in various time
     with fairly similar distribution. In period 5, when the Vietnamese            periods, negative and positive emotions alternated in second
     government applied a social isolation mandate, people were                    place. Positive emotions were expressed more often than
     most concerned with emotional support (153,652/312,851,                       negative emotions during the first and last periods. Negative
     49.17%) and policy reaction (112,505/312,851, 36.7%). During                  emotions were expressed more than positive ones; most appear
     period 6, when Vietnam enjoyed 100 days of peace without                      throughout stages of Vietnam’s first COVID-19 wave (periods
     news of community spread, articles on medical issues received                 2, 3, 4, 5, and 6; see Figure 1).

     https://medinform.jmir.org/2021/7/e27116                                                                    JMIR Med Inform 2021 | vol. 9 | iss. 7 | e27116 | p. 7
                                                                                                                           (page number not for citation purposes)
XSL• FO
RenderX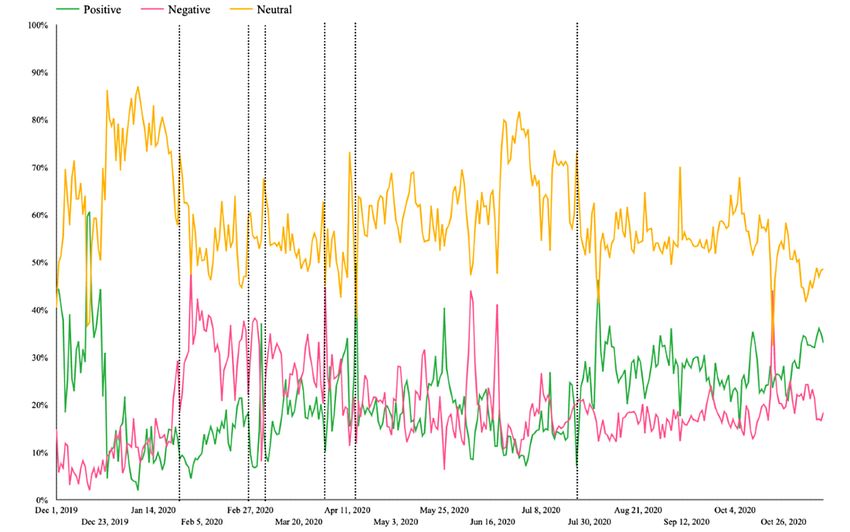
JMIR MEDICAL INFORMATICS                                                                                                                   Tran et al

     Figure 1. Sentiment trend line from December 1, 2019, to November 13, 2020.

     During period 1, when Vietnam had not yet recorded any cases            Top Keywords’ Frequency and Social Network
     and the pandemic situation had just begun in China, people              Analysis of Discussions on the Internet During the
     learned about COVID-19 through information from the Ministry            COVID-19 Pandemic in Vietnam
     of Health and the press, so their mentality was still stable and
     optimistic. In period 2, when the first cases were discovered in        Top Keywords
     Vietnam, people become more confused and worried. In period             The top 50 keywords were compiled and ranked in order from
     3, negative emotions exploded when patient 17 was confirmed             all discussions on the COVID-19 pandemic topic gathered
     and there was a risk of community disease spread. Anger, blame,         during the study period. However, of the top 50, many keywords
     and anxiety were evident through the negative emotions                  are synonyms, so we have grouped them into 36 keywords. The
     expressed in the text lines discussed on social networks at that        content of the top keywords was related to 4 main groups,
     time. In period 7 when Vietnam experienced its second wave              including COVID-19 pandemic and epidemic outbreaks
     of COVID-19 with the re-emergence of community infection                expressed through keywords such as epidemic, COVID-19,
     and the first recorded COVID-19 deaths, the optimism shown              Vietnam, case, Danang, Hanoi, and Bach Mai hospital; policy
     through positive emotions overwhelms the negative emotions              reactions as shown through words including quarantine, against,
     expressed during this period. People have gradually adapted to          prevention, mask, province, and government; medical issues
     the pandemic after experiencing the first wave and have                 expressed through patient, hospital, test, contact, infected, virus,
     confidence in the government’s ability to control the pandemic;         and treatment; and disease situation in the world through words
     positive signals that a Vietnamese COVID-19 vaccine would               like situation, the United States, and money (see Table 5).
     soon enter the human testing phase may have also contributed
     to the positive outlook [51].

     https://medinform.jmir.org/2021/7/e27116                                                           JMIR Med Inform 2021 | vol. 9 | iss. 7 | e27116 | p. 8
                                                                                                                  (page number not for citation purposes)
XSL• FO
RenderX
JMIR MEDICAL INFORMATICS Tran et al
Table 5. Top 36 keywords for COVID-19–related topics during the COVID-19 pandemic in Vietnam from December 1, 2019, to November 13, 2020.
Rank Word Frequency, n
1 epidemic 16,373,688
2 COVID-19 10,720,319
3 patient 9,838,764
4 quarantine 9,783,246
5 medical 9,349,795
6 go 8,428,703
7 hospital 8,257,058
8 Vietnam 7,789,027
9 case 7,643,082
10 disease 6,397,632
11 Danang 5,621,518
12 against 5,208,937
13 city 5,066,441
14 infected 4,734,692
15 virus 4,099,245
16 situation 3,950,498
17 information 3,854,982
18 province 3,850,230
19 prevention 3,692,883
20 citizen 3,357,150
21 mask 3,316,868
22 way 3,310,041
23 test 2,784,690
24 contact 2,764,565
25 government 2,705,459
26 Hanoi 2,422,218
27 family 2,366,785
28 money 2,177,978
29 coronavirus 2,039,959
30 The US 1,903,865
31 vehicle 1,842,155
32 result 1,821,271
33 treatment 1,790,499
34 Bach Mai hospital 1,663,212
35 together 1,654,416
36 get sick 1,475,917
(frequency) that keyword possessed. The thicker and closer the
Social Network Co-occurrence of the 7 Periods link between two keywords, the more frequently both keywords
To better understand the context behind the most mentioned appear.
keywords and to highlight the top concerns about the COVID-19
pandemic expressed in internet discussions in each period in The relationship between the top keywords in period 1 when
Vietnam, we extracted the top 50 keywords for each stage and no infections were found in Vietnam is shown in Figure 2. The
visualized the associations between the keywords using most prominent keywords were “China,” “epidemic,” “death,”
VOSviewer software. The larger the dots, the more weight “disease,” “strange,” “Wuhan,” and “inflammation.” The pink
https://medinform.jmir.org/2021/7/e27116 JMIR Med Inform 2021 | vol. 9 | iss. 7 | e27116 | p. 9
(page number not for citation purposes)
XSL• FO
RenderXJMIR MEDICAL INFORMATICS Tran et al
color cluster reflects the first awareness of COVID-19 infections “death,” “meat,” “wild,” “travel,” “respiratory,” etc, along with
in Wuhan, China at that time, as reflected by words including keywords that guide how to proactively prevent epidemics,
“China,” “Wuhan,” “strange,” “lung,” “coronavirus,” especially during the Lunar New Year period, including “face
“quarantine,” etc. The green cluster represents the first mask,” “wash,” “go,” “travel,” “Lunar New Year,” “crowded,”
information about COVID-19 that was communicated by the etc.
Vietnamese government to the people, and includes “epidemic,”
Figure 2. Co-occurrences of the top keywords in period 1. SARS: severe acute respiratory syndrome.
In period 2 (Figure 3), the most prominent keyword is spreading more widely, including keywords “epidemic,” “do
“epidemic,” followed by the words “corona,” “disease,” not,” “starveling,” “quarantine,” “case,” etc.
“degree,” “prevention,” and “virus,” which reflect the public’s
Period 4 (Figure 5) was the peak of the pandemic in Vietnam
anxious reaction and the government’s quick policy response
after confirmation of the 17th infection case, with more reported
when the first two cases were found in Vietnam. The green
afterward; the most prominent keyword was “disease,” followed
cluster illustrates epidemic situation updates in China and the
by words like “quarantine,” “medical,” “province,” “case,” and
first 2 cases in Vietnam with keywords like “epidemic,”
“prevention.” To prevent the spread of the pandemic, Vietnam’s
“corona,” “virus,” “infection,” “disease,” “province,” and
government provided solutions for pandemic prevention such
“information.” The blue cluster represents the government’s
as quarantine, temporary suspension of visas for all citizens of
epidemic prevention plan through the keywords “inflammation,”
other countries who wanted to enter Vietnam, except for special
“government,” “against,” “prevention,” and “NCOV.” The pink
cases. The government also introduced a health declaration app
cluster reflects when the prime minister issued a directive to
for those wishing to enter Vietnam at that time, along with the
sanction drugstores, which increased mask prices, as reflected
NCOVI app, which offers the public a reliable channel for
in the keywords “vice,” “prime minister,” “command,” “face
information about COVID-19 and helps the government expedite
mask,” “price increase,” etc.
contact tracing. The green cluster represents the policy reaction
Period 3 (Figure 4) was a short period prior to the pandemic’s aspect, as expressed with keywords like “government,” “prime
peak in Vietnam during which no new cases were found. During minister,” “command,” “prevention,” “face mask,” “against,”
this period, the keywords had almost the same weight. The most and “solution.” The pink cluster contained keywords related to
prominent keywords were still “epidemic,” followed by the epicenter of the pandemic at Bach Mai hospital in Hanoi,
“starveling,” “infection,” “do not,” “case,” etc. The green cluster such as “disease,” “Bach Mai hospital,” “Hanoi,” “case,”
shows the respect for frontline workers’ efforts and calls for “infection,” “patient,” “staff,” “test,” and “contact.” The blue
national spirit and unity to fight the pandemic via keywords cluster represents the challenge of medical isolation through
including “regroup,” “respectfully,” “effort,” “quiescent,” two keywords: “quarantine” and “medical.”
“country,” “history,” “beaten,” etc. The pink cluster represents
During period 5 (Figure 6), the social isolation stage, the most
people’s cooperation with the government’s pandemic policy
prominent keywords were “epidemic,” “COVID-19,”
reaction, in particular quarantine. People called on each other
“enterprise,” “unanimously,” etc. The green cluster represents
to actively coordinate to isolate and prevent the epidemic from
https://medinform.jmir.org/2021/7/e27116 JMIR Med Inform 2021 | vol. 9 | iss. 7 | e27116 | p. 10
(page number not for citation purposes)
XSL• FO
RenderXJMIR MEDICAL INFORMATICS Tran et al
the policy reaction aspect, in particular medical issues and “bank,” “electricity,” “rice,” etc. The pink cluster represents
economic solutions, such as supporting businesses and people the economic concerns, as expressed by keywords including
working in production and consumption. Representative “enterprise,” “salary,” “business,” “labor,” “working,” “jobs,”
keywords included “prime minister,” “economic,” “solution,” “contract,” “society,” “poverty,” etc.
Figure 3. Co-occurrences of the top keywords in period 2. WHO: World Health Organization.
Figure 4. Co-occurrences of the top keywords in period 3.
https://medinform.jmir.org/2021/7/e27116 JMIR Med Inform 2021 | vol. 9 | iss. 7 | e27116 | p. 11
(page number not for citation purposes)
XSL• FO
RenderXJMIR MEDICAL INFORMATICS Tran et al
Figure 5. Co-occurrences of the top keywords in period 4.
Figure 6. Co-occurrences of the top keywords in period 5.
The most prominent keywords in period 6 (Figure 7) included diseases in young children, which was reflected in online public
“COVID-19,” “disease,” “epidemic,” “case,” “prevention,” etc. discussions. In addition, the public also paid more attention to
This was the period when Vietnam controlled the epidemic well, pandemic prevention developments in Vietnam and the
with the result that there were no cases of community spread pandemic situation worldwide. The green cluster represents the
infection. People began to pay more attention to the challenge global disease situation with keywords like “the US,” “China,”
of COVID-19 vaccine research and development in Vietnam, “epidemic,” “pandemic,” “WHO,” “research,” and “economic.”
which coincided with the period of vaccination against common The pink cluster shows continued interest in COVID-19 cases
https://medinform.jmir.org/2021/7/e27116 JMIR Med Inform 2021 | vol. 9 | iss. 7 | e27116 | p. 12
(page number not for citation purposes)
XSL• FO
RenderXJMIR MEDICAL INFORMATICS Tran et al
and defense against disease in Vietnam via keywords such as public was most interested in two major topics. The first was
“COVID-19,” “disease,” “go,” “where,” “infection,” “medical,” the situation surrounding the Danang outbreak, which created
and “against.” The blue cluster represents concerns about the second pandemic wave in Vietnam (pink cluster). Keywords
vaccinating children against common diseases during the illustrating this event included “Danang,” “city,” “hospital,”
COVID-19 pandemic through keywords such as “vaccination,” “infection,” “test,” “quarantine,” etc. The second was concern
“injection,” “children,” “prevention,” “death,” “mother,” and about common issues related to COVID-19, such as raising the
“help.” price of masks and information about preventing community
disease spread (eg, finding people who would share a bus ride
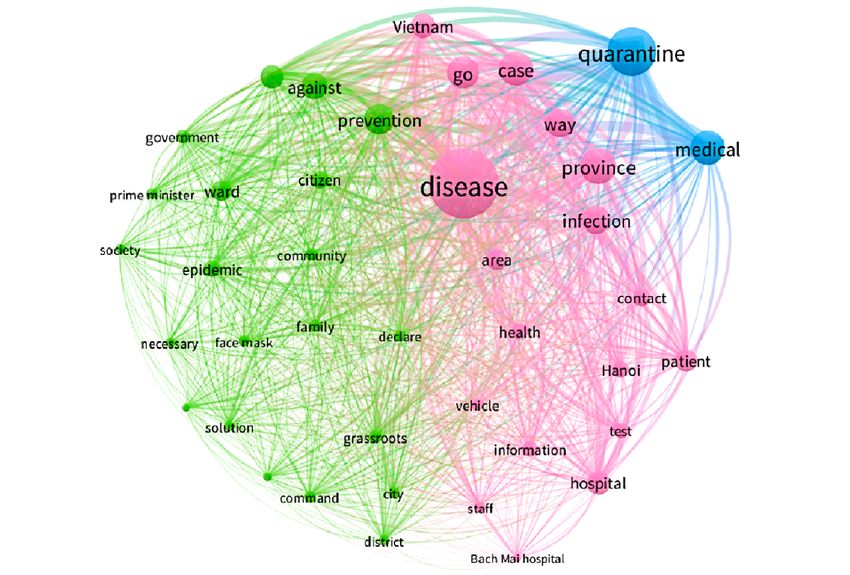
The most prominent keyword in Vietnam during period 7
with patients who were infected; green cluster). Keywords
(Figure 8) was “COVID-19,” followed by words like
included “Covid-19,” “price,” “face mask,” “Vietnam,”
“epidemic,” “case,” “province,” and “disease.” This period was
“against,” “epidemic,” “vehicle,” “go,” and “Hanoi.”
marked by the re-emergence of cases in the community, so the
Figure 7. Co-occurrences of the top keywords in period 6. WHO: World Health Organization. VND: Vietnamese Dong.
https://medinform.jmir.org/2021/7/e27116 JMIR Med Inform 2021 | vol. 9 | iss. 7 | e27116 | p. 13
(page number not for citation purposes)
XSL• FO
RenderXJMIR MEDICAL INFORMATICS Tran et al
Figure 8. Co-occurrences of the top keywords in period 7.
to an entirely new crisis in particular. Based on the results of
Discussion this study, governments could use it as a reference to evaluate
Main Findings the efficiency of using big data to address public health
management issues. This resource not only can be used as a
The COVID-19 pandemic is a sensitive time, and the need for reference to deal with future epidemic crises but also is a
reliable sources to avoid an infodemic is understandable. valuable comparison of public reaction toward the pandemic
Analyzing the public’s responses to the pandemic through cyber across countries.
discussions can provide an overview of the pandemic’s impact
on the public. In this study, we found four main conclusions Public Discussions on the Topic of COVID-19 on Social
that answered six research questions. First, based on the Media
changing discussion trends gathered on the subject of The volume of public attention during the COVID-19 pandemic
COVID-19, 7 periods were determined based on events that can was substantial, with a total of 37,917,631 public mentions and
be further aggregated into two pandemic waves in Vietnam. 22,652,638 public posts during the research observation period
Second, people engaged most with community pages on from December 1, 2019, to November 13, 2020. During the
Facebook. However, the sources with the highest average peak period, we recorded more than 1,255,175 publicly
interaction efficiency per article were government sources. discussed mentions showing particular interest in the pandemic;
Third, people’s attitudes when discussing the pandemic shifted these mentions also demonstrated that the amount of
from expressing negative to positive emotions (expression of pandemic-related information generated by the public is
neutral emotions remained stable). Fourth, the type of content substantial. This can inadvertently create an information matrix
that attracts the most interaction from people varies from time or infodemic for people who feel confident in their abilities to
to time. Beyond that, we found that the issue-attention cycle search for information on the internet and who tend to trust the
occurred four times during the two COVID-19 pandemic waves opinions of others.
in Vietnam. In each COVID-19 wave, the issue-attention cycle
occurred twice, with a small cycle first, followed by a big cycle Issue-Attention Cycles Occurring During the COVID-19
later. Pandemic
Listening to people’s attitudes during a pandemic as expressed During the two COVID-19 pandemic waves in Vietnam from
through their interactions on the internet can help governments December 2019 to November 2020, the pattern of public
and related agencies quickly adjust communication plans to attention looks similar to the issue-attention cycle described by
lead people through the pandemic with better precision. This Downs [23]. However, instead of only 1 cycle per pandemic
study provides valuable information to those concerned about wave, each pandemic wave had up to 2 cycles, with a smaller
the COVID-19 pandemic in general and the public’s response cycle occurring before the larger one. Moreover, a remarkable
https://medinform.jmir.org/2021/7/e27116 JMIR Med Inform 2021 | vol. 9 | iss. 7 | e27116 | p. 14
(page number not for citation purposes)
XSL• FO
RenderXJMIR MEDICAL INFORMATICS Tran et al
point is that the issue-attention cycles that occurred during the information about cautions and advice and international
COVID-19 pandemic did not represent the main issue (the situation updates got the most attention. Negative emotions
pandemic) but rather showed the subissues (real events) related were just beginning to be expressed and did not prevail.
to the main issue. Moreover, the last stage of each cycle was a However, negative emotions gradually increased when cases
transition between cycles. This means the last stage of this cycle first appeared in Vietnam, and articles about policy reaction
may be the first stage of the cycle that occurs after it. gained the most attention, followed by doubt casting and
criticizing articles. During the peak of the first pandemic wave,
When the first COVID-19 cases were discovered in Wuhan,
negative emotions peaked as well, but the public still paid the
China, people were not too concerned about this strange disease,
most attention to policy reactions and the emotional support
despite the attention given to it by the Vietnamese government,
articles. The desire for negative emotions to subside was shown
especially the Ministry of Health and related agencies. However,
by the public giving the most attention to emotional support
when Vietnam saw its first cases of infection, people began to
articles in addition to articles about policy reaction and medical
pay more attention. Anxiety peaked when people became aware
issues. Although negative emotions persisted in the second wave
that this is a dangerous, contagious, potentially fatal disease
of the pandemic in Vietnam, articles related to entertainment
and that there was no vaccine yet. The situation was eased when
gained the most attention. This shows the public’s optimism
the government’s pandemic prevention responses were effective.
during the crisis, as they have experienced the first wave of
During the second COVID-19 pandemic wave in Vietnam, epidemics in the past and have hopes of a new normal life to
people remained interested in the pandemic but discussed it less come with the expectation of mass vaccine distribution next
on social networks. Public attention peaked with the first year.
COVID-19–related deaths in Vietnam. Public attention then
quickly dropped and diverted to other issues. This shows that
Limitations
although the second COVID-19 pandemic wave in Vietnam This study has some limitations. First, despite using big data to
appeared to have a more negative factor (the first recorded analyze the phenomenon of public reaction toward the
deaths), the public’s attitude was not as intense as it had been COVID-19 pandemic, some noise or spam remains in the data
during the first COVID-19 pandemic wave. This may be set; the SocialHeat tool could not completely filter these out
explained by people’s acceptance of the fact that death is a due to technology limitations and the complexities of natural
foreseeable outcome for patients infected with COVID-19 and language. Though natural language has been applied and
at the same time an expression of not feeling surprised after 6 innovated daily in SocialHeat’s tool, some texts or paragraphs
months living through the pandemic. containing incorrect grammar, teen code, dialects, etc, could
not be processed or categorized. It is also important to note that
The Most Engaging Sources During the COVID-19 although the data set was pulled from diverse sources like
Pandemic Facebook, YouTube, news sites, etc, the observed format was
Per our data analysis, community pages on Facebook received text only. This means that other formats such as video with text
the most total interaction from the public, likely because these or audio captions or images with textboxes were not analyzed
aggregate information for the community with diverse content by the SocialHeat tool. Hence, this led to a shortage in the final
types. Each of these news sites usually post multiple articles data set results such as sentiments categorized, extracted top
per day on the same COVID-19 topic. However, in terms of sources, and extracted top posts.
average efficiency per article, government-controlled news sites Additionally, due to privacy policies, the data set can only
outperformed other news sources. Drawing from this conclusion, collect data that is installed in public mode, especially for data
we recommend that the government increase the number of obtained from social networking platforms like YouTube,
articles posted to sources under its control to achieve the greatest Instagram, and Facebook. Moreover, because the data collection
dissemination of information to the community. In addition, the time is quite long (11 months), the amount of data poured into
government can also coordinate with sources such as community the system is large and requires a substantial amount of time
pages and KOLs’ pages to quickly, accurately, and easily for the system to process noise and spam, and give statistical
distribute disease information to the public. results. This led to a situation in which we wanted to analyze
Through our analysis, the frames of communication (top posts the top posts by mentions in depth, but often encountered links
that gained the most interaction) can be used to explain public that no longer worked because the owner of the post had
sentiment about the COVID-19 pandemic. We categorized changed the view mod from public to friends or private, or even
COVID-19 topics garnering top public interest into 12 deleted the post. This caused difficulties and data deficiencies
categories, based on the adoption of 7 types of COVID-19 in our analysis.
information described by Li et al [46] and simultaneously Finally, we have almost 38 million data in total, which the
developed 6 additional content type categories based on our system could not process all at once due to technical limitations.
data analysis processing. These categories included caution and Therefore, we could not extract top posts by mentions, top
advice; notifications or measures taken; donation of money, sources by mentions, or overall sentiment of all sources.
goods, or services; emotional support; help seeking; doubt
casting and criticizing; counter rumors; policy reaction; Future Work
international situation updates; medical issues, treatment, or The topics discussed on the COVID-19 issue are varied. The
vaccines; effects of the pandemic on the economy; and classification of content groups as we propose in the study is
entertainment. When the pandemic first started in China,
https://medinform.jmir.org/2021/7/e27116 JMIR Med Inform 2021 | vol. 9 | iss. 7 | e27116 | p. 15
(page number not for citation purposes)
XSL• FO
RenderXYou can also read