SOCIOECONOMIC IMPLICATIONS AND PROTECTION STRATEGIES OF FLOODING IN PRAGUE, CZECH REPUBLIC
←
→
Page content transcription
If your browser does not render page correctly, please read the page content below
SOCIOECONOMIC IMPLICATIONS AND PROTECTION

STRATEGIES OF FLOODING IN PRAGUE, CZECH REPUBLIC

                                by

                         Audrey Spiegel

                       In Partial Fulfillment
              of the Requirements for the Degree of
            Master of City and Regional Planning in the
              School of City and Regional Planning

                 Georgia Institute of Technology
                           May 2014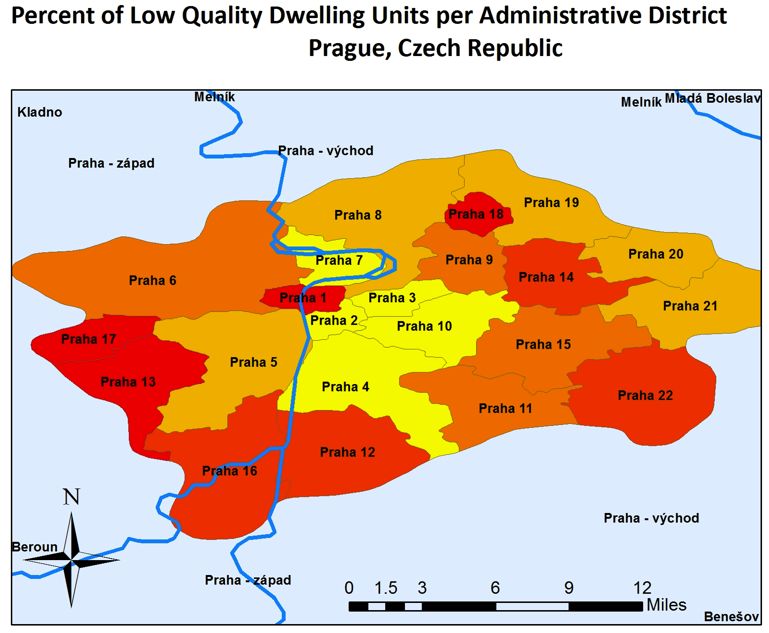
SOCIOECONOMIC IMPLICATIONS AND PROTECTION

STRATEGIES OF FLOODING IN PRAGUE, CZECH REPUBLIC

                   Approved by:

                   Dr. Bruce Stiftel, Advisor
                   School of City and Regional Planning
                   Georgia Institute of Technology

                   Date Approved: [Date Approved by Committee]
SOCIOECONOMIC IMPLICATIONS AND PROTECTION

STRATEGIES OF FLOODING IN PRAGUE, CZECH REPUBLIC
iv
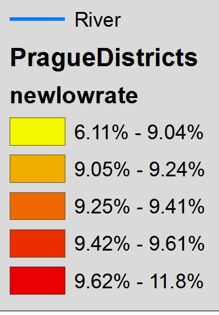
TABLE OF CONTENTS

                                                                Page

SUMMARY                                                          #

CHAPTER

  1   INTRODUCTION                                               1

        History of Flooding in Prague                            4

        August 2002 Floods                                       6

        June 2013 Floods                                         9

  2   FLOODING: SOCIOECONOMIC IMPLICATION AND PROTECTION
      STRATEGIES                                                11

        Socioeconomic Implications of Flooding                  12

        General Flood Protection and Management Strategies      16

        Flood Protection and Management in the Czech Republic   18

        Conclusion                                              25

  3   RESEARCH DESIGN AND METHODOLOGY                           26

        Socioeconomic GIS Analysis                              28

        Tentative Flood Damage Costs per District               33

        Measure of Flooding in Meters per District              35

        Flood Measure Analysis                                  35

  4   RESEARCH CONCLUSIONS                                      41

  5   FURTHER RESEARCH AND RECOMMENDATIONS                      43

          Recommendations                                       43

          Further Research                                      45

REFERENCES                                                      47

                                        v
SUMMARY

       With weather events becoming more intense, governments need to take extra

precautions to make their cities and regions more resilient to these climate change related

disasters. Disaster prevention and response requires a tremendous amount of financial

support and often requires more resources than a city is capable of providing on its own.

Therefore, the governments must make decisions when allocating these resources.

Priorities must be established. This research paper aims to determine whether or not

certain districts of Prague face more flood damages than other areas. The research

attempts to determine if there is a correlation between the socioeconomic status of the

district and the amount of flood damage it receives.

I was able to determine that flood levels in each district for 2002 and 2013 is telling in the

Czech government’s potential flood protection strategies. The area that received the most

flooding, Prague 16, received much less flooding in 2013. This suggests that this area

may have been heavily protected. Prague 1 also received less flooding. This area, the city

center (for business and tourism) would have been one of the most protected areas for the

2013 floods. Prague 7, with the highest numbers, only changed slightly between the two

years (change of 9.3%). This suggests that more precautionary protection measures

should be put into place in order to prevent these high damages for the next major flood.

                                              vi
.
viiCHAPTER 1
INTRODUCTION
Scientists and researchers are finding a connection between greenhouse gas emissions
and unpredictable, intensified weather patterns. Subsequently, global concern about
climate change is rising. Governments and policy makers all over the world must adapt
their countries, cities, and regions to withstand these changing weather patterns.
Specifically, flooding is predicted to become more problematic as climate change
intensifies. According to the 2013 Intergovernmental Panel on Climate Change (Stocker
et al., 2013, p. 158) studies using Special Report of Emission Scenario (SPES) modeling
indicate climate change will continue to influence the intensity and frequency of weather
patterns in the future. SPES models are based on different levels of baseline global
greenhouse gas emissions between 2000 and 2030. The report states that while
precipitation will increase in some areas and decrease in other more arid climates, there
will be a “general intensification of the global hydrological cycle, and of precipitation
extremes, are expected for a future warmer climate” (Stocker et al., 2013, p. 984). Cities
unpreparedness for these natural disasters results in exorbitant and perhaps preventable
deaths, injuries, and property damages.
Disaster prevention and response requires a tremendous amount of financial support and
often requires more resources than a city is capable of providing on its own. Therefore,
the governments must make decisions when allocating these resources. Priorities must be
established. When disaster strikes and emergency response and resources are needed,
what affected area get treatment first? Do other areas receive help after the fact or not at
1all? These questions bring up an important issue in disaster management and prevention.
Disaster prevention and relief questions can represent whether or not there are underlying
socioeconomic disparities and inequalities in the area. If so, what steps can cities take to
correct these injustices?
Socioeconomic issues are prominent during natural disasters because there are always
certain areas of a city, people of certain ethnicity, or people of a specific socioeconomic
status who are more vulnerable to extreme weather events. Vulnerable populations are
usually lower-income, live in lower-quality dwelling units, and are forced to live in
hazardous areas that are undesirable for people who have the ability to live elsewhere.
During crisis management, are some populations more negatively affected than others?
Prague is among many central European cities that experienced several extreme flooding
events within the past few decades. Like many major cities around the world, Prague is
situated along a major river for convenience to navigable waters. Rivers often serve as
the foundation and can be responsible for the success of a city, but can also be
responsible for damaging them. The Vltava River in Prague is no exception. The areas
that surround the Vltava in Prague have been vulnerable to major flood events within the
past twenty years, specifically in 2002 and 2013. Two of the affected areas are major
tourism and business districts while others are residential and commercial. After these
floods, the Czech government must allocate flood protection and recovery resources. This
research paper aims to determine whether or not certain districts of Prague face more
flood damages than other areas. It will attempt to determine if there is a correlation
2between the socioeconomic status of the district and the amount of flood damage it
receives. Additionally, it will analyze the Czech Republic’s flood management and
protection strategies already in place.
The research of this paper will be based on socioeconomic characteristics of each
Administrative district along the Vltava River. Socioeconomic data is gathered from the
Czech Statistical Office These socioeconomic factors are rate of low quality dwellings,
rate of people with no formal education, and rate of non-Czechs (specifically Ukrainian,
Roma, Vietnamese, Slovakian per Administrative district). The socioeconomic factors
will be used in conjunction with flood level and flood damage data from the August 2002
and June 2013 floods in Prague. The flood damage information per Administrative
district will determine if there is a correlation between damage/ flood levels and
socioeconomic factors in Prague. Additionally, this information will beused to determine
if flooding improved in the districts from 2002 and 2013.
The first section of this paper will discuss Prague’s history and flooding vulnerability.
The August 2002 will be analyzed to serve as a comparison for the June 2013 floods. The
second section is the Literature Review which will provide information to address the
following issues: General socioeconomic implications of flooding, General and Czech
specific flood management. The third section of the paper will explain the research
design, methodology, and the research findings. This will incorporate flood data, images
and the socioeconomic information of Prague’s administrative districts. The final section
3of the report will conclude my findings and provide recommendations for planners, for
Prague, and for further research.
History of Flooding in Prague
While Prague’s first settlers migrated to area during the Stone Age, it did not
become a city until the 12th century. During this time the Old Town and Mala Strana
(Lesser Town) were intentionally constructed along the meandering Vltava River
("Prague History," 2010). The Vltava played a major role in Prague’s growth because it
“provided vital water for drinking and crop irrigation, and a means of navigation for both
the early settlements establishing along its banks and for travellers on the early trade
routes between Southern and Northern Europe” ("Vltava River,"). It is the longest river in
the Czech Republic with two tributaries, Teplá Vltava (Warm Vltava) and Studená
Vltava (Cold Vltava). The Vltava travel through Germany and drains in the Elbe (Labe)
River. While the river is responsible to Prague’s foundation and contributes to the city’s
unique character, it has also contributed to major flood events over the past few decades.
The word Vltava means torrential or wild river, which is a accurate representation of the
river during flood events in Prague.
The City is composed of twenty-two administrative districts, and like many districts
in a single city, they all differ in character and history. The districts range from
Prague 1 and Prague 22. Each district is its own municipality and is comprised of an
individual mayor and local government. This research will focus on the flood prone
areas, thus the districts located along the Vltava River will be the primary area of
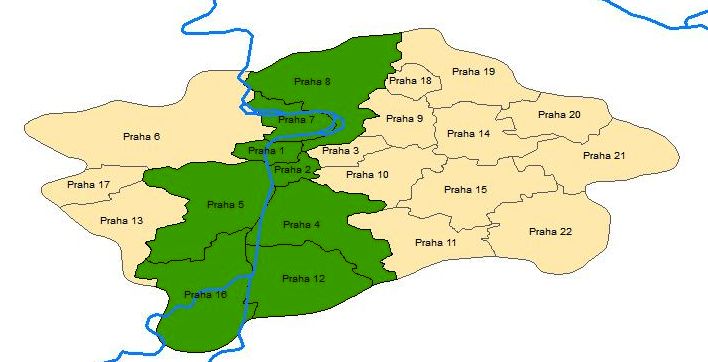
4focus. These districts are represented in the map below and highlighted in green.
They include (Ranging from North to South):
Figure 1
• Prague 8- (Brezineves, Dablice, Dolni Chabry, Karlin)
• Prague 7 (Letna, Troja, Liben Holesovice, Bubenec)
• Prague 1- The Center/ Old Town
• Prague 2- Nove Mesto
• Prague 5- Smichov
• Prague 4- Pondoli
• Prague 16- Chuchle
• Prague 12- Modrany
5August 2012 Floods
In August 2002, the Czech Republic was hit with a flood even that was well
beyond the country’s scope of knowledge and experience. The results were devastating,
to both people and the economy. Prague is one of the most famous cities in Europe, and
therefore, attracts many tourists every year. The floods prevented the city from collecting
revenue from the tourism industry on which its economy relies so heavily. Homes and
businesses also surround the Vltava River were also affected. Overall, the floods placed
an overwhelming burden on individuals in the city.
To illustrate the magnitude of the event, it can only be compared to another flood event in
Bohemia’s history. The Vltava, “after 4 days and 3 nights of rain, flooded Prague’s Old
Town and the lower parts of the Little Town were allowing for transport by boat only.
Mills on the Vltava were washed away, many houses demolished, people and cattle
drowned, fields flooded, and more. The stone Charles Bridge was destroyed in five
places” (256). The impacts were astronomical. They caused over $26.17 billion in
damages and killed 18 people. A few issues were responsible for the extent of this flood
event. It came in two phases and after the “first wave of rainfall, the retention capacity of
the upper Vltava basin was completely exhausted. The retention capacities of the
reservoirs of the Vltava cascade were kept according to the valid operating curves, but
the dispatchers were helpless against the volume of water rushing down the
basin”(Sklenář, Zeman, Špatka, & Tachecí, 2006). As a result, the Vltava rose and spilled
over into the city.
6Although wild or torrential is rooted in the Vltava’s name, major flood events do not
dominate the Czech Republic or Czechoslovakia’s history. The intensity of the floods
surpassed any on record, and therefore, the city could not adequately prepare for it.
Determined by archaic watermarks, one of the worst floods Czech history occurred in
March of 1845 and is then followed by the floods of August 2002. This is a substantial
gap between major flood events in the Czech Republic and for the “first time in the last
century, the Czech Republic experienced a major flood whose rate significantly exceeded
the passage of a 100- year water”(Jirasek, 2006, p. 256). Because of these sporadic major
flood events, the country might not have been equipped to deal with the intensity of these
floods. The
“hydrologic monitoring network was underinvested within the
last century. During the flood, most of the guage stations at the rivers
were destroyed, some were not able to transmit or even record data
under the unexpectedly high water level conditions A meteorlogical
forecast was available and quite accurate. Hydrological forecast was
not available fully in the later stages, because most of the models
were out of range and on-line data were hardly available later during
the event” (Jirasek, 2006, p. 256)
The history of flooding in the Czech Republic/ Czechoslovakia indicates that the country
does not have sufficient experience to protect the land and people from extreme flooding.
While such flooding has taken place in ancient history, preparing for floods today is
7much different, even if its intensity is similar. The flood events “of the equivalent
intensity have nowadays more catastrophic consequences than in the part in connection
with the more and more complex infrastructure of human society and with the growing
degree of anthropogenic re-shaping of the cultural landscape” (Jirasek, 2006, p. 264). The
country was neither equipped nor prepared for the sudden flooding in August of 2002.
This flood taught the Czech Republic many lessons for flood protection in the future.
After the 2002 Floods, the Water Management Resesarch Institute published a report that
evaluated the floods and its effects on the city. The following were important conclusions
from the report:
• [The Czech Republic] must consistently enforce the flood prevention principles;
in particular, regulate the land utilization in the delineated flood-prone areas and
in their active zones
• Safeguard the waste water treatment plants (WWTPs) against flood damage since
nonfunctional WWTPs were among the leading sources of the surface water
quality impairment
• The comprehensive evaluation indicates that the rainfall in the sub- basins
affected during the 2002 flood situation reached 68% of the probable maximum
precipitation (PMP); in future, heavier precipitations can be expected thus it is
necessary to supply major urban areas authorities and industrial plants
managements with flood plans in case there is a flood of the occurrence rate
exceeding the 100- year return period
8• Build up storage capacity by suitable land modifications and by revitalization of
the regulated sections of small watercourses
• Continue
in
delineation
of
flood-‐prone
areas
and
in
the
implementation
of
flood-‐prevention
and
protection
measures
• Improve the information system by means of automation of the precipitation and
hydrometric stations, and utilize the close linkage onto the European forecasting
system (Jirasek, 2006, p. 264)
June 2013 Floods
June 2013 proved to be a trying time in the Czech Republic. Multiple days of heavy
rainfall caused the Vltava River to quickly rise and threatened Prague with severe
flooding. The river was said to be ten times its normal level. The Vltava Cascade, a
collection of nine dams, were “dangerously full” (Fraser, 2013) and floodgates had to be
opened. The famous Charles Bridge was closed for tourists, Kampa Park (a famous area
in Prague’s center) was underwater, and a handful of metro stations had to be closed.
Although these floods were not as severe as the August 2002 floods, the event caused
major damage. The damages from this flood reached 1.76 billion CZK, which is 91.3
million U.S. Dollars” ("Czech Republic: Insurers to tighten conditions for properties near
floodplains," 2013). Additionally, three thousand people were forced to evacuate their
homes and leave their belongings behind (Fraser, 2013)
9CHAPTER 2
FLOODING: SOCIOECONOMIC IMPLICATIONS AND
PROTECTION STRATEGIES
People of low-socioeconomic status commonly inhabit areas that are undesirable
areas because of their exposure to certain hazards, like floodplains. Inexpensive
infrastructure and housing are also less resilient to natural disasters, and therefore, the
low-socioeconomic residents have no choice but to reside in these areas. Flooding has
caused physical and economic devastation in Prague over the past two decades. Three
fatal floods, in 2002, and 2013, caused billions of dollars worth of damage, and have
presented the Czech Republic with extreme social and economic challenges. Such natural
disasters repeatedly illustrate the vulnerability of certain communities. Before
continuing, it is important to first to be aware of how floods are understood in the Czech
Republic. Chapter 9: Protection Against Floods, of the Czech Republic’s Act Water Act
defines floods as “temporarily marked increase in the water level in a watercourse or
other surface water body, causing water to flood the surrounding land outside the
watercourse channel, and being possible causing factor of a damage” ("The Water Act,"
2001, p. 34). Therefore, as flood disasters become more frequent and intense in the Czech
Republic, it is important for governing bodies to be aware of the flood situation in
relation to lower socioeconomic areas or Prague. This research aims to answer the
following questions that explore the relationship between floods and socioeconomic
indicators in Prague’s municipalities. These questions are the following:
• Are there certain areas of Prague repeatedly more affected by floods than others?
10• If so, are there certain shared socioeconomic characteristics of those areas?
• Do Prague’s flood measures and policies appropriately and affectively protect
vulnerable areas from flooding.
Before answering these questions, the following literature explains socioeconomic
indicators of disasters and flood management and protection strategies globally and
specifically in the Czech Republic.
Socioeconomic Implications of Flooding
Globally, people of lower socioeconomic status tend to occupy at risk areas and
this makes them less resilient to natural disasters. First, understanding the term at “risk”
is necessary. The term at “risk” indicates that“(1) without people or property, there is no
risk and (2) one should pay equal attention to the flood hazard and society’s
vulnerability” (Klijin 2010, 309). This definition suggests that “demographic and
economic developments urge us to reconsider the current flood risk management
strategies as vulnerability mounts. This implies a shift away from the single objective of
flood defense, via control of the flood hazard (physical defense measures) towards
management of flood risks proper through and also influencing the vulnerability of
society” (Klijn, Samuels, & Van Os, 2008, p. 308). The following sections present a
general picture of these socioeconomic implications of natural disasters.
The issue of disaster vulnerability and its effect on lower-income communities is very
important for this research. First, it is important to define vulnerability as it relates to
disaster events. Social vulnerability can be described as “the specific social inequalities in
the context of a disaster” and is based on “comparing the status of a group of people
11either to a desired state-i.e.- basic human rights- or to that of another group of people who
are in a better position to deal with the negative impact of a hazard” (Kuhlicke, Scolobig,
Tapsell, Steinführer, & De Marchi, 2011, p. 790). Additionally, it is not “a single variable
that produces the vulnerability of a person; it is rather a combination of different
variables but also, importantly, the respective societal content…there are many
‘immaterial’ aspects, such as local knowledge, culture, traditions, norm and mores”
(Kuhlicke et al., 2011, p. 792). Conclusively, vulnerability to natural disaster is “seen not
just as a product of physical location by also as a social product” (Few, 2003, p. 50).
Because of their limited financial means, inaccessibility to facilities, political
underrepresentation, and low quality dwellings, communities of low-socioeconomic
status are more vulnerable and less resilient to extreme weather events. Additionally,
once they are affected, it is more difficult for these areas to reestablish themselves.
Matters become worse for these communities when they have little choice but to reside
in hazardous areas, which will allow weather events to further affect them in the future.
He explains that the “poor tend to occupy the more flood-prone environments” (Few,
2003, p. 49) and “poverty can drive people towards settling and working in precarious
locations such as unstable riverbanks in farming areas. In urban areas exposure to flood
hazard tend to be concentrated in marginal, low-lying sites along rivers, on floodplains
and coastal marshes- sites historically avoided by the better-off but often settled by the
poorest communities because of their availability and/or proximity to sources of
economic livelihood” (Few, 2003, p. 49). Additionally, “squatters tend to find there is
less danger of eviction by city authorities if they locate to areas deemed undesirable for
12legal private or public development” (Few, 2003, p. 50). Moga (2010) also examines the
relationship between low-income residents and their low-lying flood prone properties.
Specifically, in the United States “urban low land residential districts became ubiquitous:
they served as containment areas for many desperately poor people seeking opportunity
in the city, finding housing nowhere available but in the topographical low zones”
(Moga, 2010, p. 13).
Morrow (1999) also discusses the financial, physical, social, and mental effects that
floods disproportionately have on low-income communities. Morrow stresses the need
for planners and policymakers use this knowledge in order to implement better protection
strategies and equal emergency response among communities. Additionally, low-income
communities are not only affected the most by extreme weather events, but they
continuously feel the burdens long after the event. If they are affected because they live
in a floodplain, or other hazardous areas, they are also likely to become victim to another
disaster. Morrow explains “typically, poor households recover more slowly and many
never fully regain pre-impact levels, increasing their vulnerability to future hazards”
(Morrow, 1999, p. 3). She additionally supports this paper’s claim that poor communities
settle on cheaper areas where the wealthy will not develop to avoid storm damage. She
explains “the dwellings of the poor are often located in vulnerable locations, such as
floodplains. While the affluent build large homes in coastal floodplains for the ambiance,
the poor are likely to have little alternative if their livelihoods are tied to tourism, fishing,
and other coastal enterprises” (Morrow, 1999, p. 3).
13These socioeconomic concerns can be seen in Prague. The evolution of Prague since the
fall of communism is seen through the commercial and business evolution of Prague 1
and 2, gentrification, abandonment, and the urban sprawl in other areas of the city. As
aforementioned, Prague 1, the historical center, has attracted business and commercial
development. It contains “over half of the total city office stock, it is a place where nearly
half of Prague’s retail turnover is realized and where approximately one third of all jobs
is concentrated. Residential function is steadily declining since the beginning of the 20th
century, while government buildings, banks, and office buildings are increasing their
share of land use in the area” (Sýkora, 1999, p. 82). This statement reinforces the
argument that Prague 1 and 2 acquires significant revenue while also acting as the iconic
historical center. Between jobs and tourism, these areas are an asset to the city and
country; therefore, they need to be protected. The article then creates a contrast between
Prague 1 and 2 and the inner city. The inner city areas of Prague “have old and low
quality dwellings in dilapidated houses” (Sýkora, 1999, p. 80). According to the article’s
map of the inner city, it extends to Prague 8, one of the most flood prone areas of the city
which will be discussed later in the paper. There are different types of areas in the inner
city, however. While there are many low-quality dwellings, it has also become gentrified
in Vinohrady, which is located on a hill away from the river. Ultimately, two fifths of
Prague’s residents live in the inner city, and because it does extend to a floodplain and
does house such a large part of Prague’s population, it is important to ensure that those
areas are receiving adequate, if not equal, protection and relief from flooding.
The floods’ threats to Prague’s unique historical sites are only a portion of the impacts.
Many residents, who live adjacent to the Vltava River and within the 100-year
14floodplains, are displaced and burdened with significant flood damage. As a visitor
during flood events, one can see that the protection measures in Prague 1 and 2, the
historical, business, and wealthy areas are significant. However, it is less clear if the other
affected areas are equally protected. As the largest city and economic resource in the
Czech Republic, lower income people flock to Prague in hopes of finding job
opportunities. This also means that expensive rent will drive people to live in undesirable,
cheap, and more hazardous areas of the city. Because tourism is a significant part of
Prague and the Czech Republic’s GDP, it likely also employs many people who may not
otherwise have jobs. This is another reason why lower income people must reside in
Prague instead of a less expensive area of the Czech Republic.
General Flood Protection and Management Strategies
Disaster reduction policies are essential for the protection of the citizens, the economy,
and environment in every country around the globe. Because disaster events are likely to
reoccur, this realization has created a paradigm that has “shifted toward addressing the
root causes of vulnerability to disasters, either through structural or non structural
adaptations”(Solecki, Leichenko, & O’Brien, 2011, p. 136). The paradigm also “focuses
on risk assessment, vulnerability to multiple stressors, livelihoods and well-being,
institutional capacity building, risk mitigation investments, catastrophe risk financing, as
well as emergency preparedness” (Solecki et al., 2011, p. 136). Ultimately, many factors
must be considered for disaster related policy enforcement, and because less resilient
areas often physically and financially burdened the most, it is important for these policies
to benefit all at-risk communities equally.
15Continued pressure and oversight on the governments is essential because these policy
objectives are not always reached. The topic “safe development paradox” is explored
discussed in Burby’s (2006) article and explores the implications of poor development
policy in floodplains and the government’s failure to protect people in these areas after
the damage is already done. In the article, Burby argues that the “extensive damage in
New Orleans and the trend in increasing numbers and severity of disasters are wholly
predictable outcomes of well-intentioned, but short-sited public policy decisions”(Burby,
2006, p. 172) and therefore, they try and “make hazardous areas safe for development,
government policies instead have made them targets for catastrophes” (Burby, 2006, p.
172). After these types of disasters, “citizens bear the brunt of losses in disasters” and
“local officials often fail to take actions necessary to protect them”(Burby, 2006, p. 172).
As seen in the socioeconomic implications of flooding section, citizens, especially low-
income communities, are most affected by the disaster. This outcome is ultimately
because policy decisions allow people to live in vulnerable and low resilient areas of
cities. Because public policy decisions have helped make communities more vulnerable,
they can also be used to achieve resiliency.
More specific to Europe, mapping and hydrological models that analyze flood risks
throughout the Europe are also a crucial part of disaster recovery and prevention. They
evaluate the damage costs of the expensive flood events. The European Union issued a
directive to its Member States to prevent flood related problems in their countries. The
directive requires “Member States to carry our preliminary assessment to identify the
16river basins and associated coastal areas at risk of flooding. Such zone then will be
subject to flood risk maps and flood risk management plans” (Genovese, 2006, p. 13).
The EU has other measures and programs to prevent flood related disasters and
emergency funds for disaster recovery. These policies include the EU Structural Fund
Policy, INTERREF Programmes, and the European Union Solidarity Fund (Genovese,
2006, pp. 13-14). This report explains that while the EU provides incentives and
programs to help Member State’s deal with flooding, they do not have specific flood
management strategies or development policies for each Member State. Therefore, the
Czech Republic must establish these policies.
Flood Protection and Management in the Czech Republic
Successful flood management and protection policies are essential in Prague especially
with increasing intensity and frequency of flood events within the past two
decades. Protection policies can range from prevention of flooding, like water barriers
that are commonly seen along the Vltava in Prague’s center, to development policies that
prevent development along flood prone areas.
Before discussing structural and non-structural programs in Prague, it is important to know
where the resources are coming from. Currently, the Czech Republic acquires disaster
relief funds from multiple places. First, the European Union has established a Solidarity
Fund after the widespread flood disasters in 2002 and 2003. Because of establishment of
this fund, “Member states, and countries applying for accession, can request aid in the
event of a major natural or technological disaster” and “provides financial aid for
emergency measures in the event of a natural disaster causing direct damages above three
17billion Euros or .6% of the GNI” (Aakre et al., 2010, p. 731). Along with the Solidarity
Fund, flood protection infrastructure and flood defense measures came from state budget
subsidies, which come from European Investment Bank (Puncochar, 2012, p. 1). Another
important program comes from the Ministry of the Environment and uses European Funds
via the “Operational Programme Environment” in the measure of the “watershed
management infrastructure improvement and reduction of flood risks” (Puncochar, 2012, p.
3). While there are other relief programs, these are among the most prominent in the related
literature.
Structural/ Governmental Flood Protection
After the devastating floods in the Czech Republic, the Ministry of Agriculture created a
program that composed of five elements that are “aimed above all, at the creation of
water storage capacity and the protection of dwellings” (Jirasek, 2006, p. 264)The
elements include:
• Construction of polders, reservoirs, and levees
• Increasing watercourses capacity in developed areas
• Delineation of flood-prone areas
• Run-off condition studies
• Delineation of areas threatened by extraordinary floods
The Protection from Floods section in the Czech Republic’s Water Act outlines fourteen
preventative flood measures and four measures that are taken during flood events. They
are as follows:
18Flood Prevention Measures Measures taken during Floods
1. Determination of Flood plain areas 1. Regulating of flow regime
2. Specification of limits for flood 2. Flood protection activities (like
protection activity degrees
placing sandbags, constructing
3. Flood protection plans
flood barrier walls)
4. Flood protection inspection
3. Flood rescue activities
5. Organization of flood forecasting and
4. Activities aimed at ensuring
reporting services
substitute functions and services in
6. Organizational and technical
territories affected by floods
preparation
7. Creation of flood reserve stock
8. Clearing of flood plain areas
9. Training of persons participating in
flood protection activities
10. Activities of the flood forecasting
service
11. Activities of the flood reporting service
12. Warning in case of danger of floods
13. Establishment and activities of the
watching service
14. Flood recording documentation
The flood prevention strategies that are repeatedly emphasized in the document are
establishing floodplains, have routine flood inspections, and municipalities are required
to submit flood protection plans to the River Basin Administration for review. When the
19floodplains are established, the Act restricts any development of the floodplains unless it
is a structure related to water management. The Act specifies that “locating, permitting
and building structures inside the active zone of the flood plain area is prohibited except
for water management structures aimed at regulating the watercourse, flood flow routing,
performing flood protection measures or measures which are otherwise related to the
watercourse or improve the flow regime, structures for water retention, waste water and
rain water disposal and also necessary transport and technical infrastructure” ("The
Water Act," 2001)
Additionally, the Czech Republic has developed sophisticated flood models to determine
the damage and therefore successful policies for flood protection. To determine these
effective flood protection strategies, the Czech Technical Institute in Prague “developed a
system of three methods of damage evaluation with different levels of accuracy. All three
methods are based on the same approach, using object-oriented land use information, an
estimation of values of assets and risk per meter, main based on data from official
statistics, and a kind of relative damage function” (Meyer & Messner, 2005, p. 17).
Furthermore, when prioritizing localities to implement these programs, “the amount of
risk was evaluated in each given locality and the selection process was based on the
assessment of the dwelling priority (number of affected inhabitants, the extent of
probable damage, historical relations), on the existing capacity of the riverbed and on the
locality’s proneness to floods”(Jirasek, 2006, p. 264). This program for assessing
priorities seems affective.
Non Structural/ Financing Disaster Preparedness and Responses
20The Czech Republic does consider social vulnerability and prioritizes the human safety
and protection. Therefore, non-structural and financing plays a large role in the Czech’s
flood mangement programs and systems. Jelínek (2007) explains that the Czech Republic
indicated how “various categories of typically vulnerable objects are prioritized for flood
risk management in their countries” (Jelínek, Wood, & Hervás, 2007). “Humans as
Individuals”, “Humans as Social Targets” and “Private Property” are ranked “Very High”
and “High” on the Level of importance of the elements at risk exposed to flood hazards in
the Czech Republic. These priorities explain that vulnerable human populations are the
most important factors in flood events, and therefore, the government should be
establishing higher flood policy and development standards.
Before making recovery allocation decisions to address this vulnerability, decision-
makers have many factors to consider. An important way to make these decisions is
considering the normative welfare theory, a “branch of economics which accesses
society’s welfare based on the objectives of allocated efficiency, distribution among
agents and stabilization among the economy” and has been used to decided how
“governments should intervene in order to facilitate adaptation”(Aakre et al., 2010, p.
723). The three main pillars of the welfare theory are allocation, distribution, and
stabilization. Specifically, the functions of the government in these three factors are “(1)
generating an efficient allocation of goods and services, (ii) ensuring an adequate
distribution of income. as well as (iii) stabilizing the economy” (Aakre et al., 2010, p.
723). These pillars ultimately outline the role of public decision making and the
importance of addressing each of these factors. These factors will be used to analyze the
21public sector’s flood relief strategies in Prague. As the Czech Republic addresses flood
this vulnerability, it is important that they use every possible nonstructural tool to repair
the affected areas and to build their future resilience. Equal distribution of these resources
is among one of the most important responsibilities of the governing bodies. Prague and
flood resource allocation is no exception.
Along with public flood management efforts, flood insurance also plays a large role in
disaster relief. Although insurance may not directly be a government responsibility, public
access to insurance benefits people and the government. The government aims to reduce
the amount of financial burden on the state, so implementing adequate insurances policies
is necessary. Additionally, the financial burden may not be so heavy on lower-income
residents. Essentially, “transferring risk management responsibilities to the property owner
by introducing more private insurance in a region is one way of coping with losses”
(Hansson, Danielson, & Ekenberg, 2008, p. 468). While insurance is a positive factor in
flood recovery, it can be esoteric and can prevent some residents from gaining access to it.
For instance, increasing an insurance premium on a flood risk property can be expensive,
thus prohibiting people from moving into the area. However, many lower-income, less-
educated residents need to live closer to the center of Prague because of higher
employment opportunities. Therefore, it can come down having a job with no insurance in
a flood plain, or living outside of the floodplain with fewer job opportunities.
Czech insurance, while advanced, still has issues that need to be addressed in order to
promote social equity throughout the city. Currently, “the local insurance market offers an
22all-risk inclusive property insurance policy, which besides traditional FLEXA perils also
provides coverage against almost all known types of disasters” (Gurenko & Dumitru, 2009,
p. 13). While there are 1,875,523 individual policies in the Czech Republic, the high
number “conceals the problem with obtaining coverage for people living in flood prone
areas as most insurers do not provide coverage” (Gurenko & Dumitru, 2009, p. 13). This
issue has not yet become a political problem, and therefore there is “no pressure for the
establishment of a national flood insurance pool” (Gurenko & Dumitru, 2009, p. 13). The
article does mention, however, that gradually the flood barriers along the river will prevent
damage to homes and development will gradually be prohibited along the river. It does not
give a time frame for these goals and does not address whether or not the flood barriers are
equally distributed along all riverfront areas. It is also important to note, however, that
insurance companies are “reluctant in publishing data of insurance payments, apparently
because it is business information” (Genovese, 2006) and are of “little help in developing
flood damage assessment methods” (Genovese, 2006). This will be discussed in the
concluding recommendations of the paper.
Despite the Czech Republic’s efforts to improve flooding management, there are major
issues in this system that interferes with more success flood management. Due to data
limitations, experts have not necessarily established the relationship between flood damage
and relief funding per municipality. While this source addresses relief allocation in South
Bohemia, not Prague specifically, it explains that fund allocation in the Czech Republic as
a whole is nebulous. It explains that once disaster strikes, the Czech government only
calculates damages. The calculation of damages is based on the Ministry of Finance’s
23methodology, which is not described in detail in the literature. Therefore, the article
suggests that “ the amount of damage determined immediately after the emergency event
does not necessarily correspond to the actual amount” and ultimately “we cannot yet talk
about evaluation of efficiency in financing the recovery of the areas affected by the
emergency event and prevention” (Bakoš, Binek, Rektořík, & Šelešovský, 2011, p. 8)
Therefore, it can be understood that the government needs to make this relationship more
transparent in order to make more equitable and efficient decisions.
Conclusion
Globally, natural disasters carry many socioeconomic implications and illustrate the
vulnerability of lower income communities to these events. Vulnerability is often
human Induced due to the affordability of hazardous land and low quality dwelling
units. Additionally, these communities often go underrepresented in disaster recovery.
This is all too common injustice could also be prevalent in Prague. While Prague has
made strides to protect historical and wealthier neighborhoods from flooding, it is less
clear whether other areas along the river receive similar attention. The next section takes an
analytical look at the potential socioeconomic issues of flooding during the 2002 and 3013
events.
2425
CHAPTER 3

               RESEARCH DESIGN AND METHODOLOGY

The Research Design for this paper is composed of three elements: socioeconomic data

for each municipality of Prague, flood damage costs for municipalities of Prague, and

flood level maps of the Vltava River. Flood damage data is not readily available, and

therefore, cannot be the main driver of the analysis for my paper. The first step of this

analysis is to understand the socioeconomic situation in Prague. After searching through

the data available through the Czech Administrative office, Low Quality Dwelling Units,

Rate of Residents low education levels, and the percent of non-Czechs/minorities in each

district are the main socioeconomic indicators of my research. Note that the education

section is the amount of residents with no formal education level plus the amount of

residents with low education levels. The non-Czechs variable includes Slovakian,

Ukrainian, Roma and Vietnamese. Income level per administrative district would be a

strong variable for the analysis, but was not available through the Czech Statistical

Office. The following section discusses the analysis of these socioeconomic indicators

maps.

The second element of the research design will compare the socioeconomic indicators to

the amount of flood damage in each of the nine administrative districts that run along the

Vltava river and are, therefore, more vulnerable to flood damage. This information will

help determine if there appears to be a correlation between the aforementioned

socioeconomic factors and the amount of flood damage the district receives. The Czech

government follows a specific and complex formula to determine flood damage costs.

                                             26
This flood damage theorem depends on “three pieces of information: the damage
categories affected and included, the data on damaged objects as well as the damage
function and factors to be applied. For buildings, which form the most significant damage
category, the formula for the estimation of damages to an individual building floor under
water reads:
DAMAGE= H*C*%p*A (in CZK)
H [m]= Height of an individual Building
C [Kč/m3]=
Price
of
a
cublic
meter
of
a
building
based
on
JKSO
data
A
[m2]=
Ground
floor
area
of
the
building
(GIS
based)
%p
[-‐}=
Percentage
of
damage
to
building
according
to
damage
function
(Meyer
&
Messner,
2005)
As aforementioned, the flood damage information is not readily available. After
contacting people from the government and nongovernment sector, I have repeatedly
been informed that a record of total flood damage costs per municipality does not exist.
Prague municipalities do not report total flood damage costs to an overall database.
However, the Chapter IX- Protection Against Floods, of the Water Act, states that
municipalities are required to “determine the extent and level of the flood damages,
assess effectiveness of the implemented measures and submit a report on the flood to the
flood protection authority of the municipality with the extended jurisdiction” ("The Water
Act," 2001, p. 41) Therefore, it seems that an official database should exist. Furthermore,
this information will conclude whether or not socioeconomic implications play a role in
27the amount of flood protection the area receives. If there is a clear correlation, policies
need to be mandated to prevent inequity during major flood events. Unfortunately, this
section will require further research in the future because of the lack of available data.
Socioeconomic GIS Analysis
The City of Prague is composed of twenty-two Administrative districts, nine of which run
along the Vltava River. As part of the Methodology, I have chosen three variables from
the Czech Statistical database that describe the socioeconomic status of each
Administrative districts in Prague. The data has been exported from the Czech Statistical
Office (CSO). Using the join function in ArcGIS, these socioeconomic indicators were
merged to Prague’s administrative boundaries shapefile. These rates were divided into
quantiles. The quantiles make the information in the districts easily distinguishable from
each other. The lowest percentages are yellow while the higher percentages are
represented by dark orange and red. Ultimately, these maps serve to give a physical
representation of these statistical variables within the city. The socioeconomic variables
exported from the CSO are the following:
• Ethnicity
• Education Level
• Quality of Dwelling
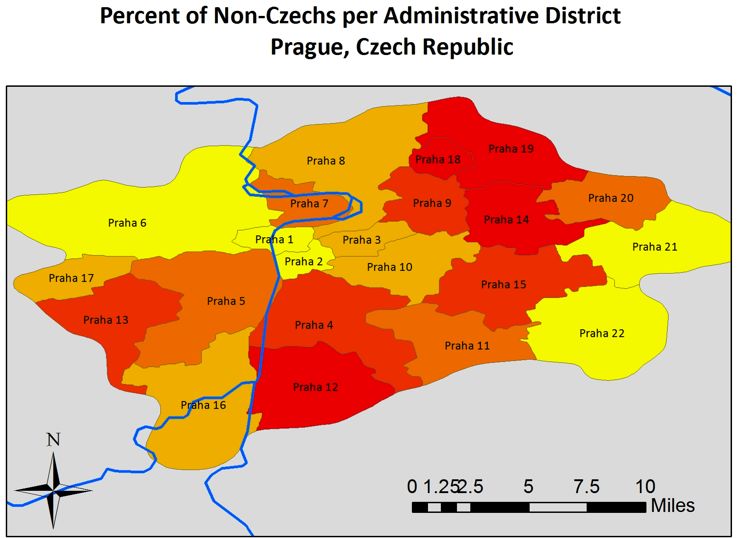
28Figure 2
Figure 3
29Figure 4
30Socioeconomic Findings
The three maps of Prague (above) provide a socioeconomic framework of Prague. There
are three different themes: Number of Non-Czechs per Administration District, Percent of
Low Quality Dwelling Units per Administrative District, Percent of People with No
Formal Education per Administrative District. Each of these variables can be associated
with lower socioeconomic status in districts. The non-Czechs map is composed of
Ukranians, Roma, Vietnamese, and Slovakians. The prominence of these minorities in a
district could suggest lower-income status. The percent of low quality dwelling units per
administrative district are dwelling units that are considered to be below average quality,
but still might have proper piping, water, and other utilities. Sub categories within the
Dwelling category database include standard quality dwelling units, Privately owned and
publicly owned dwelling units. Percent of population with No Formal Education is
composed of people who do not have a grade school degree and people who only have a
grade school degree. Other variables from the educational database include amount of
people with Bachelor degrees, High School degrees, and Master’s degrees.
Because the focus of the research paper is investigating the areas prone to flood events, I
will be specifically exploring districts along the Vltava River, represented by the blue
line. These districts include Prague 8, Prague 7, Prague 1, Prague 3, Prague 5, Prague 4,
Prague 16 and Prague 12. The yellow is the lowest possible percentage and red
represents the highest percentage.
31Percent of non-Czechs per Administrative District- As the first map (Number of Non
Czechs per district) indicates, Prague 5, Prague 7, Prague 4, and Prague 12 have the
higher rates of Non-Czechs in the city. Prague 4, and Prague 5 shows between 2.27% and
2.55%of Non-Czechs. Prague 7 has between 1.9% and 2.3%. Non-Czech and Prague 12
has the highest rate, between 2.556% and 3.12% of Non-Czechs. Ultimately, Prague 12
has the highest rate of minorities in the City of Prague.
Percent of Residents with Low Education Levels per Administrative District-
The second map, Percent of Residents with Low Education Levels per Administrative
District is the combination of people with no formal education and low education
attainment. The highest rates of no formal education are in Prague 8 Prague 12, and
Prague 16 with rates between 9.41% and 9.61%. Prague 4 has the second highest rate
between 9.23% and 9.41%.
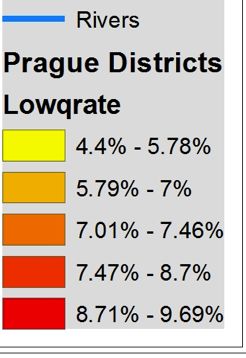
Percent of Low Quality Dwelling Units per Administrative District- The third map,
Percent of Low Quality Dwelling Units per Administrative District shows Prague 1. The
amount of low quality dwellings could be representative of neighborhoods with a lower
socioeconomic status because of the residents’ inability to pay renovations and
improvements. The map suggests that Prague 1 has the highest rate of Low quality
dwelling units, which falls between 7.93% and 9.69%. This is interesting because Prague
1 is known as the City’s center, composed of businesses and tourism and is considered to
32be the nicest area of the city. Old traditional structures could be the result of these higher
numbers, but would require additional research. Prague 16 and Prague 12 have the
second highest rate between 7.24% and 7.9%. Prague 5 has the third highest rate of Low
Quality Dwelling Units between 5.79 % and 7.23%. Other high rates of these inadequate
dwellings are towards the outskirts of the city.
GIS Map Conclusions
The socioeconomic factors in each district prove to not be completely consistent.
However, Prague 12 and Prague 16 are darker colors in all three maps and can conclude
that these two districts have high rates of non-Czechs, low quality dwelling units, and
lower educated residents when compared to the rest of the city. This consistency suggests
that these districts are considered to be lower in socioeconomic status, and therefore,
could be more vulnerable to flooding. With this knowledge, special attention needs to be
paid to these areas during flood damage and flood levels analysis in the following
sections.
Tentative Flood Damage Costs Per Administrative District
Although was unable to collect substantial flood damage information, I wanted to include
the damages I was able to gather. The information in Table 1 indicates that Prague 8,
Prague 7, and Prague 1 received the most damages in 2002. Prague 7, Prague 5, and
Prague 16 received the most damages in 2013. This tells us that Prague 1 was and 8 were
taken care of for the 2013 floods, while Prague 7 might again not have been protected
enough. Prague 5 and 16 might have also not been as heavily considered when preparing
for the floods in 2013.
33Table 1: Flood Damage Costs per
District
Flood
Damage
Costs
per
district
2002
2013
CZK
$
CZK
$
Prague
8
8000000000
400000000
Prague
7
308589000
15429450
341415000
17070750
Prague
1
104714500
5235725
7915000
395750
Prague
2
Prague
4
Prague
5
60000000
3000000
48290000
2414500
Prague
12
Prague
16
42783000
2139150
32012000
15600
34Measure of Flooding in Meters Per District
Through the government’s published flood maps, I was able to measure the flooded areas
in Meters for both 2002 and 2013. With this information, I was able to determine what
areas received the most flooding and the change of flood levels between 2002 and 2013.
The change in flooding can suggest whether or not certain areas were more protected for
the 2013 floods and what areas might not have received ample flood protection.
Table 2, below, demonstrates flooding in meters for 2002 and 2013. It also illustrates the
change in meters and the percent change in flooding for the two years. The chart is based
off the table and provides a visual representation of these number changes.
Flooding Analysis:
Prague 8: Prague 8 is one of the two districts that received more flooding in 2013 than in
2008. Table 2 shows that it has a 8.1% change in flooding between the two years.
Although this number might not be astronomical, it is encourages the question as to why
this area, during a less substantial flood, received more flooding than it did during the
worst flood event in decades. This question then leads us to look at the socioeconomic
status of the district in the previous section. The maps reveal that Prague 8 lies within the
mid socioeconomic range. It has a lower percentage of non-Czechs compared to other
35districts, it has one of the highest rates of low education levels, and one of the lower rates
of low quality dwelling units. This reveals that it is inconclusive whether or not the
amount of flooding can be directly related to socioeconomic status. It is possible that the
flooding could do with geographical factors (like the natural curve of the river), but
would need to be investigated further.
Prague 7: The chart indicates that flooding in Prague 7 improved from 2002 to 2013, but
it is the district with the second highest amount of flooding. So while it is positive that
flooding has improved, specifically by 9.3%, it is still troubling to see the district have
such drastic amount of flooding. The socioeconomic GIS analysis of the area suggests
that, like Prague 8, it seems to lie in the middle of the socioeconomic range. It as a mid-
rate of non-Czechs per administrative district, the lowest amount of residents with low
education levels, and the lowest amount of low quality dwelling units. This suggests that
there does not seem to be an apparent correlation between socioeconomic factors and the
amount of flooding the district receives. Because it is directly adjacent to Prague 8, it
could share the same geographical problems that make it naturally more prone to
flooding. This would also need to be investigated further.
Prague 1: Prague 1 seems to have one of the most drastic improvements from 2002 to
2013. Flooding decreased by 55%. As mentioned previously, Prague 1 is home to the
most of the tourist attractions and businesses in Prague which suggests it has a relatively
high socioeconomic status. It has the lowest amount of non-Czechs per administrative
district, the lowest rate of residents with low education levels, but interestingly has the
36You can also read