South Dakota SURVEY REPORT - Deer Population Status Update - South Dakota Game, Fish, and Parks
←
→
Page content transcription
If your browser does not render page correctly, please read the page content below
South Dakota
      SURVEY REPORT

Deer Population Status Update
         2021 Biennial Report

                      Prepared by:
     Andrew J. Lindbloom, Senior Big Game Biologist
       Lauren M. Wiechmann, Big Game Biologist
      Andrew S. Norton, Senior Big Game Biologist
          Steven L. Griffin, Big Game Biologist

    SOUTH DAKOTA DEPARTMENT OF GAME, FISH AND PARKS
    PIERRE, SOUTH DAKOTA

    WILDLIFE SURVEY REPORT 2021-05

    April 2021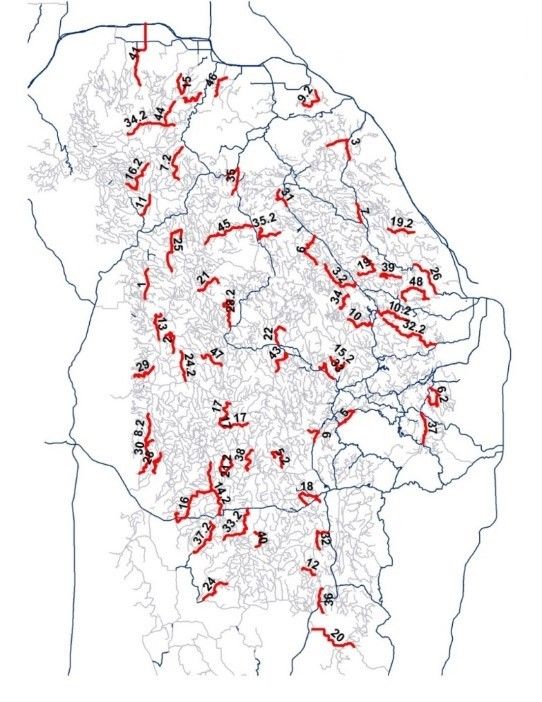
“Authorized Use – This data is the property of the South Dakota Department of Game, Fish, and Parks.
No part of this report may be used (including but not limited to use in publications and/or
presentations), redistributed, copied or reproduced in any form, without the prior written consent of
the South Dakota Department of Game, Fish, and Parks. Any use, redistribution, copying or reproduction
of the data appearing in this report without the prior written consent of the South Dakota Department
of Game, Fish, and Parks is expressly prohibited.”

                                                  i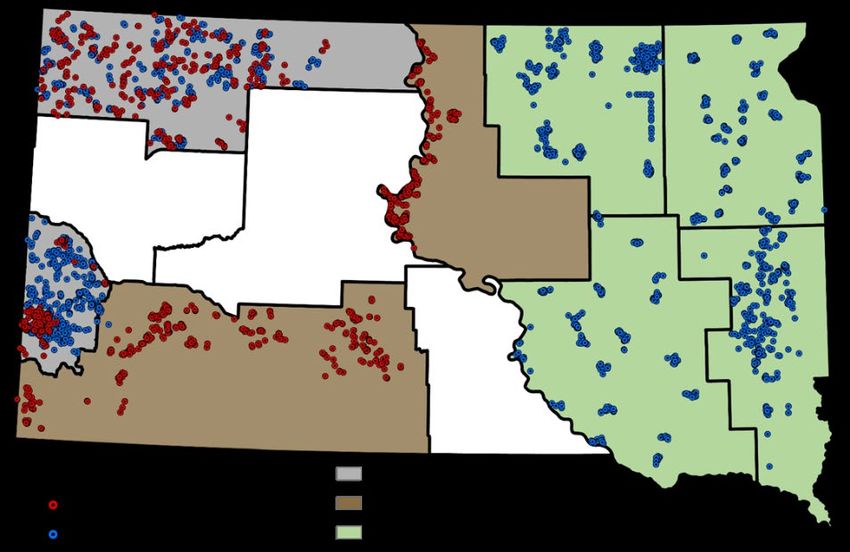
TABLE OF CONTENTS

TABLE OF CONTENTS..................................................................................................................................... ii
LIST OF TABLES ............................................................................................................................................. iii
LIST OF FIGURES ........................................................................................................................................... iii
LIST OF APPENDICIES ................................................................................................................................... iv
INTRODUCTION ............................................................................................................................................. 1
POPULATION SURVEYS AND ASSESSMENTS ................................................................................................. 2
   Population Objectives ............................................................................................................................... 2
   Hunting Season Evaluations ...................................................................................................................... 3
   Disease Monitoring ................................................................................................................................... 5
       Chronic Wasting Disease ....................................................................................................................... 5
       Epizootic Hemorrhagic Disease............................................................................................................. 5
   Herd Composition Surveys ........................................................................................................................ 8
   Survival Monitoring................................................................................................................................. 11
   Abundance Surveys ................................................................................................................................. 12
       Aerial sightability surveys ................................................................................................................... 12
       Road transect distance sampling ........................................................................................................ 13
   Population Modeling............................................................................................................................... 14
   Winter Severity Index ............................................................................................................................. 16
SUMMARY ................................................................................................................................................... 18
LITERATURE CITED ...................................................................................................................................... 19
APPENDIX .................................................................................................................................................... 20

                                                                               ii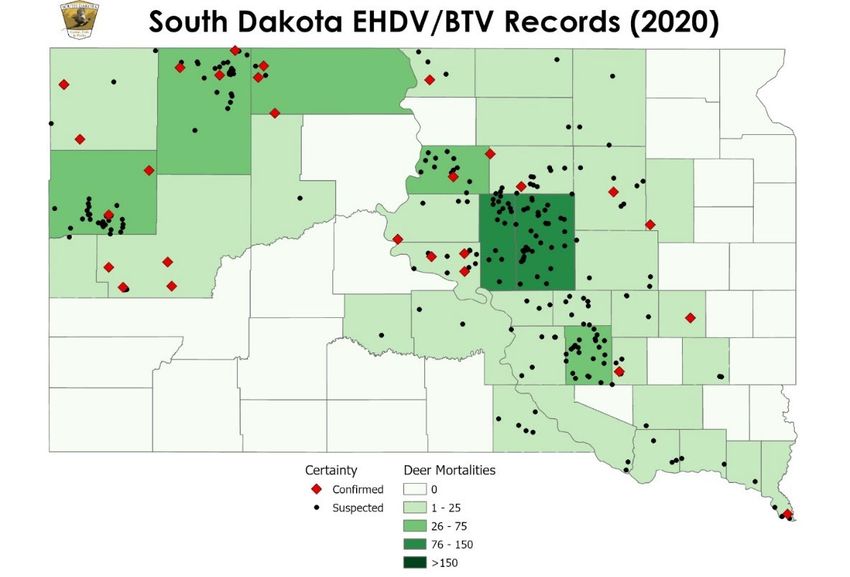
LIST OF TABLES

Table 1.      Deer harvest in 2020 by weapon type in South Dakota................................................................. 5
Table 2.      Preliminary survival rates of white-tailed deer by DAU in 2020. ................................................. 12
Table 3.      Preliminary survival rates of mule deer by DAU in 2020. ............................................................ 12
Table 4.      Categorical objective values based on qualitative objective. ...................................................... 15

LIST OF FIGURES

Figure 1. Data Analysis Units (DAUs) for deer management in South Dakota. ........................................... 2
Figure 2. Population objectives for mule deer and white-tailed deer, 2021-22. Areas in gray do not have
established objectives. .................................................................................................................................. 3
Figure 3. Estimated white-tailed deer and mule deer harvest trends, 2000-2020...................................... 4
Figure 4. Chronic wasting disease positive wild white-tailed and mule deer in South Dakota, 2019-2021.
 ...................................................................................................................................................................... 6
Figure 5. Locations of reported deer, pronghorn, and elk mortalities presumably caused by Hemorrhagic
disease in South Dakota, 2020. Red locations indicate positive results from laboratory testing. .............. 7
Figure 6. Annual reported hemorrhagic disease mortalities of deer, elk, pronghorn, and bighorn sheep
in South Dakota, 2009-2020. ........................................................................................................................ 7
Figure 7. Statewide estimates of recruitment for white-tailed deer and mule deer in South Dakota, 2011
– 2020. .......................................................................................................................................................... 8
Figure 8. Age ratios from Herd Composition surveys for mule deer, 2016-2020. ....................................... 9
Figure 9. Age ratios from Herd Composition surveys for white-tailed deer, 2016-2020. ......................... 10
Figure 10. Winter capture and radio-collaring locations of mule deer and white-tailed deer in South
Dakota, 2013-2020...................................................................................................................................... 11
Figure 11. Road transects used for spotlight deer survey in the Black Hills. ............................................. 13
Figure 12. Estimates of white-tailed deer in the Black Hills from distance sampling transects, 2012 –
2020. ........................................................................................................................................................... 14
Figure 13. Yearly statewide winter severity indices in South Dakota compared with 30-year average,
2003-04 to 2019-20..................................................................................................................................... 16
Figure 14 . Winter severity index values compared with 25-30 year normal in South Dakota for the
winters of 2018-19 and 2019-20................................................................................................................. 17

                                                                                   iii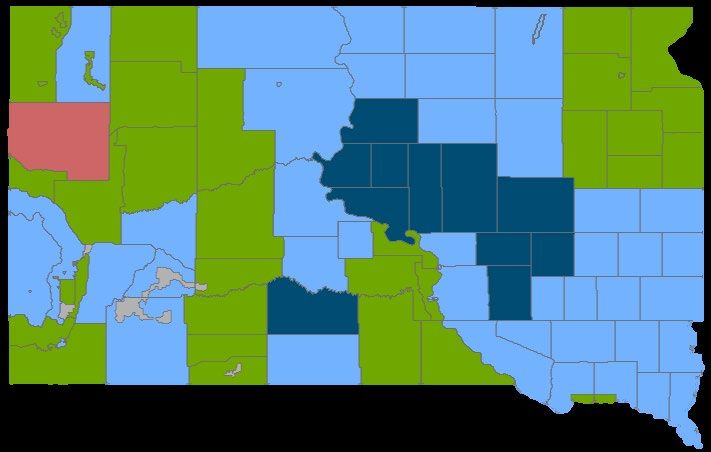
LIST OF APPENDICIES

Appendix A. The 2017 Deer Management Plan objectives to manage white-tailed deer and mule deer
populations for both maximum and quality recreational hunting opportunities, considering all social and
biological inputs. ......................................................................................................................................... 20
Appendix B. Harvest information for mule deer and white-tailed deer hunting season in 2020 in South
Dakota. ........................................................................................................................................................ 21
Appendix C. DAU 1 – Grand River Study Area ........................................................................................... 22
Appendix D. DAU 2 – Belle Fourche River Study Area............................................................................... 23
Appendix E. DAU 3 – Black Hills Study Area .............................................................................................. 24
Appendix F. DAU 4 – White River Study Area ........................................................................................... 25
Appendix G. DAU 5 – Cheyenne River Study Area .................................................................................... 26
Appendix H. DAU 6 – Upper Missouri River Study Area ............................................................................ 27
Appendix I. DAU 7 – Lower Missouri River Study Area ............................................................................. 28
Appendix J. DAU 8 – Lower James River Study Area ................................................................................. 29
Appendix K. DAU 9 – Upper James River Study Area ................................................................................ 30
Appendix L. DAU 10 – Prairie Coteau Study Area...................................................................................... 31
Appendix M. DAU 11 – Big Sioux River Study Area ................................................................................... 32

                                                                                iv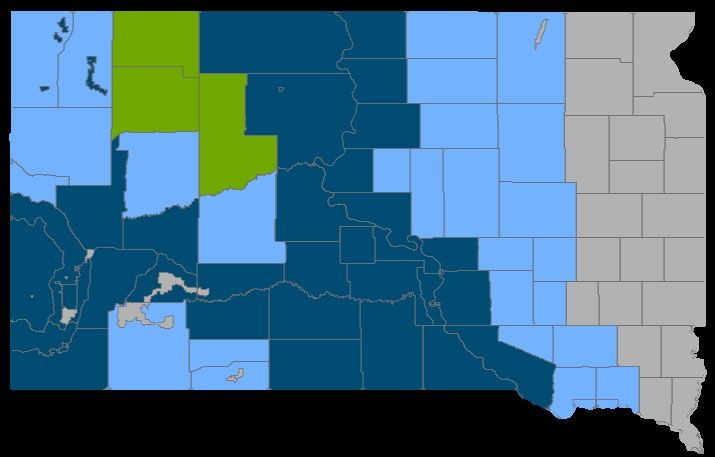
INTRODUCTION

South Dakota’s diverse landscapes of grassland, cropland, and timbered areas are home to white-tailed
deer (Odocoileus virginianus) across the entire state and mule deer (Odocoileus hemionus) primarily
adjacent to and west of the Missouri River breaks. Deer hunting is a popular and much awaited outdoor
activity for many sportsmen and women in South Dakota. Within South Dakota, approximately 62,900
residents and 7,600 non-residents hunted deer in 2020, with peak deer hunter participation occurring in
2010 when 81,478 residents and non-residents pursued deer. Hunting remains the number one tool for
managing deer populations across South Dakota and harvest strategies are intended to ensure the well-
being of the species and its habitat while maintaining populations at levels compatible with human
activity and land use.

White-tailed deer and mule deer management units are managed towards objectives to increase,
maintain, or decrease populations. All management unit objectives are based on annual collection and
evaluation of deer biological data, habitat resources, weather data, private land depredation issues, and
substantial input from a wide variety of publics with an interest in deer management in South Dakota.
South Dakota Department of Game, Fish, and Parks (SDGFP) will adopt harvest strategies that
progressively allow white-tailed deer and mule deer to reach these population objectives.

The current over-riding goal for deer management is to “manage white-tailed deer and mule deer
populations and habitats by fostering partnerships and stewardship and applying biological and social
sciences” (SDGFP 2017). More specific information on deer population objectives, strategies, and
research in South Dakota can be found in the South Dakota White-tailed Deer and Mule Deer
Management Plan at https://gfp.sd.gov/UserDocs/nav/deer-mgmnt.pdf.

The following report provides a statewide overview of deer surveys and assessments conducted by the
SDGFP and an update on the population status of white-tailed deer and mule deer in South Dakota.

                                                    1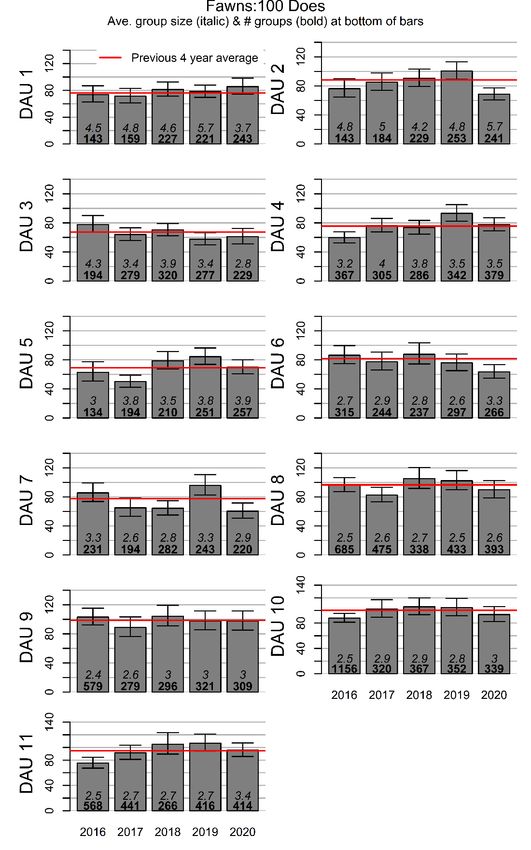
POPULATION SURVEYS AND ASSESSMENTS

Mule deer and white-tailed deer herds are monitored annually across their range in South Dakota.
Survey efforts are completed to assess herd status and predict population trends in eight data analysis
units (DAUs) for mule deer and 11 DAUs for white-tailed deer. We define a DAU as an aggregate of deer
management units that is large enough to produce reliable estimates from population surveys while
representing similar habitat, climatic, and demographic characteristics. The final product of an analysis
performed by the University of Montana in collaboration with SDGFP resulted in the development of 11
DAUs (Figure 1; SDGFP 2017).

Figure 1. Data Analysis Units (DAUs) for deer management in South Dakota.

Current strategies to manage and evaluate deer populations include establishing population objectives,
hunting season evaluations, disease monitoring, herd composition surveys, survival monitoring,
calculating winter severity indices, abundance surveys, and population modeling. Survey data are
presented at different forums at many geographic scales, but most data are collected and analyzed at
the DAU level for purposes of evaluating herd abundance and trends and for determining proper license
allocation. The following sections provide a general overview of the surveys and results, but more
detailed datasets and descriptions of analyses can be found in Norton et al. (2021).

Population Objectives

Population objective directions (increase, maintain, or decrease) for each firearm deer hunting unit are
set every 2 years when season recommendations are brought forward to the SDGFP commission (Figure

                                                    2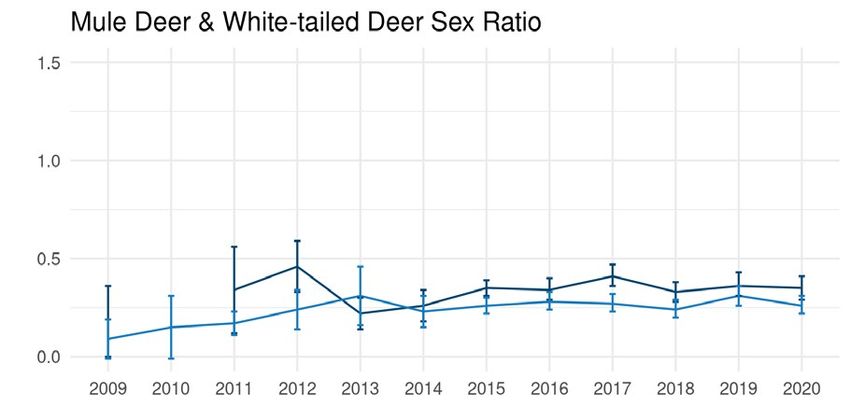
2). Deer population objectives for each unit are based on population assessments, habitat conditions,
and social considerations.

Within the Black Hills data analysis unit, SDGFP has estimated white-tailed deer abundance for multiple
years and therefore was able to define a pre-season abundance objective of 70,000 (65,000-75,000)
white-tailed deer. In addition, because hunter satisfaction is strongly correlated with hunter success,
SDGFP has established minimum success thresholds for licenses containing “any deer” or “any whitetail”
firearm tags (Appendix A). Furthermore, in Limited Access Units, harvest must meet either hunter
success or license density thresholds (Appendix A; firearm license densities no greater than 1.5
licenses/square mile for “any deer” licenses and no greater than 2.5 licenses/square mile for “any
whitetail” licenses).

                                                                 Mule Deer

                                                                  White-tailed Deer

Figure 2. Population objectives for mule deer and white-tailed deer, 2021-22. Areas in gray do not
have established objectives.

Hunting Season Evaluations

There are currently a variety of deer hunting opportunities and a number of license types that a hunter
can choose from when applying for a deer license. Each deer hunting season has an assortment of

                                                   3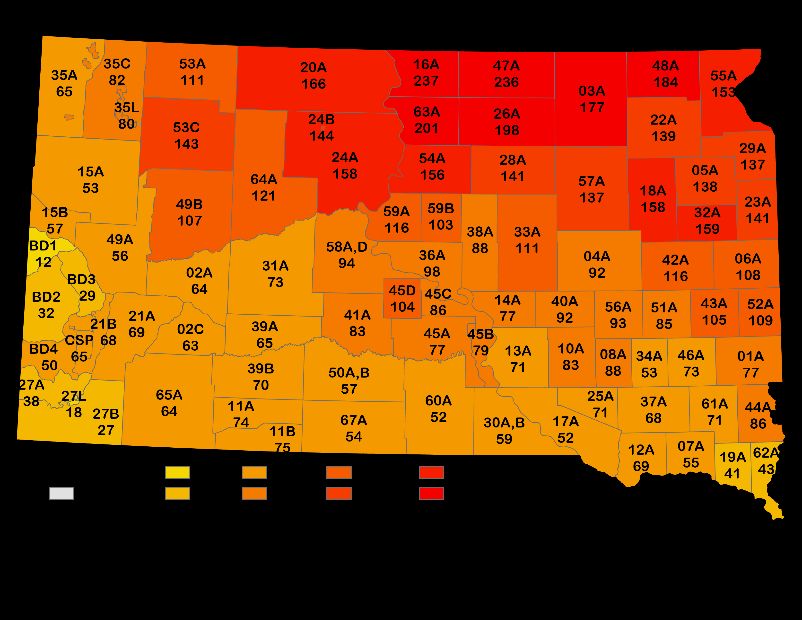
license types available which determines the available tag distribution. License types define the type
and number of deer tags available for a respective license. For each license type, SDGFP estimates
harvest by species, sex, and age cohorts allowing staff to be able to predict harvest composition based
on previous years’ success. This provides wildlife managers the ability to reduce or increase harvest
pressure on specific species and sex classes of the deer population in order to reach unit population
objectives.

Currently all deer hunters are surveyed via email or electronic submission methods. Annual deer hunter
surveys are conducted to estimate harvest at each management unit for each species and age/sex
cohorts. Statewide harvest for white-tailed deer has slowly increased from a recent low of about 41,200
in 2014 to 51,600 deer in 2020 (Figure 3). SDGFP has maintained a low white-tailed deer doe harvest of
about 17,000 for the past several years to allow many herds in the state to increase to more desirable
levels while maintaining harvest in other areas that are closer to objectives. Statewide mule deer
harvest has slowly increased as well from a low of about 5,400 in 2014 to 7,400 in 2020, mostly due to
increased buck harvest since doe harvest has been substantially restricted for the past 7 years (Figure 3).
A consistently low mule deer doe harvest of approximately 1,500 has allowed some deer herds of the
state to grow to more desirable levels although many areas are still substantially below objective (Figure
2 and Figure 3).

                 Whitetail Harvest                                   Mule Deer Harvest
 90,000                                              20,000

 80,000                                              18,000

 70,000                                              16,000
                                                     14,000
 60,000
                                                     12,000
 50,000
                                                     10,000
 40,000
                                                        8,000
 30,000
                                                        6,000
 20,000                                                 4,000
 10,000                                                 2,000
     0                                                     0
          2000
          2001
          2002
          2003
          2004
          2005
          2006
          2007
          2008
          2009
          2010
          2011
          2012
          2013
          2014
          2015
          2016
          2017
          2018
          2019
          2020

                                                                2000
                                                                2001
                                                                2002
                                                                2003
                                                                2004
                                                                2005
                                                                2006
                                                                2007
                                                                2008
                                                                2009
                                                                2010
                                                                2011
                                                                2012
                                                                2013
                                                                2014
                                                                2015
                                                                2016
                                                                2017
                                                                2018
                                                                2019
                  TOTALS    Doe      Buck                       2020  TOTALS    Doe      Buck

Figure 3. Estimated white-tailed deer and mule deer harvest trends, 2000-2020.

License sales for all deer seasons combined were approximately 106,300 in 2019 and 112,900 in 2020.
In 2020, there were about 70,470 unique deer hunters (68,640 in 2019) that overall spent around
602,700 days participating in deer hunting. Harvest by weapon type for all firearm seasons in 2020 was
about 47,300 deer, while archery and muzzleloader hunters harvested approximately 10,400 and 1,300
deer respectively (Table 1). License sales and harvest information for each hunting season for 2020 can
be found in Appendix B. Harvest data are evaluated at both the firearm unit and DAU level. See
Appendices C-M for trend figures of DAU harvest by species and Norton et al. (2021) for more harvest
information at the unit level.

                                                    4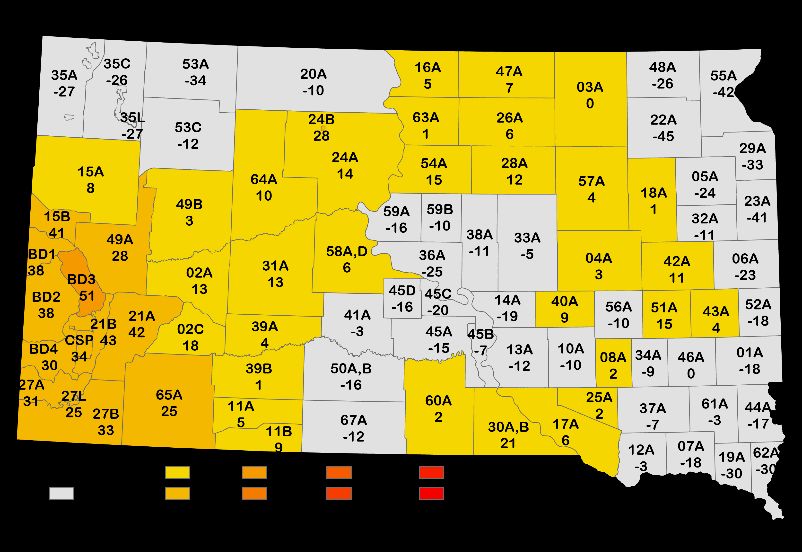
Table 1. Deer harvest in 2020 by weapon type in South Dakota.
White-tailed Deer Mule Deer Total
Firearm 41,422 5,866 47,288
Archery 9,061 1,384 10,445
Muzzleloader 1,154 186 1,341
TOTAL 51,637 7,436 59,074
Disease Monitoring
Chronic Wasting Disease
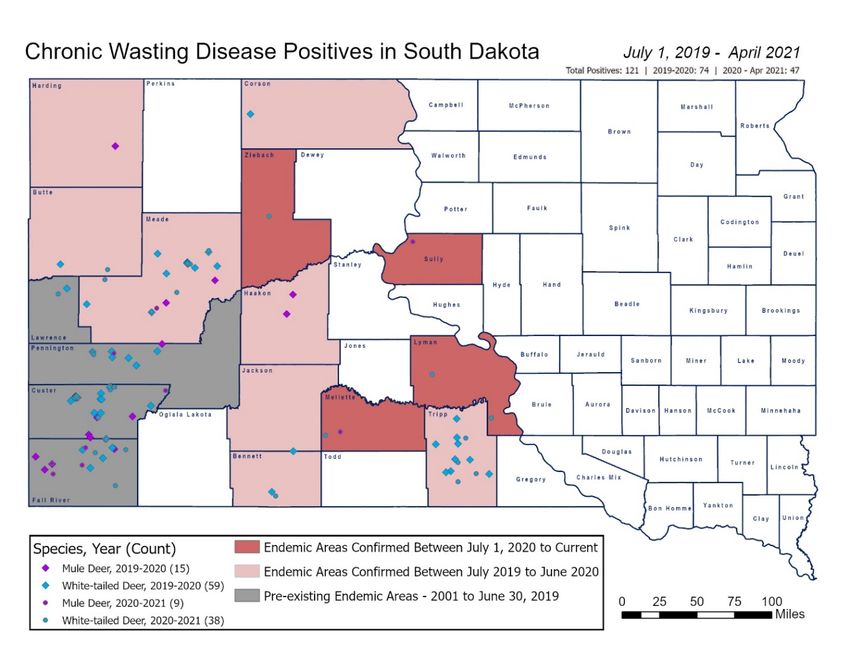
Since 2001, chronic wasting disease (CWD) has been found in 245 elk, 115 mule deer, and 243 white-
tailed deer in numerous areas of South Dakota. In the past 2 hunting seasons, SDGFP has detected CWD
in 97 white-tailed deer and 24 mule deer (Figure 4). These include 1 white-tailed deer and 1 mule deer
from within the boundaries of Wind Cave National Park, 5 white-tailed deer from Custer State Park, 4
white-tailed deer and 1 mule deer from Black Hills Fire firearm units, 64 white-tailed deer and 21 mule
deer from west river firearm units, and 1 mule deer from an east river firearm unit. Additionally, 23
white-tailed deer and 1 mule deer were found positive for CWD from city deer removals within the last 2
years. Figure 4 shows the documentation of CWD within South Dakota over the past 2 years. Prior to
2019, CWD had only been documented in 4 counties in the Black Hills area. During the 2019 hunting
seasons, CWD was documented in 8 additional counties, and in 2020, CWD was found in 4 more
counties (Figure 4).
The South Dakota Chronic Wasting Disease Action Plan was approved by the GFP Commission in June of
2019 (https://gfp.sd.gov/userdocs/docs/Final_SD_CWD_Action_Plan_August_2020.pdf).
Communication with all stakeholders within South Dakota is key to a successful CWD Action Plan. This is
a working Action Plan with the key points including: investigating regulations regarding interstate and
intrastate movement of carcasses, baiting and feeding of wildlife, use of urine based lures, translocation
of cervids, game processors, taxidermist, donation of venison, and expansion of surveillance areas to
determine current presence of CWD surrounding known endemic areas. The GFP Commission created
regulations for the transportation and disposal of deer and elk carcasses from other states and from
hunting units within South Dakota’s known CWD endemic areas (Figure 4) for the 2020 hunting seasons:
https://gfp.sd.gov/2020-cwd-regulations/. New regulations are currently being considered by the
SDGFP Commission for the 2021-22 hunting seasons in South Dakota.
Epizootic Hemorrhagic Disease
The State of South Dakota experienced a mortality event of mainly white-tailed deer during July-
November 2020 due to Epizootic Hemorrhagic Disease (EHDV) and/or Blue Tongue (BTV). The South
Dakota Department of Game, Fish, and Parks (SDGFP) received reports of sick and deceased white-tailed
deer, mule deer or pronghorn during the summer and fall of 2020. As in previous years with mortality in
the summer months, EHDV was suspected and efforts were made to document the virus through the
Diagnostic Lab at South Dakota State University. Through laboratory testing, confirmation was received
that the EHDV virus was present in 25 white-tailed deer and 2 mule deer. The SDGFP investigated many
sick and dead ungulates that would be associated with EHDV/BTV.
5Figure 4. Chronic wasting disease positive wild white-tailed and mule deer in South Dakota,
2019-2021.
Thirty-seven counties from across South Dakota had suspected, reported, or confirmed EHDV or BTV
virus in white-tailed deer, mule deer, or pronghorn (Figure 5). Statewide, a total of 665 dead or sick
animals were recorded in 2020, which included 663 deer and 2 pronghorn. Only 27 cases of EHDV or
BTV was reported in South Dakota in 2019 (Figure 6). Most cases in 2020 were found east of the
Missouri River with additional disease found in the NW parts of South Dakota. Reported losses from
EHD in 2020 affected unit objectives and 2021-22 license allocations in several hunting units.
Preliminary assessments of adult doe survival studies provided further evidence that whitetail survival
decreased substantially in many populations where public and staff reported EHD mortalities.
6Figure 5. Locations of reported deer, pronghorn, and elk mortalities presumably caused by
Hemorrhagic disease in South Dakota, 2020. Red locations indicate positive results from
laboratory testing.
4000
Number of reported mortalities
3500
3000
2500
2000
1500
1000
500
0
2009
2010
2011
2012
2013
2014
2015
2016
2017
2018
2019
2020
Year
Figure 6. Annual reported hemorrhagic disease mortalities of deer, elk, pronghorn, and bighorn
sheep in South Dakota, 2009-2020.
7Herd Composition Surveys
Pre-season herd composition surveys of white-tailed deer and mule deer populations have been
conducted annually throughout the state of South Dakota since the early 1940s in some areas, but
decent records only exist back to the 1970s or 1980s. Current herd composition ground surveys are
completed by driving roads or hiking in areas of known deer concentrations in September and October
(Appendices C-M). All deer herds that are observed in their entirety are classified to numbers of fawns,
does, and bucks. Spatial data are also recorded for each observation in order to reduce double-counting
occurrences. A minimum sample size of 200-400 independent group observations per species per DAU
is currently obtained to ensure sufficient precision in herd composition estimates. Age ratios are
calculated as fawns:100 does and are used as an indicator of fall recruitment into the population. Sex
ratios are calculated as bucks:100 does and are an important parameter used in population modeling.
In 2020, SDGFP staff counted and classified 17,086 deer (5,985 mule deer; 11,101 white-tailed deer) to
estimate herd composition across the state. Statewide sex ratios were 24 bucks:100 does (95% CI: 23-
26) for white-tailed deer and 47 (44-50) for mule deer. Statewide recruitment of white-tailed deer is
consistently higher than that observed in mule deer populations (Figure 7). In 2020, mule deer
recruitment was 79 fawns:100 does (95% CI: 66-67) statewide but varied from a high of 80 (71-92) in
DAU1 to a low of 47 (36-61) in DAU8 (Figure 8). For white-tailed deer, recruitment varied from 60 (51-
72) in DAU7 to 97 (85-111) in DAU9 but averaged 79 (76-82) statewide (Figure 9). Quantifying deer
recruitment for each DAU is critical to estimate growth rates and determine appropriate license
allocation deer herds throughout the variable landscapes of South Dakota.
Figure 7. Statewide estimates of recruitment for white-tailed deer and mule deer in South
Dakota, 2011 – 2020.
8Figure 8. Age ratios from Herd Composition surveys for mule deer, 2016-2020.
9Figure 9. Age ratios from Herd Composition surveys for white-tailed deer, 2016-2020.
10Survival Monitoring
Understanding population dynamics of both white-tailed and mule deer and determining annual rates of
population change requires knowledge of fawn, juvenile, and adult survival rates. Annual rates of
change within a deer population are influenced primarily by adult survival and the number of fawns that
reach one year of age. Radio-collared deer have been used to produce survival estimates in South
Dakota for over 20 years, and methods continue to evolve to provide more robust estimates (see Norton
et al. 2021). Within current active monitoring areas, adult females (17+ months) and juveniles (5-16
months) are primarily captured via helicopter net gun and fitted with a VHF or GPS radio collar.
Monitoring occurs one time each month for each collared individual.
Survival rates are used to estimate deer numbers and monitor changes in populations as the result of
changes in winter conditions, disease outbreaks, or harvest strategies. Increased efforts to obtain
statistically valid survival estimates within a defined data analysis unit have been occurring in recent
years, with sample sizes of radio-collared mule deer and white-tailed increased significantly (105 adults
and 110 juveniles). Since 2013, over 5,000 deer have been radio-collared to evaluate survival in South
Dakota for 2 species, 2 sexes, and 2 age cohorts (Figure 10). Currently, SDGFP is actively capturing and
monitoring GPS collared mule and white-tailed deer in DAU1, approximately 105 adults and 110
juveniles of each species. Other areas where survival monitoring is occurring include DAUs 4 and 6 for
mule deer, and DAUs 8 and 10 for white-tailed deer.
Preliminary survival estimates are available in 6 DAUs for white-tailed deer and 4 DAUs for mule deer in
2020. White-tailed deer survival for juveniles was 87% (95% CI:80-93), adult bucks 74% (61-89), and
adult does varied from 73% (66-81) to 95% (90-99; Table 2). Survival rates for mule deer were 59% (95%
CI:48-68) for juveniles while adult does varied from 77% (67-89) to 84% (76-92;Table 3).
Figure 10. Winter capture and radio-collaring locations of mule deer and white-tailed deer in South
Dakota, 2013-2020.
11Table 2. Preliminary survival rates of white-tailed deer by DAU in 2020.
Adult Does
DAU Annual Survival Lower 95% CI Upper 95% CI n
1 95% 90% 99% 102
3 75% 62% 89% 53
8 73% 66% 81% 148
9 85% 76% 95% 76
10 85% 79% 92% 132
11 85% 76% 95% 71
Juveniles
DAU Annual Survival Lower 95% CI Upper 95% CI n
1 87% 80% 93% 105
Adult Bucks
DAU Annual Survival Lower 95% CI Upper 95% CI n
3 74% 61% 89% 46
Table 3. Preliminary survival rates of mule deer by DAU in 2020.
Adult Does
DAU Annual Survival Lower 95% CI Upper 95% CI n
1 83% 76% 91% 113
3 77% 67% 89% 61
4 84% 76% 92% 95
6 82% 75% 90% 114
Juveniles
DAU Annual Survival Lower 95% CI Upper 95% CI n
1 59% 49% 70% 92
Survival studies have been instrumental in providing area specific biological data for SDGFP managers to
use in evaluating deer populations and management options. Although these data often provide the
only means to estimate population abundance and trends for local deer herds, survival rate data are still
lacking in many areas. Future evaluations of spatial and temporal relationships in survival data will be
critical in assessing the need for continued survival studies. In addition, a current collaborative research
project with University of Montana is further evaluating mule deer and white-tailed deer survival in
DAU1 and the relationships between survival, weather, movements, and habitat.
Abundance Surveys
Aerial sightability surveys
Sightability models are used to calculate the detection probability of individual groups and correct for
groups missed during surveys by documenting factors affecting animal detection (Samuel et al. 1987).
Models are developed by flying over groups of animals that include radio-collared individuals and by
12recording covariates for individual groups both observed and undetected by observers (Samuel et al.
1987). A sightability model derived by Robling 2011, is applicable to DAU 9 and DAU 10 with a detection
rate of 84.4%, with visibility significantly influenced by group size and canopy cover. In the winter of
2017-2018, the entire DAU 10 was flow during 100% snow cover conditions and 18,383 deer were
counted providing an estimate of 19,655 (95% CI = 19,121 – 20,780) white-tailed deer for the entire
DAU. In the winter of 2018-2019, the entire DAU 9 was flown during 100% snow cover conditions and
30,210 deer were observed providing an estimate of 33,616 (95% CI = 31,078 – 34,824) white-tailed
deer for the entire DAU. No surveys were flown in the past 2 years.
Road transect distance sampling
Beginning in 2016, spotlight road surveys were completed by SDGFP within the boundaries of the Black
Hills DAU (i.e., DAU 3), where distance sampling models have recently been developed to estimate
white-tailed deer abundance (Cudmore 2017). Sixty transect routes have been selected by General
Randomized Tessellation Stratified sampling (Stevens and Olsen 2004), with transect lengths varying
from 3.5 km to 16 km (Figure 11). Surveys are conducted during the last two weeks of August, beginning
½ hour after sunset and generally lasting 3-5 hours depending on transect length and the number of
deer observed. Spotlights are used to locate deer on both sides of the transect. Each survey has two
observers, with the driver serving as one of the observers.
Figure 11. Road transects used for spotlight deer survey in the Black Hills.
13Distance sampling surveys over the past 2 years has resulted in a Black Hills white-tailed deer population
estimate of approximately 42,700 (+ 5,700 SE) in 2019 and 45,000 (+ 5,000 SE) in 2020, substantially
lower than previous years’ estimates that were around 60,000 or more deer (Figure 12). Variability and
low precision make interpretation of distance sampling surveys challenging, but regardless the results
suggest that white-tailed deer are below the 70,000 deer objective established for the Black Hills.
Figure 12. Estimates of white-tailed deer in the Black Hills from distance sampling transects, 2012 –
2020.
Population Modeling
One of the first and most important steps in modeling deer populations is to first define a qualitative
population objective (i.e., substantially decrease, slightly decrease, maintain current level, slightly
increase, substantially increase). This process involves SDGFP staffs obtaining stakeholder’s opinions
regarding the status of deer populations within individual firearm deer hunting units throughout the
year (SDGFP 2017). Multiple sources of public opinion are used in formulating population objectives and
include personal contacts with landowners and hunters, open houses, regional advisory meetings,
hunter and landowner opinion surveys, hunter harvest surveys quantifying success and satisfaction
ratings, and other submitted comments. Once the data are reviewed and summarized, internal staff
meetings are then conducted at the regional level to discuss public input received regarding deer
population abundance levels, deer depredation issues, landowner tolerance, hunter comments, and
harvest results from the previous season. The end result is a defined qualitative population objective for
each firearm management unit.
14After a qualitative management unit objective is defined, a numerical value is assigned to that
management unit (i.e., substantially decrease = 1, slightly decrease = 2, maintain current level = 3,
slightly increase = 4, substantially increase = 5), which is used in defining a population objective at a
larger Data Analysis Unit level. The first step in the development of a DAU population objective is to
determine how much weight each firearm unit objective contributes to the overall DAU objective. This
step incorporates unit harvest proportions within a DAU to weight each unit objective appropriately
because not all units within a DAU have equal harvest rates. Unit harvest proportions are calculated by
taking the 5-year harvest average of white-tailed deer or mule deer within the defined management unit
divided by the total 5-year harvest average for the entire DAU. The management unit objective is then
multiplied by the harvest proportion for that unit and the sum of the weighted values for all the units
within the DAU then becomes the numerical DAU population objective. The DAU objective is then
assigned a lambda rate (i.e., rate of change to population abundance) objective based on pre-
determined ranges that are realistic for most deer herds in South Dakota (Table 4). To quantify the
objective lambda value, the DAU objective is entered into the following linear regression equation:
0.1456 (DAU Objective) + 0.5631 = Lambda Objective.
Table 4. Categorical objective values based on qualitative objective.
Qualitative Objective Unit Objective DAU Objective Lambda Objective
Substantially decrease 1 1.0 - 1.5 0.7 - 0.8
Slightly decrease 2 1.5 - 2.5 0.8 - 0.9
Maintain 3 2.5 - 3.5 0.9 - 1.1
Slightly increase 4 3.5 - 4.5 1.1 - 1.2
Substantially increase 5 4.5 - 5.0 1.2 - 1.3
Once the lambda objective is defined, integrated population models are used to generate population
projections for each DAU (lambda and abundance estimates) based on modeling inputs (e.g., adult
female survival, adult male survival, juvenile survival, recruitment). Harvest-based population models
are used to reconstruct the previous year pre-hunting season population and project abundance to
future years for each DAU while considering various harvest management strategies for each
management unit (Norton et al. 2021). The projected (model generated) and objective lambdas are
then compared and future antlerless harvest strategies are manipulated to achieve the desired lambda
objective rate derived from the DAU population objective. Antlerless harvest is assumed to be additive
and the number of antlerless deer added or removed from the population is calculated at the DAU level
and then distributed to the unit level in accordance with the defined unit objective. Three-year average
harvest success rates are calculated for all previously used license types within the management unit
and license combinations needed to achieve unit level antlerless harvest recommendations are selected
for future harvest season license recommendations. This process is repeated for all mule deer and
white-tailed deer management firearm management units across the state.
Reliable DAU abundance estimates are lacking in most areas of the state, therefore population
estimates are most valuable for assessing population trends and license allocations. Before the hunting
season in 2020, harvest reconstruction estimates resulted in ~400,000 white-tailed deer and ~80,000
mule deer in South Dakota.
15Winter Severity Index
Winter severity is an important metric contributing to survival of free ranging mule deer and white-
tailed deer (Verme 1968). Relating how climatic conditions impact deer survival and subsequent
recruitment has potential predictive value and can assist managers in determining if severe winter
weather impacts population growth rates. Based on a winter severity index (WSI) developed by
Baccante and Woods (2010), SDGFP currently utilizes mean monthly temperature and total monthly
snowfall data from November through April as covariates for the following linear model that quantifies a
WSI:
• Monthly WSI = (Mean monthly temperature * (-0.1) +1) * (Total monthly snowfall)
• Annual WSI Value = Sum [mean monthly WSI values (Nov + Dec + Jan + Feb + Mar +Apr)]
Weather data are obtained through an annual data request via the National Oceanic and Atmospheric
Administration (NOAA). Program R, a statistical software package (R Core Team 2015) is used to
extrapolate weather data across all deer units using an inverse distance weighted interpolation (IDW)
function. The winter of 2018-19 was relatively minor compared with normal 30-year average winter
data and little if any deer losses were expected (Figure 13). The winter of 2019-20 was more severe
than average in several areas of the state, however, and suspected losses will affect SDGFP license
allocations for 2021-22 (Figure 14).
Figure 13. Yearly statewide winter severity indices in South Dakota compared with 30-year average,
2003-04 to 2019-20.
16Figure 14 . Winter severity index values compared with 25-30 year normal in South Dakota for the
winters of 2018-19 and 2019-20.
17Data analyses to evaluate how varying degrees of winter severity values impact deer population
performance are on-going. The continued compilation of juvenile and adult survival and recruitment
data are necessary to make sound scientific relationships between WSI values and how those values
impact mule deer and white-tailed deer population performance spatially and temporally. The
occurrence of a severe winter while statistically valid sample sizes are available is vitally important in
formulating robust regression equations that can predict survival and potential reproductive rates
during years with similar winter severity values.
SUMMARY
Deer are the most abundant and sought-after big game species in South Dakota, with over 70,000
unique deer hunters spending well over one half million days hunting in 2020. The South Dakota Game,
Fish, and Parks conducts numerous surveys to obtain important biological data for the management of
both mule deer and white-tailed deer populations across the state. Herd composition surveys are
conducted every fall and provide important data on age and sex ratios. Over the past 2 years statewide
deer recruitment has been near long-term averages, although rates vary between areas. Hunting
seasons are managed to align deer densities with unit specific objectives, while also considering
established hunter success thresholds. Hunter surveys are conducted annually to estimate harvest,
hunter success, and satisfaction. Total deer harvest increased in 2020 to approximately 59,000, with
about 51,600 white-tailed deer and 7,400 mule deer harvested. Survival rates are currently monitored
in 6 study areas for white-tailed deer, and 4 areas for mule deer. Survival rates for adult does in most
areas have been about 80-85%, with adult buck and juvenile rates usually lower and more variable.
Aerial deer surveys in the northeast part of the state have not been conducted in the past few years, but
distance sampling road transects in the Black Hills were conducted and suggest white-tailed deer
densities are below objective. Deer abundance in the remainder of the state is estimated using harvest
and harvest rate data, while population trends are estimated using biological data from surveys such as
annual survival, recruitment, and harvest. In addition, other important data include diseases and
extreme weather. Deer losses to hemorrhagic disease were minimal in 2019 but several areas were
negatively impacted in 2020. Winter severity varies by area of the state, but statewide the winter was
more severe in 2019 than 2020 and over-winter deer mortalities were observed in several management
units. Overall, based on conservative harvests, adequate recruitment and annual survival, minimal
disease and winter losses, deer herds across much of the state are increasing. This varies by unit,
however, with some areas showing strong growth rates while others very minimal. In general, white-
tailed deer herds are growing at a faster rate than mule deer.
18LITERATURE CITED
Baccante, D. and R. Woods. 2010. Relationship between winter severity and survival of mule deer fawns
in the Peace Region of British Columbia. BC Journal of Ecosystems and Management 10(3):145-
153 pp.
Cudmore, Kristopher W. 2017. An evaluation of deer and pronghorn surveys in South Dakota. M.S.
Thesis, South Dakota State University, Brookings, USA.
Norton, A. S., A. J. Lindbloom, L. M. Wiechmann, and S. L. Griffin. 2021. Compilation of Deer Survey
Methods and Results Reports. South Dakota Game, Fish, and Parks.
Samuel, M. D., E. O. Garton, M. W. Schlegel, and R. G. Carson. 1987. Visibility bias during aerial surveys
of elk in northcentral Idaho. Journal of Wildlife Management 51:622-630 pp.
South Dakota Department of Game, Fish and Parks. 2017. South Dakota white-tailed deer and mule
deer management plan, 2017-2023. Completion Report 2017-02. South Dakota Department of
Game, Fish and Parks, Pierre, South Dakota, USA.
Verme, L. J. 1968. An index of winter weather severity for northern deer. Journal of Wildlife
Management 32(3):566-574 pp.
19APPENDIX
Appendix A. The 2017 Deer Management Plan objectives to manage white-tailed deer and mule deer
populations for both maximum and quality recreational hunting opportunities, considering all social and
biological inputs.
Strategy 3E. Manage Limited Access Units (24B, 27L, 35L; see Quality Deer Management section) and
CSP for a quality hunting experience by using the following established thresholds:
1. Maintain a minimum 1st tag harvest success of 75% (3-year average) for licenses
containing “any deer” or “any whitetail” firearm tags; or
2. Maintain firearm license densities no greater than 1.5 licenses/square mile for “any
deer” licenses and no greater than 2.5 licenses/square mile for “any whitetail”
licenses.
Strategy 3F. Manage for a minimum 1st tag harvest success of 70% (3-year average) for licenses
containing “any deer” or “any whitetail” tags in the Black Hills firearm deer season.
Strategy 3G. Manage for a minimum 1st tag harvest success of 60% (3-year average) for licenses
containing “any deer” or “any whitetail” tags in each West River firearm deer season
unit.
Strategy 3H. Manage for a minimum 1st tag harvest success of 50% (3-year average) for licenses
containing “any deer” or “any whitetail” tags in each East River and National Wildlife
Refuge firearm deer season unit.
Strategy 3I. Manage for a minimum 1st tag harvest success of 40% (3-year average) for muzzleloader
licenses containing “any deer” or “any whitetail” tags in each USFWS Refuge deer
hunting unit.
20Appendix B. Harvest information for mule deer and white-tailed deer hunting season in 2020 in
South Dakota.
mule deer harvest white-tailed deer harvest
Season tags sold tag success buck doe total buck doe total
Archery 34,243 30% 1234 150 1384 6253 2807 9060
Apprentice 4,302 58% 26 372 398 249 1847 2096
Mentored 6,387 57% 21 472 493 371 2773 3144
Muzzleloader 3,707 36% 170 17 187 272 882 1154
LOL Free 387 57% 0 0 0 9 212 221
Antlerless
WR Deer 25,888 56% 3042 237 3279 7266 4058 11324
WR Deer LOL 4,463 49% 527 214 741 917 546 1463
WR Special Buck 1,957 74% 465 4 469 964 16 980
ER Deer 29,299 49% 223 23 246 8744 5405 14149
ER Deer LOL 11,537 40% 98 36 134 2807 1655 4462
ER Special Buck 499 55% 18 0 18 250 6 256
Sand Lake NWR 118 34% 0 0 0 35 5 40
Lacreek NWR 19 47% 0 0 0 9 0 9
Waubay NWR 22 23% 0 0 0 5 0 5
Black Hills Deer 5,193 63% 75 7 82 2269 897 3166
Custer State Park 88 65% 3 0 3 28 26 54
21Appendix C. DAU 1 – Grand River Study Area
Herd Composition
Harvest
Male Female MULE DEER HARVEST Male Female WHITE-TAILED DEER HARVEST
4000 5000
3000 4000
3000
2000
2000
1000 1000
0 0
2005
2006
2007
2008
2009
2010
2011
2012
2013
2014
2015
2016
2017
2018
2019
2020
2005
2006
2007
2008
2009
2010
2011
2012
2013
2014
2015
2016
2017
2018
2019
2020
Winter Severity Index
DAU 1
350
300
250
200
WSI
150
100
50
0
22Appendix D. DAU 2 – Belle Fourche River Study Area
Herd Composition
Harvest
Male Female MULE DEER HARVEST Male Female WHITE-TAILED DEER HARVEST
3000 10000
2500
2000
1500 5000
1000
500
0 0
2005
2006
2007
2008
2009
2010
2011
2012
2013
2014
2015
2016
2017
2018
2019
2020
2005
2006
2007
2008
2009
2010
2011
2012
2013
2014
2015
2016
2017
2018
2019
2020
Winter Severity Index
DAU 2
300
250
200
WSI
150
100
50
0
23Appendix E. DAU 3 – Black Hills Study Area
Herd Composition
Harvest
Male Female MULE DEER HARVEST Male Female WHITE-TAILED DEER HARVEST
1500 10000
1000
5000
500
0 0
2005
2006
2007
2008
2009
2010
2011
2012
2013
2014
2015
2016
2017
2018
2019
2020
2005
2006
2007
2008
2009
2010
2011
2012
2013
2014
2015
2016
2017
2018
2019
2020
Winter Severity Index
DAU 3
300
250
200
WSI
150
100
50
0
24Appendix F. DAU 4 – White River Study Area
Herd Composition
Harvest
Male Female MULE DEER HARVEST Male Female WHITE-TAILED DEER HARVEST
6000
10000
4000
5000
2000
0 0
2005
2006
2007
2008
2009
2010
2011
2012
2013
2014
2015
2016
2017
2018
2019
2020
2005
2006
2007
2008
2009
2010
2011
2012
2013
2014
2015
2016
2017
2018
2019
2020
Winter Severity Index
DAU 4
250
200
150
WSI
100
50
0
25Appendix G. DAU 5 – Cheyenne River Study Area
Herd Composition
Harvest
Male Female MULE DEER HARVEST Male Female WHITE-TAILED DEER HARVEST
4000 4000
3000
2000 2000
1000
0 0
2005
2006
2007
2008
2009
2010
2011
2012
2013
2014
2015
2016
2017
2018
2019
2020
2005
2006
2007
2008
2009
2010
2011
2012
2013
2014
2015
2016
2017
2018
2019
2020
Winter Severity Index
DAU 5
300
250
200
WSI
150
100
50
0
26Appendix H. DAU 6 – Upper Missouri River Study Area
Herd Composition
Harvest
Male Female MULE DEER HARVEST Male Female WHITE-TAILED DEER HARVEST
1000 10000
800
600
5000
400
200
0 0
2005
2006
2007
2008
2009
2010
2011
2012
2013
2014
2015
2016
2017
2018
2019
2020
2005
2006
2007
2008
2009
2010
2011
2012
2013
2014
2015
2016
2017
2018
2019
2020
Winter Severity Index
DAU 6
350
300
250
200
WSI
150
100
50
0
27Appendix I. DAU 7 – Lower Missouri River Study Area
Herd Composition
Harvest
Male Female MULE DEER HARVEST Male Female WHITE-TAILED DEER HARVEST
2500 8000
2000 6000
1500
4000
1000
500 2000
0 0
2005
2006
2007
2008
2009
2010
2011
2012
2013
2014
2015
2016
2017
2018
2019
2020
2005
2006
2007
2008
2009
2010
2011
2012
2013
2014
2015
2016
2017
2018
2019
2020
Winter Severity Index
DAU 7
250
200
150
WSI
100
50
0
28Appendix J. DAU 8 – Lower James River Study Area
Herd Composition
Harvest
Male Female MULE DEER HARVEST Male Female WHITE-TAILED DEER HARVEST
15000
800
600 10000
400
5000
200
0 0
2005
2006
2007
2008
2009
2010
2011
2012
2013
2014
2015
2016
2017
2018
2019
2020
2005
2006
2007
2008
2009
2010
2011
2012
2013
2014
2015
2016
2017
2018
2019
2020
Winter Severity Index
DAU 8
300
250
200
WSI
150
100
50
0
29Appendix K. DAU 9 – Upper James River Study Area
Herd Composition
Harvest
Male Female WHITE-TAILED DEER HARVEST
Male Female MULE DEER HARVEST
150 12000
10000
100 8000
6000
50 4000
2000
0 0
2005
2006
2007
2008
2009
2010
2011
2012
2013
2014
2015
2016
2017
2018
2019
2020
2005
2006
2007
2008
2009
2010
2011
2012
2013
2014
2015
2016
2017
2018
2019
2020
Winter Severity Index
DAU 9
400
350
300
250
WSI
200
150
100
50
0
30Appendix L. DAU 10 – Prairie Coteau Study Area
Herd Composition
Harvest
Male Female WHITE-TAILED DEER HARVEST
15000
10000
5000
0
2005 2006 2007 2008 2009 2010 2011 2012 2013 2014 2015 2016 2017 2018 2019 2020
Winter Severity Index
DAU 10
500
450
400
350
300
WSI
250
200
150
100
50
0
31Appendix M. DAU 11 – Big Sioux River Study Area
Herd Composition
Harvest
Male Female WHITE-TAILED DEER HARVEST
15000
10000
5000
0
2005 2006 2007 2008 2009 2010 2011 2012 2013 2014 2015 2016 2017 2018 2019 2020
Winter Severity Index
DAU 11
350
300
250
200
WSI
150
100
50
0
32You can also read