Spatial variance mass allometry of population density in felids from camera trapping studies worldwide - Nature
←
→
Page content transcription
If your browser does not render page correctly, please read the page content below
www.nature.com/scientificreports
OPEN Spatial variance‑mass allometry
of population density in felids
from camera‑trapping studies
worldwide
Stefano Anile1 & Sébastien Devillard2*
Power laws are cornerstone relationships in ecology and evolutionary biology. The density-mass
allometry (DMA), which predicts an allometric scaling of population abundance, and Taylor’s law (TL),
which predicts a decrease in the population abundance variation along with a decrease in population
density, have enhanced our knowledge of inter- and intra-specific variation in population abundance.
When combined, these two power laws led to the variance-mass allometry (VMA), which states that
larger species have lower spatial variation in population density than smaller species. The VMA has
been predicted through theoretical models, however few studies have investigated if this law is also
supported by empirical data. Here, to formally test the VMA, we have used the population density
estimates obtained through worldwide camera trapping studies for an emblematic and ecologically
important carnivorous taxa, the Felidae family. Our results showed that the VMA law hold in felids, as
well as the TL and the DMA laws; bigger cat species showed less variation for the population density
than smaller species. These results have important implications for the conservation of wildlife
population and confirm the validity of important ecological concepts, like the allometric scaling of
population growth rate and the slow-fast continuum of life history strategies.
Investigating whether ecological laws (sensu biological rules) are supported by empirical data at the macro-
ecological scale is a cornerstone in ecology and evolutionary biology1. Among ecological laws, power laws have
received lots of attention recently, both at the theoretical and empirical l evels1,2. In general, power law relation-
ships relate a trait, at the individual, population or community level, to another one with a power function
Y = βXα, therefore leading to a linear relationship at the log-scale1; these slopes (i.e. coefficients) are then used
to inform on the macro-ecological processes acting on these levels. Power laws have greatly contributed to our
understanding of the large-scale variations of population abundance3–5 or of variation of metabolism across the
body mass continuum in animals and p lants6–8. In this context, one of the first power law ascertained in ecology
is the Taylor’s law (hereafter, TL), which positively links the variance in population density to the mean density
of populations3,9 with the following equation:
VarDi = a · (MeanDi )b , with a > 0, and, 1 ≤ b ≤ 2 in numerous empirical
(1)
examples where Di is the population density in study site i.
Since the seminal paper of T aylor3, this relationship has upheld across numerous t axa1,9–13, and has been the
subject of several theoretical works14–16 aiming to unravel the biological meaning of its exponent (i.e. the slope
or coefficient).
Furthermore, another ecological law, the Density-Mass Allometry (hereafter DMA4,17–20), relates mean popu-
lation density to body mass, where density decreases with increasing body mass according to the theory of
energetic requirements of species (Eq. 2 below):
1
Cooperative Wildlife Research Laboratory, Southern Illinois University, Carbondale, IL 62901, USA. 2Laboratoire
de Biométrie Et Biologie Evolutive, Univ Lyon, Université Claude Bernard Lyon 1, CNRS, 69100 Villeurbanne,
France. *email: sebastien.devillard@univ‑lyon1.fr
Scientific Reports | (2020) 10:14814 | https://doi.org/10.1038/s41598-020-71725-0 1
Vol.:(0123456789)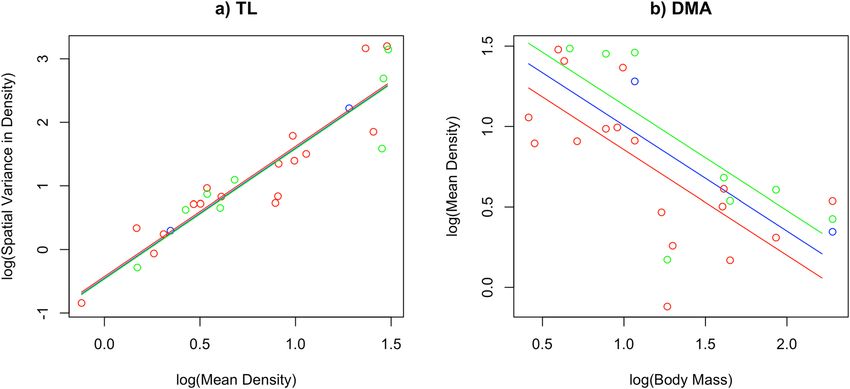
www.nature.com/scientificreports/
MeanDi = c · (MeanBM )d , c > 0, and, d < 0, where BM is the species body mass (2)
Similarly to the TL, also the DMA has been thoroughly researched and results have supported its
predictions4,17,21–33.
More recently a third ecological law, named the Variance-Mass Allometry (hereafter VMA) combines the
two above mentioned laws into one equation (Eq. 3), which links the variance of population density over study
sites to the body mass of the species1,34,
VarDi = ac b .(MeanBM )bd (3)
that leads a linear relationship at the log10 scale
log(VarDi ) = b0 + b1 · log(MeanBM ), with b1 being negative. (4)
Given that both TL and DMA hold in some taxa, it is indeed reasonable to expect that the variance of popula-
tion density is negatively related to the species body mass (i.e. the bigger the species, the less variation in mean
population density). The VMA scaling exponent has been theoretically predicted by combining the TL scaling
exponent (∼ 2) and the DMA exponent (∼ − 0.75), giving an exponent for the VMA of ∼ − 3/21,34.
Finding a more general expression for the VMA, without the mandatory step of testing the TL and DMA laws,
would help understand the ecological processes which affect variability in population density. A recent study has
indeed demonstrated that the VMA should hold even without needing to first test whether the TL and DMA
separately hold35. Indeed, the model developed by Segura and Perera35 assumes that metabolic requirements
constrain the maximum abundance of a dominant species in a local c ommunity36–40 and hence this model sug-
gested the existence of a general form of variance-mass allometry which, under some particular circumstances,
includes the VMA previously developed by M arquet1 and Cohen et al.34. Specifically, Segura and P
erera35 argued
that the explicit link between mean population density and the metabolic scaling can vary due to periodic changes
in resources or temperatures and that is why free-living, free-living infested, and parasitic species exhibit dif-
ferent VMA r elationships41.
Since its first formalization by Cohen et al.34, the VMA has been ascertained only through empirical data
sets34,41,42, but to the best of our knowledge, an empirical test in terrestrial animals is lacking. For example, Cohen
et al.34 found a strong support for the VMA prediction within genera of oak (Quercus sp.) trees; moreover, these
authors suggested that the VMA should be evaluated at higher taxonomic levels because both the TL and DMA
equations can also be applied among distantly related species43,44. Similarly, the results of Xu42 support the
existence of VMA in oak trees, while also suggesting that the VMA should be true also for fishes. Lagrue et al.41
further provided cross-species evidence that the VMA law occurs in a wide range of metazoan parasites, host
species, and free-living species without parasites.
Given the aforementioned evidence, it can thus be predicted that population densities of smaller species
should be more variable spatially, and likely temporally, than densities of larger-bodied species.
To test the VMA on terrestrial animals, repeated robust estimates of population density across study sites for
a representative set of species within a taxon are needed. Clearly, density estimates must be robust, standardized
and independent from each other. Camera trap monitoring45 has been used extensively to estimate population
density or other population parameters of many species of Felidae46,47. Many cat species are naturally individu-
ally marked as their fur-coats feature stripes, rosettes and spots. Hence, with the advent of camera-trapping as
a “standard” sampling method, researchers can obtain species-specific density estimates for a variety of felids,
making felids an ideal taxon for empirically testing the VMA ecological law.
Terrestrial carnivores are key species which exerted crucial effects not only on the abundance, richness and
diversity of the community of species present in a given area, but they are also essential for shaping, regulating
and maintaining entire e cosystems48–50. Among terrestrial carnivores, the Felidae family is a taxa which has
capitalized the researcher’s attention since numerous decades, not only because of their charismatic n ature51 and
high conservation value as umbrella s pecies , but also because the largest species (e.g. tiger Panthera tigris, lion
52
Panthera lion, and leopard Panthera pardus) can be, in certain circumstances, man-eaters53. Moreover, all the
members of the Felidae family are obliged carnivores54, hence making them particularly prone to the predation of
livestock53, which in turn can cause severe human-conflicts with retaliatory consequences53. Despite this strong
research interest in felids54, it is still difficult to study them in the wild given their low population densities55,
their elusive and nocturnal b ehaviors56 as well as the logistic constraints due to the nature of their habitats (e.g.
tropical forests, Savannah steppe, high altitude mountains, deserts and Siberian taiga).
Important evolutionary and conservation questions remains to address for this taxa. For example, it is largely
unknown how population density in cat species varies spatially or temporally and which factors can trigger these
variations. Carnivore density or distribution is generally positively related to prey abundance57–59, however such
studies have included only one large cat species (i.e. tigers, leopards, and Panthera onca jaguars), hence inferences
at the family level cannot be generalized. Moreover, testing broader ecological laws regarding population density
across Felidae might assist biologists seeking to conserve this important taxa.
Our primary goal was to investigate whether the VMA law is supported in wild populations of felids using
density estimates collected through camera trap surveys worldwide. Following Cohen et al.34, before testing
the VMA in felids, we first ascertained whether the TL and the DMA laws were supported,. Given the expected
universal aspect of TL, DMA and VMA, we predicted both ecological laws would be supported in felids.
Scientific Reports | (2020) 10:14814 | https://doi.org/10.1038/s41598-020-71725-0 2
Vol:.(1234567890)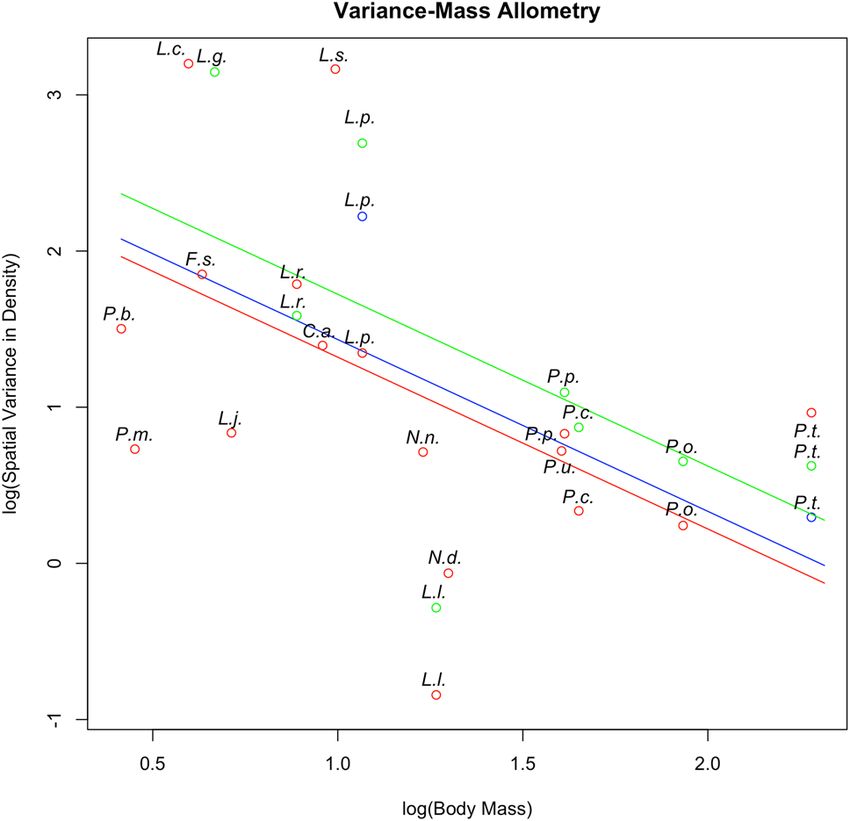
www.nature.com/scientificreports/
Figure 1. Worldmap of the locations of the n = 679 records of population density coming from camera trap
studies in 22 Felid species. Only records using CR FMMDM, CR HMMDM and SECR methods of density
estimation are shown. The map was generated using Qgis version 1.7 https://qgis.org/en/site/about/index.html.
Results
Data availability. The literature search achieved an initial dataset of 679 estimates of population density
in felids coming from 260 camera trap studies from 54 countries (Fig. 1, Supplementary Information Table S1).
Among the 40 recognized felids species60), we obtained density estimates from 22 (mean number of records per
species = 30.86 ± 45.66 (s.e.m); range [1, 159]). Tiger (n = 159), leopard (n = 133) and jaguar (n = 101) represented
the most-represented species, while lion and margay (Leopardus wiedii) had only two records each. Twenty-six,
161, and 492 density estimates were from CR FMMDM, CR HMMDM, and SECR methods.
To prepare the final dataset, we first discarded 90 density estimates that were a result of non-targeted, i.e. ran-
dom, surveys. We then identified the density records which were outside the distribution of density estimates for
each pair species/method of density estimation (i.e. density estimates that might be biased due to methodologi-
cal weaknesses) using a boxplot (Supplementary Information Fig. S1) and 38 additional records were discarded
from the dataset. All outliers were unexpectedly high density estimates (Supplementary Information Fig. S1).
The reduced dataset included thus n = 551 records for the 22 Felid species (mean = 25.05 ± 39.54 range [1,
142]). From this dataset, we calculated MeanDensity and VarDensity over specific study sites for each pair (spe-
cies/method of density estimation). We obtained 27 measures of MeanDensity and VarDensity calculated over at
least three different study sites and for the three methods of density estimation (2 CR FMMDM, 8 CR HMMDM,
and 17 SECR) for 18 species. Two species had estimates for three methods of density estimation (Supplementary
Information Table S2), 5 for two, and eleven for one. The mean number of specific study site per species/method
of density estimation pair was 12.63 ± 14.16 (s.e.m) and ranged from 3 to 57. This final dataset was then used
for the following data analysis.
Investigating TL, DMA and VMA in felids. The slopes of the TL was not impacted by the method
of density estimation as the interaction term DensityMethod*log.MeanDensity was not retained in the model
(p = 0.9720). Therefore we computed the additive model which showed an effect of log.MeanDensity on log.Var-
Density (p = 6.10 10–5, conditional R 2 = 0.87) and found no effect of the method of density estimation (p = 0.6265).
We thus estimated the slope of the TL using the b estimates of the additive model: the slope was positive and
equal to βlog.MeanDensity = 2.0470 ± 0.1858 (s.e.m) (p = 6.10 × 10⁻⁵). Therefore the more the mean density over dif-
Scientific Reports | (2020) 10:14814 | https://doi.org/10.1038/s41598-020-71725-0 3
Vol.:(0123456789)www.nature.com/scientificreports/
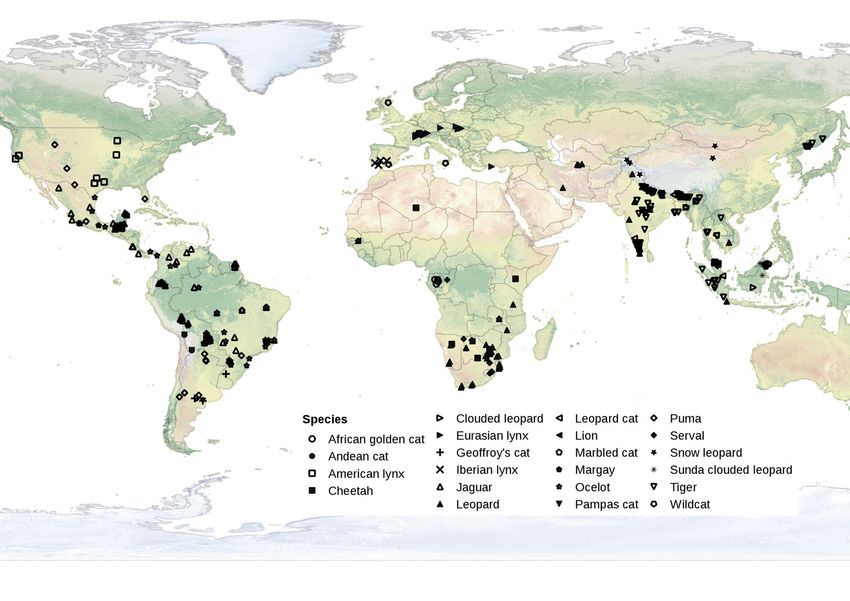
Figure 2. Taylor’s law (a) (TL) and Density-Mass Allometry (b) (DMA) in 18 species of felids. Predicted
value were computed on fixed effects only and from the additive models. Blue points and lines are for the CR
FMMDM method of density estimation, green points and lines are for the CR HMMDM method of density
estimation, and red points and lines are for the SECR method of density estimation.
ferent study sites is, the more the spatial variance in density increases, hence we found strong support to the TL
in Felidae (Fig. 2a).
The DMA predicted the mean density of species was negatively related to their body mass at the log-scale.
Again the slope of the DMA was not significantly different for the three methods of density estimation (interac-
tion term DensityMethod*log.BodyMass p = 0.053). We thus fitted the additive model, and, in this model, the
method of density estimation was not significant (p = 0.1266) while the effect of the log.BodyMass was highly
significant (p = 0.0005, conditional R 2 = 0.90). DMA was thus strongly supported in Felids (p = 0.0005) and the
slope of the DMA was to βog.BodyMass = − 0.6561 ± 0.1531 (s.e.m) (p = 0.0005, Fig. 2b) so the mean density was
negatively correlated with their body mass.
The interaction between DensityMethod and log.BodyMass was not significant (p = 0.3571), highlighting that
the VMA slope is equal which ever the method of density estimation used. No significant effect of the method
of density estimation was shown (p = 0.3344) while log.BodyMass had a significant effect on log.VarDensity
(p = 0.0207, conditional R2 = 0.88) in this additive model. As expected, the VMA slope was negative and equal to
βlog.BodyMass = − 1.099 ± 0.4264 (s.e.m) (p = 0.0207, Fig. 3). We found thus that the spatial variance in density for
felid species is negatively related to their body mass.
Discussion
Based on an exhaustive review of population density estimates over multiple study sites from camera-trap studies
on felids worldwide, we demonstrated that the spatial VMA was supported for Felidae, and hence variation in
population density decreases with increasing body mass. We thus provide the first evidence that the spatial vari-
ance of population density is a power-law function of average body mass at the interspecific level for terrestrial
animals. The VMA was already found for another population parameter across mammalian species as Sinclair61
reported an inverse allometric relationship between the standard deviation of the maximum population growth
rate and body mass. This and our findings underlined that the general variance-mass allometry recently predicted
by the model of Segura and P erera35 might hold also for numerous population demographic traits (e.g. survival
and reproduction rate, population density, population growth rate) in terrestrial animals. Population density
databases for other terrestrial animal taxa are now available62, allowing further tests on the spatial density VMA;
a more thoroughly understanding of the processes and implications of such universal law would be beneficial,
especially when considering the current species extinction crisis63,64.
The VMA slope estimated on felids (βlog.BodyMass = − 1.099) is slightly lower than both the theoretical value of ∼
− 3/21,34 and the expected value of 2.0470 × (− 0.6561) = − 1.343 (Eq. 3) given the estimated slopes of the TL and
the DMA. βlog.BodyMass also fell in the lower bound of previous estimated slopes [− 0.29–3.28]34,41,42. Differences
in lifestyle, metabolic ecology35 and resource use among trees34, parasites41, fishes42 and terrestrial carnivores
(this study) are likely to explain these discrepancies but it points to a deeper assessment when more VMA slopes
are published. Several non-mutual scenarios can explain the difference between the theoretical (− 3/2) and the
expected (− 1.343) slope and, alternately, the actual slope of the VMA we found (− 1.099). Different arguments
could indeed be formulated to explain this flattening of the VMA encompassing both a lower than expected
variability in small species and larger variability than expected in large species. In a more optimistic scenario, our
dataset may not be representative enough of the actual variability found in population densities of small cats; a
scenario which we consider realistic given the strong bias in research efforts towards large c ats46,47. In the worst
case scenario, we cannot exclude that population densities of small cat populations are truly depressed, hence
they are not able to attain their highest predicted population densities, thereby lowering the density variation
Scientific Reports | (2020) 10:14814 | https://doi.org/10.1038/s41598-020-71725-0 4
Vol:.(1234567890)www.nature.com/scientificreports/
Figure 3. Variance-Mass Allometry (VMA) in 18 species of felids. Predicted values were computed on fixed
effects only and from the additive models. Blue points and lines are for the CR FMMDM method of density
estimation, green points and lines are for the CR HMMDM method of density estimation, and red points and
lines are for the SECR method of density estimation. Species are shown on the plot using their Genus-Specie
initials: C.a. Caracal aurata, F.s. Felis silvestris, L.c. Leopardus colocolo, L.g. Leopardus geoffroyi, L.j. Leopardus
jacobita, L.p. Leopardus pardalis, L.s. Leptailurus serval, L.l. Lynx lynx, L.r. Lynx rufus, N.d. Neofelis diardi, N.n.
Neofelis nebulosa, P.o. Panthera onca, P.p. Panthera pardus, P.t. Panthera tigris, P.u. Panthera uncia, P.m. Pardofelis
marmorata, P.b. Prionailurus bengalensis, P.c. Puma concolor.
in small species and ultimately flattening the VMA. For large cat species, the density variation might be higher
than expected, thus flattening the VMA. Particularly high or low values for large cat population densities may
be either highly biased, as the outliers we discarded from our dataset. High density values can also be genuine
strongholds for the conservation of a particular species highlighting efficiency in conservation measures locally
while low value might underpin highly endangered populations calling for rapid protection measure locally.
Beyond reporting further evidence of well-known power laws in ecological systems (TL and DMA), our
finding on the existence of spatial VMA across felid species has strong implications for the management and
conservation of these charismatic species. Many conservation programs aim at increasing population abundance
above a minimum viable population density65. However, given that larger cat species had less spatially variable
population density, it is likely that larger cats are also less prone to respond to conservation actions specifically
tailored to increase population density than smaller cats. Therefore, biologists should take into account our
results when planning conservation actions involving quantitative objectives on population density. For example,
increasing population density by 10% might be far more difficult for a large species than a small one.
How this general pattern relates to the life history of each cat species and its relative conservation status
would be a key research topic for future studies. Nonetheless, one might argue that the existence of the VMA
law laid in the well-known concept of the slow-fast continuum66, which states that larger and slower species
displayed higher adult survival, lower annual fecundity and population turnover, so that spatial and temporal
variation in abundance is reduced. However, when considering the wide range of body sizes and life histories
observed in carnivores, this presumed fast-slow continuum is not well s upported67. Moreover, also the well-
known allometry of the intrinsic rate of increase rmax which scales to body mass with an allometric exponent
close to -1/468,69 can also be related to the VMA pattern we observed. As rmax is ultimately controlled by levels of
birth, growth and mortality, the allometric scaling of rmax underlines that large species have, among other traits,
a slower population’s capability of recovering after population collapses due to numerous types of disturbances.
Hence large species are less able to reach high population density, limiting as much their variance in population
density (see also Gamelon et al.70 for the role of generation time on the population stability of large mammals).
The range of the observable values of population density may be further reduced for the larger species due to
allometric scaling (sensu constraints) of numerous life history traits, including transient dynamics p arameters70.
On the contrary, the lower spatial variation in population densities of the larger species relative to smaller species
might also partly result from their overall poor conservation status, so that high population densities of highly
threatened species are not observable. However, as already stated (see above), the spatial variation of population
density in large species is higher than expected suggesting rather that our data arose from a mix of particularly
high (biased or healthy populations) and low (endangered populations) population densities. Finally, further
exploration on the role of other ecological variables potentially impacting rangewide population density (e.g.,
human footprint index, road density, and net primary productivity), as well as other life traits (i.e., fecundity
Scientific Reports | (2020) 10:14814 | https://doi.org/10.1038/s41598-020-71725-0 5
Vol.:(0123456789)www.nature.com/scientificreports/
or dispersal), might identify critical factors impacting felid populations.. For example, the model developed by
Segura and Perera35 is based on the constraint acting on population abundance through metabolic requirements
of species, hence clarifying the role of the local resource a vailability33 on the VMA relationship (i.e. in our case,
how the abundance of prey interacts with the VMA relationship).
Such a support for the VMA was obtained by using spatial replicates not conducted at the same spatial scale,
for example among our records we observed a gradient of spatial scales, from different parts of a wildlife reserve
to national park, through different areas of a country up to by study sites shared among different countries (Sup-
plementary Information Table S1). Despite this, the VMA relationship was supported, albeit we acknowledge that
such differences in the spatial scales might also influence the variation observed around the VMA relationship.
Moreover, the species with the highest number of spatial replicates were mainly large species (e.g. tiger with
57 spatial replicates), so that the large spatial variation we found in small species cannot be accounted for by a
higher number of spatial replicates. The method of density estimation used to record density (CR or SECR esti-
mates) did not alter the slopes of the relationships (i.e. the allometric exponent) as additive models were always
the best supported, but rather suggested over- or under-estimation of populations density depending on the
methods used (Fig. 2b). During the last years of the study period, most studies used SECR methods to estimate
population density and such an approach is becoming the gold standard for estimating the population density
in felids. Unfortunately, our data did not allow us to investigate the temporal VMA due to a small number of
temporal replicates on a low number of species. However, as the number of camera-trapping studies has increased
considerably71, it is likely the data required for assessing temporal VMA should be soon available. When temporal
replicates were available for a specific study site, we averaged population density over time-period to obtain a
single estimate per species of the population density; we acknowledge this approach may have introduced bias
as the averaged estimate could not be representative of the true population density for these sites. However, the
temporal variance calculated within a single study site was far less important than the spatial variance between
sites for these species (results not shown), hence likely minimizing this bias. Finally we used averaged body mass
mostly from the study of Johnson et al.72 and from the PanTHERIA database; a better approach would have been
to obtain the body mass of each species directly from each specific study site. Unfortunately, this information
was not available for most study sites. This potential discrepancy between averaged and actual, site-specific body
sizes, may have contributed to the variation observed around the VMA.
Our efforts for maintaining the dataset, analyzing it and disseminating our findings46,47 have contributed to
increase the scientific knowledge for this highly distinctive and charismatic taxon. Moreover, in this study we
have found strong support for the VMA law for a whole taxon of carnivore species for the first time and evidently
this result calls for other assessments of the VMA at the interspecific level in other taxonomic groups, both on
the spatial and temporal variance in population density, before confirming its universality on ecological systems
and discussing its implications more in depth.
Methods
Data collection. We searched the literature for camera survey-based estimates of population density for
felids during 11 January 2012 until 14 December 2019 using the most common, freely accessible and widely
used scientific bibliography database: Scirus, Web of Science, BioOne and Google s cholar46,47. We used the term
“camera-trapping” along with both common and scientific names for the 40 species of felids60. Each entry was
then fully examined and the following data were extracted: species, author (only the first name was recorded),
journal name (for technical reports or thesis entries, we used the terms report or thesis as substitute for the jour-
nal name), year of publication, study site and specific-study site (for those entries where a specific area within
the study site was sampled, see Anile and D evillard47 for details), study year(s), sampling dates, the method of
density estimation (i.e. either SECR—spatially explicitly capture recapture- or CR—capture recapture-analysis),
the type of buffer used (only for CR entries according to the following levels: FMMDM—full mean maximum
distance moved; HMMDM—half mean maximum distance moved), and the density D (N/A individuals/100
km2). We retained only these three methods of density estimation as they are recognized to provide the most
accurate estimates of the population density of naturally marked individuals from camera trap studies. Until
the pioneer study of Efford et al.73, researchers have indeed used non-spatial CR models for estimating D; this
framework involved the disjointed estimation of N using closed population models and A, the so called “effec-
tive” trapping area (i.e. usually a minimum convex polygon delineated around the camera traps plus a buffer).
However, this framework underestimates the true movements of animals within and around the trapping grid,
hence biasing high the density e stimate59,74. On the contrary, the development of SECR models overrides the
need of estimating the area A because these models inherently estimate D by modelling the location of the
home-ranges of the animals (detected and not detected) based on the spatial information provided by the cap-
tures themselves45,75. We further classified each entry as random vs. target records46,47 by carefully inspecting the
methods section to assess if a species-specific sampling was used for a given species. For entries reporting data
for more than one species, year and period (e.g. repeated sampling over the years or repeated sampling in the
same year), we considered them independently. Thus, we used only independent records. This strict classifica-
tion system for each entry was necessary as we found some cases where only the method of density estimation
differed or, alternatively, the period of sampling between entries overlapped. In the latter case we only retained
the most recent record (i.e. the one with the latest year of publication as in the majority of the cases the SECR
method of density estimation was used). For each species we then associated the body mass (mean; gr) using the
data provided in Johnson et al.72 or alternatively, for those cat species not reported in the above mentioned study,
in the PanTHERIA d atabase76. The body mass of the Andean cat Leopardus jacobita was taken from Huaranca
et al.77 given it was not reported in the two afore mentioned sources. As Felidae are dimorphic species72, we aver-
aged male and female body mass.
Scientific Reports | (2020) 10:14814 | https://doi.org/10.1038/s41598-020-71725-0 6
Vol:.(1234567890)www.nature.com/scientificreports/
Data preparation. From the initial dataset of felid population density estimated trough CR FMMDM, CR
HMMDM or SECR method of density estimation, we further reduced the dataset by discarding records from
studies where the species was not the targeted one (i.e. random records sensu Anile and Devillard46) as relative
abundance index (RAI), and hence density estimate, is biased in such studies46. A boxplot was used to remove
outlier density estimates for each species/method of density estimation pair from the dataset. Particularly high
or low density might reveal a bias in the study design and/or peculiar habitat conditions. From this dataset we
calculated the mean density MeanDensity over specific study sites. When several density estimates were available
for a given specific study site (i.e. temporal repeats of the monitoring over years or seasons), we averaged the
density estimates over temporal windows. The method of density estimation was accounted for and only specific
study sites providing density estimated by the same method were averaged. Therefore a species could have sev-
eral (up to three) mean densities, one for each method of density estimation. The variance of density VarDensity
was calculated as the variance of density estimates over specific study sites. Again only the density estimates
coming from the same method of density estimation were used to provide a value of VarDensity leading poten-
tially to up to three values for VarDensity for a single species. For the following data analysis, we only kept in the
dataset MeanDensity and VarDensity that were estimated for at least three different specific study sites.
Data analysis. We used linear mixed model with a Gaussian distribution with Restricted Maximum Likeli-
hood (REML, lmer function in the lme4 package for the R software) to assess whether the Taylor’s law (TL), the
Density-Mass Allometry (DMA) and the Variance-Mass Allometry (VMA) are supported by the density esti-
mates reported in felids from camera-trap studies. Significance threshold was set to nominal value of α = 0.05.
The continuous response variable was either VarDensity (TL, VMA) or MeanDensity (DMA), while the explana-
tory variable was the body mass BodyMass for the DMA and VMA tests and the MeanDensity in the TL test. For
each model (TL, DMA and VMA) we also added as a fixed effect the method of density estimation (DensityM-
ethod with three modalities CR FMMDM, CR HMMDM, SECR) in interaction with the continuous explanatory
variable. We added DensityMethod as a potential confounding factor as previous studies have shown that the
method used to estimate density from camera trap studies might affect density estimates46,59,74,78. Finally, we
included in the models the random factor Species because, as stated above, some species can have up to three
repeated measures for the pair metric (MeanDensity, VarDensity) in the dataset coming from the different meth-
ods of density estimation.
To ensure that the slope of the TL, DMA and VMA was not biased by the method used to estimate density,
we first tested for the interaction between DensityMethod and the response variables. If this interaction term was
not significant (i.e. the method of density estimation is not affecting the slope), we then computed the additive
model to investigate TL, DMA and VMA slope significance, but we kept the method of density estimation in
this additive model as a confounding factor. MeanDensity, VarDensity and BodyMass were log10-transformed
in all models. Model residuals were examined for homoscedasticity and normal distribution to assess whether
they satisfactorily respected the model hypotheses (Supplementary Information Figs. S2–S4).
Data availability
The datasets generated during and/or analysed during the current study are available from the corresponding
author on reasonable request.
Received: 21 June 2020; Accepted: 28 July 2020
References
1. Marquet, P. A. Scaling and power-laws in ecological systems. J. Exp. Biol. 208, 1749–1769 (2005).
2. GarciaMartin, H. & Goldenfeld, N. On the origin and robustness of power-law species-area relationships in ecology. Proc. Natl.
Acad. Sci. 103, 10310–10315 (2006).
3. Taylor, L. R. Aggregation, variance and the mean. Nature 189, 732–735 (1961).
4. Damuth, J. Population density and body size in mammals. Nature 290, 699–700 (1981).
5. Carbone, C. & Gittleman, J. L. A common rule for the scaling of carnivore density. Science 295, 2273–2276 (2002).
6. White, C. R. & Seymour, R. S. Allometric scaling of mammalian metabolism. J. Exp. Biol. 208, 1611–1619 (2005).
7. da Silva, J. K. L., Garcia, G. J. M. & Barbosa, L. A. Allometric scaling laws of metabolism. Phys. Life Rev. 3, 229–261 (2006).
8. Reich, P. B., Tjoelker, M. G., Machado, J.-L. & Oleksyn, J. Universal scaling of respiratory metabolism, size and nitrogen in plants.
Nature 439, 457–461 (2006).
9. Eisler, Z., Bartos, I. & Kertész, J. Fluctuation scaling in complex systems: Taylor’s law and beyond. Adv. Phys. 57, 89–142 (2008).
10. Reed, D. H. & Hobbs, G. R. The relationship between population size and temporal variability in population size. Anim. Conserv.
7, 1–8 (2004).
11. Benton, T. G. & Beckerman, A. P. Population dynamics in a noisy world: lessons from a mite experimental system. in Advances in
Ecological Research vol. 37, pp. 143–181 (Academic Press, Cambridge, 2005).
12. Ramsayer, J., Fellous, S., Cohen, J. E. & Hochberg, M. E. Taylor’s law holds in experimental bacterial populations but competition
does not influence the slope. Biol. Lett. 8, 316–319 (2012).
13. Kaltz, O., Escobar-Páramo, P., Hochberg, M. E. & Cohen, J. E. Bacterial microcosms obey Taylor’s law: effects of abiotic and biotic
stress and genetics on mean and variance of population density. Ecol. Process. 1, 5 (2012).
14. Anderson, R. M., Gordon, D. M., Crawley, M. J. & Hassell, M. P. Variability in the abundance of animal and plant species. Nature
296, 245–248 (1982).
15. Ballantyne, F. I. The upper limit for the exponent of Taylor’s power law is a consequence of deterministic population growth. Evol.
Ecol. Res. 8 (2005).
16. Engen, S., Lande, R. & Sæther, B.-E. A general model for analyzing taylor’s spatial scaling laws. Ecology 89, 2612–2622 (2008).
17. Damuth, J. Interspecific allometry of population density in mammals and other animals: the independence of body mass and
population energy-use. Biol. J. Linn. Soc. 31, 193–246 (1987).
Scientific Reports | (2020) 10:14814 | https://doi.org/10.1038/s41598-020-71725-0 7
Vol.:(0123456789)www.nature.com/scientificreports/
18. Blackburn, T. M. & Gaston, K. J. The relationship between animal abundance and body size: a review of the mechanisms. In
Advances in Ecological Research (eds Fitter, A. H. & Raffaelli, D.) 181–210 (Academic Press, Cambridge, 1999).
19. Jennings, S., Oliveira, J. A. A. D. & Warr, K. J. Measurement of body size and abundance in tests of macroecological and food web
theory. J. Anim. Ecol. 76, 72–82 (2007).
20. Belgrano, A. & Reiss, J. The Role of Body Size in Multispecies Systems (Academic Press, Cambridge, 2011).
21. Lawton, J. H. What is the relationship between population density and body size in animals?. Oikos 55, 429–434 (1989).
22. Marquet, P. A., Navarrete, S. A. & Castilla, J. C. Scaling oopulation density to body size in rocky intertidal communities. Science
250, 1125–1127 (1990).
23. Silva, M. & Downing, J. A. The allometric scaling of density and body mass: a nonlinear relationship for terrestrial mammals. Am.
Nat. 145(5), 704–727 (1995).
24. Dunham, J. B. & Vinyard, G. L. Relationships between body mass, population density, and the self-thinning rule in stream-living
salmonids. Can. J. Fish. Aquat. Sci. 54, 6 (1997).
25. Enquist, B. J., Brown, J. H. & West, G. B. Allometric scaling of plant energetics and population density. Nature 395, 4 (1998).
26. Hendriks, A. J. Allometric scaling of rate, age and density parameters in ecological models. Oikos 86, 293–310 (1999).
27. Schmid, P. E. Relation between population density and body size in stream communities. Science 289, 1557–1560 (2000).
28. Morand, S. & Poulin, R. Body size–density relationships and species diversity in parasitic nematodes: patterns and likely processes.
Evol. Ecol. Res. 12 (2002).
29. Niklas, K. J., Midgley, J. J. & Enquist, B. J. A general model for mass–growth–density relations across tree-dominated communities.
Evol. Ecol. Res. 5, 459–468 (2003).
30. Makarieva, A. M., Victor, G. & Li, B.-L. Why do population density and inverse home range scale differently with body size?. Ecol.
Complex. 2, 259–271 (2005).
31. Reuman, D. C., Mulder, C., Raffaelli, D. & Cohen, J. E. Three allometric relations of population density to body mass: theoretical
integration and empirical tests in 149 food webs. Ecol. Lett. 11, 1216–1228 (2008).
32. Reuman, D. C. et al. Allometry of body size and abundance in 166 food webs. in Advances in Ecological Research vol. 41, pp. 1–44
(Elsevier, 2009).
33. Carbone, C., Pettorelli, N. & Stephens, P. A. The bigger they come, the harder they fall: body size and prey abundance influence
predator–prey ratios. Biol. Lett. 7, 312–315 (2011).
34. Cohen, J. E., Xu, M. & Schuster, W. S. F. Allometric scaling of population variance with mean body size is predicted from Taylor’s
law and density-mass allometry. Proc. Natl. Acad. Sci. 109, 15829–15834 (2012).
35. Segura, A. M. & Perera, G. The metabolic basis of fat tail distributions in populations and community fluctuations. Front. Ecol.
Evol. 7, 148 (2019).
36. Agusti, S., Duarte, C. M. & Kalff, J. Algal cell size and the maximum density and biomass of phytoplankton1. Limnol. Oceanogr.
32, 983–986 (1987).
37. Belgrano, A., Allen, A. P., Enquist, B. J. & Gillooly, J. F. Allometric scaling of maximum population density: a common rule for
marine phytoplankton and terrestrial plants. Ecol. Lett. 5, 611–613 (2002).
38. Brown, J. H., Gillooly, J. F., Allen, A. P., Savage, V. M. & West, G. B. Toward a metabolic theory of ecology. Ecology 85, 1771–1789
(2004).
39. Barneche, D. R., Kulbicki, M., Floeter, S. R., Friedlander, A. M. & Allen, A. P. Energetic and ecological constraints on population
density of reef fishes. Proc. R. Soc. B 283, 20152186 (2016).
40. Ghedini, G., White, C. R. & Marshall, D. J. Metabolic scaling across succession: do individual rates predict community-level energy
use?. Funct. Ecol. 32, 1447–1456 (2018).
41. Lagrue, C., Poulin, R. & Cohen, J. E. Parasitism alters three power laws of scaling in a metazoan community: Taylor’s law, density-
mass allometry, and variance-mass allometry. Proc. Natl. Acad. Sci. 112, 1791–1796 (2015).
42. Xu, M. Ecological scaling laws link individual body size variation to population abundance fluctuation. Oikos 125, 288–299 (2016).
43. Taylor, L. R. & Woiwod, I. P. Comparative synoptic dynamics. I. Relationships between inter- and intra-specific spatial and temporal
variance/mean population parameters. J. Anim. Ecol. 51, 879 (1982).
44. Cyr, H., Downing, J. A., Peters, R. H. & Cyr, H. Density-body size relationships in local aquatic communities. Oikos 79, 333 (1997).
45. O’Connell, A. F., Nichols, J. D. & Karant, U. K. Camera traps in animal ecology methods and analyses (Springer, London, 2010).
46. Anile, S. & Devillard, S. Study design and body mass influence RAIs from camera trap studies: evidence from the Felidae. Anim.
Conserv. 19, 35–45 (2015).
47. Anile, S. & Devillard, S. Camera-trapping provides insights into adult sex ratio variability in felids. Mamm. Rev. 48, 168–179 (2018).
48. Wilson, E. E. & Wolkovich, E. M. Scavenging: how carnivores and carrion structure communities. Trends Ecol. Evol. 26, 129–135
(2011).
49. Ripple, W. J. et al. Status and ecological effects of the world’s largest carnivores. Science 343, 1241484 (2014).
50. Van Valkenburgh, B., Hayward, M. W., Ripple, W. J., Meloro, C. & Roth, V. L. The impact of large terrestrial carnivores on Pleis-
tocene ecosystems. Proc. Natl. Acad. Sci. 113, 862–867 (2016).
51. Albert, C., Luque, G. M. & Courchamp, F. The twenty most charismatic species. PLoS ONE 13, e0199149 (2018).
52. Dickman, S. Felid conservation priorities. Conserv. Biol. (2015).
53. Inskip, C. & Zimmermann, A. Human-felid conflict: a review of patterns and priorities worldwide. Oryx 43, 18 (2009).
54. Macdonald, D. W. & Loveridge, A. J. The Biology and Conservation of Wild Felids (Oxford University Press, Oxford, 2010).
55. Hunter, L. Wild Cats of the World (Bloomsbury Publishing, London, 2015).
56. Rizzuto, M., Carbone, C. & Pawar, S. Foraging constraints reverse the scaling of activity time in carnivores. Nat. Ecol. Evol. 2,
247–253 (2018).
57. Karanth, K. U., Nichols, J. D., Samba Kumar, N., Link, W. A. & Hines, J. E. Tigers and their prey: predicting carnivore densities
from prey abundance. Proc. Natl. Acad. Sci. 101, 4854–4858 (2004).
58. Jiang, G. et al. New hope for the survival of the Amur leopard in China. Sci. Rep. 15, 15475 (2015).
59. Jedrzejewski, W. et al. Estimating large carnivore populations at global scale based on spatial predictions of density and distribu-
tion: application to the jaguar (Panthera onca). PLoS ONE 13, e0194719 (2018).
60. Kitchener, A. C. et al. A revised taxonomy of the Felidae. The final report of the Cat Classification Task Force of the IUCN/SSC
Cat Specialist Group. Cat News Special Issue, pp. 11–80 (2017).
61. Sinclair, A. R. E. Mammal populations: fluctuation, regulation, life history theory and their implications for conservation. Front.
Popul. Ecol. 1, 127–154 (1996).
62. Santini, L., Isaac, N. J. B. & Ficetola, G. F. TetraDENSITY: a database of population density estimates in terrestrial vertebrates.
Glob. Ecol. Biogeogr. 27, 787–791 (2018).
63. Ceballos, G., Ehrlich, P. R. & Dirzo, R. Biological annihilation via the ongoing sixth mass extinction signaled by vertebrate popula-
tion losses and declines. Proc. Natl. Acad. Sci. 114, E6089–E6096 (2017).
64. Ripple, W. J. et al. Extinction risk is most acute for the world’s largest and smallest vertebrates. Proc. Natl. Acad. Sci. 114, 10678–
10683 (2017).
65. Wikramanayake, E. et al. A landscape-based conservation strategy to double the wild tiger population: landscape-based strategy
for tiger recovery. Conserv. Lett. 4, 219–227 (2011).
Scientific Reports | (2020) 10:14814 | https://doi.org/10.1038/s41598-020-71725-0 8
Vol:.(1234567890)www.nature.com/scientificreports/
66. Stearns, S. C. The Influence of size and phylogeny on patterns of covariation among life-history traits in the mammals. Oikos 41,
173 (1983).
67. Paemelaere, E. & Dobson, F. S. Fast and slow life histories of carnivores. Can. J. Zool. 89, 692–704 (2011).
68. Peters, R. H. & Wassenberg, K. The effect of body size on animal abundance. Oecologia 60, 89–96 (1983).
69. Savage, V. M., Gillooly, J. F., Brown, J. H., West, G. B. & Charnov, E. L. Effects of Body size and temperature on population growth.
Am. Nat. 163, 429–441 (2004).
70. Gamelon, M. et al. Influence of life-history tactics on transient dynamics: a comparative analysis across mammalian populations.
Am. Nat. 184, 673–683 (2014).
71. McCallum, J. Changing use of camera traps in mammalian field research: habitats, taxa and study types: camera trap use and
development in field ecology. Mamm. Rev. 43, 196–206 (2013).
72. Johnson, P. J. et al. Rensching cats and dogs: feeding ecology and fecundity trends explain variation in the allometry of sexual size
dimorphism. R. Soc. Open Sci. 4, 170453 (2017).
73. Efford, M. Density estimation in live-trapping studies. Oikos 106, 598–610 (2004).
74. Luskin, M. S., Albert, W. R. & Tobler, M. W. Sumatran tiger survival threatened by deforestation despite increasing densities in
parks. Nat. Commun. 8, 1783 (2017).
75. Royle, J. A., Chandler, R. B., Sollmann, R. & Gardner, B. Spatial Capture-Recapture (Springer, New York, 2013).
76. Jones, K. E. et al. PanTHERIA: a species-level database of life history, ecology, and geography of extant and recently extinct mam-
mals: ecological Archives E090–184. Ecology 90, 2648 (2009).
77. Huaranca, J. C. et al. Density and activity patterns of Andean cat and pampas cat (Leopardus jacobita and L. colocolo) in the Boliv-
ian Altiplano. Wildl. Res. 47(1), 68–76 (2020).
78. Tobler, M. W. & Powell, G. V. N. Estimating jaguar densities with camera traps: problems with current designs and recommenda-
tions for future studies. Biol. Conserv. 159, 109–118 (2013).
Acknowledgements
Prof. Clay K. Nielsen kindly reviewed the English of this study and made valuable comments which improved
the manuscript. Jean-Michel Gaillard provided helpful comments on en earlier draft of the manuscript.
Author contributions
S.D. designed the study and analyzed the data. S.A. collected data, participated in the study design and interpreted
the data and results. S.D. and S.A. drafted the manuscript. All authors read and approved the final manuscript.
Competing interests
The authors declare no competing interests.
Additional information
Supplementary information is available for this paper at https://doi.org/10.1038/s41598-020-71725-0.
Correspondence and requests for materials should be addressed to S.D.
Reprints and permissions information is available at www.nature.com/reprints.
Publisher’s note Springer Nature remains neutral with regard to jurisdictional claims in published maps and
institutional affiliations.
Open Access This article is licensed under a Creative Commons Attribution 4.0 International
License, which permits use, sharing, adaptation, distribution and reproduction in any medium or
format, as long as you give appropriate credit to the original author(s) and the source, provide a link to the
Creative Commons licence, and indicate if changes were made. The images or other third party material in this
article are included in the article’s Creative Commons licence, unless indicated otherwise in a credit line to the
material. If material is not included in the article’s Creative Commons licence and your intended use is not
permitted by statutory regulation or exceeds the permitted use, you will need to obtain permission directly from
the copyright holder. To view a copy of this licence, visit http://creativecommons.org/licenses/by/4.0/.
© The Author(s) 2020
Scientific Reports | (2020) 10:14814 | https://doi.org/10.1038/s41598-020-71725-0 9
Vol.:(0123456789)You can also read