Stand Stability of Pure and Mixed-Eucalyptus Forests of Different Tree Species in a Typhoon-Prone Area - MDPI
←
→
Page content transcription
If your browser does not render page correctly, please read the page content below

Article
Stand Stability of Pure and Mixed-Eucalyptus Forests of
Different Tree Species in a Typhoon-Prone Area
Haiyan Deng, Linlin Shen, Jiaqi Yang and Xiaoyong Mo *

                                          College of Forestry and Landscape Architecture, South China Agricultural University, Guangzhou 510642, China;
                                          haiyan_deng@stu.scau.edu.cn (H.D.); 20203154049@stu.scau.edu.cn (L.S.); 20182032001@stu.scau.edu.cn (J.Y.)
                                          * Correspondence: xiaoyongmo@scau.edu.cn

                                          Abstract: Background and Objectives: The stable stand structure of mixed plantations is the basis of
                                          giving full play to forest ecological function and benefit. However, the monocultural Eucalyptus
                                          plantations with large-scale and successive planting that caused ecological problems such as reduced
                                          species diversity and loss of soil nutrients have presented to be unstable and vulnerable, especially in
                                          typhoon-prone areas. The objective of this study was to evaluate the nonspatial structure difference
                                          and the stand stability of pure and mixed-Eucalyptus forests, to find out the best mixed pattern
                                          of Eucalyptus forests with the most stability in typhoon-prone areas. Materials and Methods: In
                                          this study, we randomly investigated eight plots of 30 m × 30 m in pure and mixed-Eucalyptus
                                          (Eucalyptus urophylla S. T. Blake × E. grandis W. Hill) plantations of different tree species (Neolamarckia
                                          cadamba (Roxb.) Bosser, Acacia mangium Willd., and Pinus elliottii var. Elliottii Engelm. × P. caribaea
                                          Morelet) on growth status, characterized and compared the distribution of nonspatial structure of the
                                          monoculture and mixtures, and evaluated the stand quality and stability from eight indexes of the
                                          nonspatial structure, including preservation rate, stand density, height, diameter, stem form, degree
                                          of stem inclination, tree-species composition, and age structure. Results: Eucalyptus surviving in the
                                          mixed plantation of Eucalyptus and A. mangium (EA) and in the mixed plantation of Eucalyptus and
                                P. elliottii × P. caribaea (EP) were 5.0% and 7.6% greater than those in pure Eucalyptus plantation (EE),

                                          respectively, while only the stand preservation rate of EA was greater (+2.9%) than that of the pure
Citation: Deng, H.; Shen, L.; Yang, J.;
                                          Eucalyptus plantation. The proportions of all mixtures in the height class greater than 7 m were fewer
Mo, X. Stand Stability of Pure and
                                          than that of EE. The proportions of EA and mixed plantation of Eucalyptus and N. cadamba (EN) in the
Mixed-Eucalyptus Forests of Different
                                          diameter class greater than 7 m were 10.6% and 7.8%, respectively, more than that of EE. EN had the
Tree Species in a Typhoon-Prone Area.
Forests 2021, 12, 458. https://doi.org/
                                          highest ratio of branching visibly (41.0%), EA had the highest ratio of inclined stems (8.1%), and EP
10.3390/f12040458                         had the most straight and complete stem form (68.7%). The stand stability of the mixed plantation
                                          of Eucalyptus and A. mangium presented to be optimal, as its subordinate function value (0.76) and
Received: 3 March 2021                    state value (ω = 0.61) of real stand were the largest. Conclusions: A. mangium is a superior tree species
Accepted: 4 April 2021                    to mix with Eucalyptus for a more stable stand structure in the early growth stage to approach an
Published: 9 April 2021                   evident and immense stability and resistance, which is of great significance for the forest restoration
                                          of Eucalyptus in response to extreme climate and forest management.
Publisher’s Note: MDPI stays neutral
with regard to jurisdictional claims in   Keywords: mixed forest; preservation rate; stability; stem form; nonspatial structure
published maps and institutional affil-
iations.

                                          1. Introduction
                                                As a fast-growing tree species, Eucalyptus has been introducing and promoting genetic
Copyright: © 2021 by the authors.
                                          improvement in many regions to produce large amounts of wood for economic develop-
Licensee MDPI, Basel, Switzerland.
                                          ment [1]. However, large-area planting and continuous-planting rotation of commercial
This article is an open access article
                                          Eucalyptus plantations have caused various problems, such as reduced species diversity and
distributed under the terms and
                                          loss of soil nutrients, which threaten ecological and timber security regionally and world-
conditions of the Creative Commons
                                          wide [1–5]. Constructing mixed forests can form a stratified stand structure, which helps to
Attribution (CC BY) license (https://
                                          make full use of the forest land space and environmental resources, increase light energy
creativecommons.org/licenses/by/
4.0/).
                                          utilization, regulate the climatic environment within and outside the forest, improve forest

Forests 2021, 12, 458. https://doi.org/10.3390/f12040458                                                      https://www.mdpi.com/journal/forests
Forests 2021, 12, 458                                                                                             2 of 18

                        land environment, improve forest productivity, increase species diversity, enhance the
                        forests’ ability to resist the disaster, exert forest ecological protection benefits, and promote
                        the ecological balance [6–8]. Therefore, it is necessary to choose suitable and superior tree
                        species to build a mixed-Eucalyptus plantation characterized by a fast-growing, high-yield,
                        high-resistance, richly diverse, and stable ecosystem. Nevertheless, the growth of mixed
                        plantations is mainly restricted by the choice of the site and tree species, the collocation
                        of row spacing, and the mixing proportion and pattern. In view of the complexity of
                        these factors, it is still difficult to mix different tree species with Eucalyptus in line with
                        expectations and to ensure the ecological and economic benefits, and to realize sustainable
                        development of Eucalyptus plantations.
                              In consulting and reviewing the literature, we found that most studies on mixed-
                        Eucalyptus plantations have focused on light or water use [8,9], productivity [4,10,11],
                        carbon allocation [11–15], nutrient cycle [6,16–18], microbial communities [19,20], or suc-
                        cession dynamics [21,22], and less research has been done on the structural features of
                        mixed-Eucalyptus plantations. Forest structure determines the service function of forest
                        ecosystems by influencing the forest environment and biological factors [23]. A reasonable
                        stand structure is not only the basis of giving full play to forest function and benefit [24],
                        but also the main driving force of forest ecosystem succession. The study of stand structure
                        is the theoretical basis of the forest management and analysis, and the comprehensive
                        reflection of stand-development processes such as tree-species competition, natural suc-
                        cession, and disturbance activities [25]. The stand structure includes spatial structure and
                        nonspatial structure [26–29]. Spatial structure, generally using mingling, neighborhood
                        comparison, uniform angle index, open degree, competition index, and forest layer index
                        for evaluation, mainly refers to the point pattern of individuals and the spatial distribution
                        of their attributes. Nonspatial structure, which is evaluated by factors reflecting stand
                        characteristics, including the tree-species composition, the stand density, the tree height
                        distribution, the diameter distribution, the canopy structure, the tree-species diversity, the
                        tree vigor, the tree stability, etc., generally describes the average state of stand structural
                        characteristics, which is independent of the spatial properties of single trees. The distribu-
                        tion structure of these characteristic factors can reflect the overall stability and resistance
                        of the forest and the quality of the stand, to some extent [30–33]. Peng analyzed the age
                        structure of the forest community and the species diversity of each age level, and then
                        concluded that the age structure of the forest community can represent the stability and
                        succession dynamics of the community [34]. The research results of O’Connor et al. showed
                        that the population structure of tree species had a significant influence on stability, which
                        could be used as a conclusion for future stability [35]. Through the study of the structure
                        of stands, we can understand their distribution rules and the interaction relationship be-
                        tween tree species [24] to provide theoretical guidance for forest management. The spatial
                        structure of pure Eucalyptus forests is particularly monotonous. We hypothesized that
                        the structure of Eucalyptus plantations mixed with other tree species would improve and
                        change greatly, and the stand stability and stress resistance on resisting external adverse
                        disturbance would be enhanced tremendously, indicating the correct selection of mixed
                        species and the success of mixed pattern. In windy areas, a forest with a successful mixed
                        pattern can slow down wind speed and reduce the economic loss caused by wind damage,
                        which is also the full embodiment of ecological function [36–38]. Therefore, it is of great
                        significance to study the stand structure of Eucalyptus plantations mixed with different tree
                        species, especially the Eucalyptus plantations in windy areas.
                              Taking the preservation rate, stand density, height, diameter, stem form, degree of stem
                        inclination, tree-species composition, and age structure as evaluation indexes of the nonspa-
                        tial structure, this paper aims to analyze the structural difference of Eucalyptus (Eucalyptus
                        urophylla S. T. Blake × E. grandis W. Hill) plantations of the monoculture and mixtures
                        that are respectively combined with three different tree species (Neolamarckia cadamba
                        (Roxb.) Bosser, Acacia mangium Willd., and Pinus elliottii var. Elliottii Engelm. × P. caribaea
                        Morelet). Embarking from the actual growth status of each plantation, this study explored
Forests 2021, 12, x FOR PEER REVIEW 3 of 20
calyptus urophylla S. T. Blake × E. grandis W. Hill) plantations of the monoculture and mix-
Forests 2021, 12, 458 3 of 18
tures that are respectively combined with three different tree species (Neolamarckia ca-
damba (Roxb.) Bosser, Acacia mangium Willd., and Pinus elliottii var. Elliottii Engelm. × P.
caribaea Morelet). Embarking from the actual growth status of each plantation, this study
explored
the the standand
stand stability stability and resistance
resistance of the monoculture
of the monoculture and mixtures
and mixtures of Eucalyptus
of Eucalyptus forests
forests
and and discovered
discovered the best composition
the best composition and
and pattern of pattern of Eucalyptus
Eucalyptus mixed withmixed with tree
tree species in
species in typhoon-prone
typhoon-prone areas. areas.
2.2.Materials
Materialsand
andMethods
Methods
2.1. Site Characteristics
2.1. Site Characteristics
The ◦ 570 N, 109◦ 480 E),
Theexperimental
experimentalfield
fieldwas
waslocated
locatedononthe
theLeizhou
LeizhouPeninsula
Peninsula(20
(20°57′ N, 109°48′ E),
Zhanjiang
ZhanjiangCity,
City,Guangdong
Guangdong Province
Province (Figure
(Figure 1),
1),with
withananelevation
elevationofof3535mmand
andaagentle
gentle
terrain with a nearly 0 ◦ slope. The region is dominated by a tropical maritime monsoon cli-
terrain with a nearly 0° slope. The region is◦ dominated by a tropical maritime monsoon
mate withwith
climate a mean annual
a mean temperature
annual of 23.5
temperature C, a °C,
of 23.5 mean annual
a mean precipitation
annual of 1690.7
precipitation mm,
of 1690.7
and
mm,a relative humidity
and a relative of 81.0%,
humidity presenting
of 81.0%, an dry
presenting anand
dry wet
and seasons (May–September:
wet seasons (May–Septem-
rainy season, with south wind blowing mainly; and October–April: dry season, with
ber: rainy season, with south wind blowing mainly; and October–April: dry season, with
north wind blowing mainly). Frequent tropical storms or typhoons reach land on the
north wind blowing mainly). Frequent tropical storms or typhoons reach land on the Lei-
Leizhou Peninsula 1–3 times every year; these are the primary natural calamities in the
zhou Peninsula 1–3 times every year; these are the primary natural calamities in the Lei-
Leizhou Peninsula. When a typhoon lands, the rainfall amount increases in some areas, the
zhou Peninsula. When a typhoon lands, the rainfall amount increases in some areas, the
temporary water accumulations happen in low-lying areas, some trees are blown off, and
temporary water accumulations happen in low-lying areas, some trees are blown off, and
the tree wounds are easily infected with bacteria. Along with strong wind, heavy rainfall,
the tree wounds are easily infected with bacteria. Along with strong wind, heavy rainfall,
and storm surge, typhoon landings cause serious economic losses and social impact in
and storm surge, typhoon landings cause serious economic losses and social impact in
Zhanjiang City every year, including casualties, crop damage, house collapse, building
Zhanjiang City every year, including casualties, crop damage, house collapse, building
destruction, and production stagnation [39,40].
destruction, and production stagnation [39,40].
Figure1.1.Location
Figure Locationofofthe
theexperimental
experimentalfield
fieldininZhanjiang
ZhanjiangCity,
City,Guangdong
GuangdongProvince,
Province,China.
China.
2.2.
2.2.Characteristics
Characteristicsofofthe
theExperimental
ExperimentalPlantations
Plantations
These
These experimental plantations wereconstructed
experimental plantations were constructedininFebruary
February2014
2014and
andincluded
includedoneone
pure of Eucalyptus urophylla S. T. Blake × E. grandis
pure plantation of Eucalyptus urophylla S. T. Blake × E. grandis W. Hill “DH32-29”(EE)
plantation W. Hill “DH32-29” (EE)asas
the
thecontrol,
control,and
andthree
threemixed-Eucalyptus
mixed-Eucalyptus(DH32-29)
(DH32-29)plantations
plantationsmixed
mixedwith
withthree
threekinds
kindsofof
tree a mixed plantation of Eucalyptus and Neolamarckia cadamba
tree species: (1) a mixed plantation of Eucalyptus and Neolamarckia cadamba (Roxb.)Bosser
species: (1) (Roxb.) Bosser
(EN)
(EN)that
thatwas
wasmixed
mixedbybystrip
stripfor
forfour rowsofofEucalyptus
fourrows Eucalyptusand four
and rows
four rows N.N.
of of cadamba;
cadamba(2); (2)
a
mixed plantation of Eucalyptus and Acacia mangium Willd. (EA) that was mixed by strip
a mixed plantation of Eucalyptus and Acacia mangium Willd. (EA) that was mixed by strip
for four rows of Eucalyptus and four rows of A. mangium; and (3) a mixed plantation of
for four rows of Eucalyptus and four rows of A. mangium; and (3) a mixed plantation of
Eucalyptus and Pinus elliottii var. Elliottii Engelm. × P. caribaea Morelet (EP) that was mixed
Eucalyptus and Pinus elliottii var. Elliottii Engelm. × P. caribaea Morelet (EP) that was
by row for one row of Eucalyptus and one row of P. elliottii × P. caribaea. Since the biological
characteristics of the different tree species are intrinsically different, Eucalyptus DH32-29
and P. elliottii × P. caribaea were planted with a spacing of 1.3 m × 3.0 m, N. cadamba was
planted with a spacing of 3.9 m × 3.0 m, and A. mangium was planted with a spacing of
2.6 m × 3.0 m. They are all fast-growing excellent tree species with strong adaptabilities to
Forests 2021, 12, 458                                                                                                                   4 of 18

                                      grow in the Leizhou Peninsula. However, they were damaged annually by severe wind
                                      damages after planting (Table 1). Due to the catastrophic damage of the typhoon “Mujigae”
                                      (Super Typhoon, wind force ≥ 52 m/s, Beaufort scale ≥ 16) in October 2015, all Eucalyptus
                                      trees were blown down with stems broken; hence, all Eucalyptus were cut off from the basal
                                      stem to facilitate the germination of new branches and renew the whole stands. Recovery
                                      measures that erected leaning or fallen trees were taken for mixed species to restore stands.
                                      In June 2016, one strong branch was preserved and the others were removed. Other tending
                                      measures were consistent across the four stands.

                        Table 1. Appearance situation of tropical cyclones on the Leizhou Peninsula from 2014 to 2017.

                                                                   Maximum Wind Speed
    Landing Date                 Name          Number Code                                         Beaufort Scale        Intensity Rank
                                                                     at Landfall (m/s)
                                                                                                                         Super Typhoon
      18 July 2014            Rammasun              1409                       72                        17
                                                                                                                           (SuperTY)
                                                                                                                        Severe Typhoon
  16 September 2014            Kalmaegi             1415                       42                        13
                                                                                                                             (STY)
                                                                                                                         Super Typhoon
    4 October 2015              Mujigae             1522                       52                        16
                                                                                                                           (SuperTY)
    18 August 2016              Dianmu              1608                       28                         8            Tropical storm (TS)

                                      2.3. Data Measurements
                                           By the end of April 2017, two plots of 30 m × 30 m were set randomly in each stand
                                      type (including three mixed stands and one pure stand), adopting the random sampling
                                      method to measure the height, diameter, straight-fullness, and brunching status of stem
                                      form; the stem inclination of each tree; as well as to record the number of preserved
                                      and missing trees. The height (H, unit: m) was measured with a laser altimeter (Nikon
                                      Rangefinder Rieho 1000 AS) (precision: 0.1 m). The diameter at breast height (DBH, unit:
                                      cm) of each individual tree was measured with a tape (precision: 0.1 cm). Both the stem
                                      form and the degree of inclination of each tree were evaluated by the classification methods
                                      as described in Table 2 and Figures 2 and 3 for statistics. The classification criteria on
                                      growing status of tree stem were set mainly based on the studies [41–43] of Zhao et al.,
                                      Zhu et al., and Pelletier et al.

                                    Table 2. Classification criteria on growing status of tree stems [41–43].

                                 Stem Form                                                  Degree of Stem Inclination
        Classification                        Description                       Classification                      Description
                                  The tree has one single principal
             I                                                                        I                The tree stem grows vertically
                                  stem that is complete and straight
  (Assigning a score of 6)                                                 (Assigning a score of 6)    without leaning to any side.
                                  (well-formed).
                                  The tree has one single principal
            II                                                                       II                The tree stem has an inclination of
                                  stem that is complete and
  (Assigning a score of 5)                                                 (Assigning a score of 5)    0◦ to 30◦ from the vertical axis.
                                  curved slightly.
                                  The tree has more than two principal
            III                                                                      III               The tree stem has an inclination of
                                  stems that are branched below a
  (Assigning a score of 4)                                                 (Assigning a score of 4)    30◦ to 60◦ from the vertical axis.
                                  third of its height.
                                  The tree has more than two principal
            IV                    stems that are branched higher than                IV                The tree stem has an inclination of
  (Assigning a score of 3)        one-third and lower than two-thirds      (Assigning a score of 3)    60◦ to 90◦ from the vertical axis.
                                  of its height.
                                  The tree has more than two principal
            V                                                                        V
                                  stems that are branched higher than                                  The treetop was broken off.
  (Assigning a score of 2)                                                 (Assigning a score of 2)
                                  two-thirds of its height.
            VI                    The tree has one single stem that is               VI
                                                                                                       The tree stem was broken off.
  (Assigning a score of 1)        bent badly.                              (Assigning a score of 1)
The tree has more than two
V The tree has more than two V
V principal stems that are V
(Assigning a principal stems that are (Assigning a The treetop was broken off.
(Assigning a branched higher than two- (Assigning a The treetop was broken off.
score of 2) branched higher than two- score of 2)
score of 2) thirds of its height. score of 2)
thirds of its height.
VI VI
VI The tree has one single stem VI The tree stem was broken
(Assigning a The tree has one single stem (Assigning a The tree stem was broken
(Assigning a that is bent badly. (Assigning a off.
Forests 2021, 12, 458 score of 1) that is bent badly. score of 1) off. 5 of 18
score of 1) score of 1)
I II III IV V VI
I II III IV V VI
Figure 2. Classification criteria on stem form and silhouettes of tree stems.
Figure 2. Classification criteria
Figure 2. Classification criteriaon stemform
on stem form
and and silhouettes
silhouettes of
of tree stems. tree stems.
I II III IV V VI
I II III IV V VI
Figure 3. Classification criteria on degree of stem inclination and silhouettes of tree stems.
Figure 3. Classification criteria on degree of stem inclination and silhouettes of tree stems.
Figure 3. Classification criteria on degree of stem inclination and silhouettes of tree stems.
2.4. Data Processing and Statistical Analysis
2.4. Data Processing and Statistical Analysis
2.4. Data Processing and Statistical
Eight indicators Analysis
of nonspatial structure were assigned: preservation rate, stand den-
Eight indicators of nonspatial structure were assigned: preservation rate, stand den-
sity, height, diameter, stem form, degree of stem inclination, tree-species composition, and
Eight indicators
age structure.of nonspatial
preservationstructure
sity, height, diameter,
The were
stem form, degree of stem
rate means the assigned:
inclination,
percentage of treepreservation
tree-species composition,rate,
survival after a period stand density,
and
age structure. The preservation rate means the percentage of tree survival after a period
height, diameter, stem
of afforestation,form, degree
which indicates of
the stem
degree toinclination,
which trees aretree-species composition,
kept safe from damage
of afforestation, which indicates the degree to which trees are kept safe from damage of
of and age
external
structure. The disturbance. The
preservation calculation
rate means formula
the is as follows:
percentage of tree survival after a period of
external disturbance. The calculation formula is as follows:
afforestation, which indicates the degree to which trees are kept safe from damage of
external disturbance. The calculation formula is as follows:
n0
P= × 100%, (1)
N0
where P is the preservation rate of each stand, n0 is the number of retained plants, and N0
is the number of planted plants.
The tree height distribution was calculated by using the tree height class integration
method: every 2 m was integrated as one tree height class, and the median value of the
group represented the tree height class and was involved in the calculation. The diameter
distribution was calculated by using the diameter class integration method: every 2 cm
was integrated as one diameter class, and the median value of the group represented the
diameter class and was involved in the calculation. The stem form and inclination status of
the stem were analyzed through their classification.
In the experimental field, two tree species and two ages exist in each mixed forest, one
tree species and one age exist in the pure forest; hence, both the tree-species composition
structure and age structure of the mixed forest were assigned a value of 2.00 when evaluat-
ing the stand stability of each forest, while that of the pure forest was assigned a value of
1.00. Other evaluation indexes were assigned as their average values. The values of the
stability indexes were standardized first by adopting the method of subordinate function
value of fuzzy mathematics [44–46] and forward to make it dimensionless between 0 and
1.00. The formula is as follows:
xij − ximin
Uij = , (2)
( ximax − ximin )
where Uij is the subordinate function value of i index of j stand, Uij ∈ (0, 1.00); xij is the
measured value of i index of j stand; ximin is the minimum value of i index of j stand; and
xi max is the maximum value of i index of j stand.
The stability of the four Eucalyptus forests was assessed by the unit circle analysis
method of π value rule of optimal stand state [47,48]. According to the method of π value
rule of optimal stand state [48], when the values of all stand-state indicators are equal to
Forests 2021, 12, 458                                                                                             6 of 18

                        one, the closed chart area formed is the largest and is equal to the unit circle area π, which
                        can be regarded as the expected value of the optimal stand state. Therefore, the best stand
                        state value (expected value) always equals the unit circle area π, namely the rule of π
                        value of the best stand state. Hence, the stand state depends on the size of the closed chart
                        area composed of real stand-state indicators, and the ratio of the real stand-state value
                        (the size of closed chart area) to the optimal stand-state value (expected value) is the most
                        appropriate measurement of the real stand quality [48]. The methods are as follows: Draw
                        a circle with a radius of 1.00 and divide the circle of 360◦ into eight sector areas, which
                        represent eight nonspatial structure indexes of the stand, respectively. Starting from the
                        center of the circle of the eight sector areas, draw corresponding index lines in the form
                        of radiation and mark the index names. Sort the corresponding index value of each stand
                        from large to small and mark them on the radiation with points. Connect adjacent points
                        in turn to form a closed curve, which represents the stability state of the real stand.
                             When all indicators are equal to one, the maximum circular area of π can be regarded
                        as the optimal stand state. The ratio of the state value of the real stand to the optimal stand
                        is used to judge the stable degree of the state value of the real stand, and the formula is:

                                                                                  n − m +1
                                                                  π ( m −1)
                                                                       n      +     ∑        s2i
                                                    s + s2                          i =1
                                                 ω= 1      =                                       , m ≥ 1           (3)
                                                      π                       π
                                                                        n
                                                                        ∑ s2i
                                                                s2     i =1
                                                          ω=       =          , m = 0                                (4)
                                                                π       π
                                                                      sin θ
                                                                s2i =       L L2                                     (5)
                                                                        2 1
                        where ω is the stable degree of the state value of the real stand; s1 is sum of all sector areas
                        in a closed figure; s2 is sum of the areas of all triangles in a closed figure; n is the number
                        of indicators (n ≥ 2); m is the number of indicators equal to 1; L1 and L2 are values of two
                        adjacent indicators in the triangle part, respectively; and θ is the angle formed by two
                        adjacent indicators.
                              Therein, ω ∈ (0, 1.00). It indicates an excellent status when ω ≥ 0.70. A good status
                        is indicated when ω ∈ (0.55, 0.70). A general status is indicated by ω ∈ (0.40, 0.55). It
                        indicates a poor status when ω ∈ (0.25, 0.40). A terrible status is indicated when ω ≤ 0.25.
                              Microsoft Excel 2007 (Version 2007, Redmond, Washington D.C., USA) was used
                        for data processing, R software (Version 3.5.1, Auckland, Auckland metropolitan area,
                        New Zealand) was used for data analysis, and Python (Version 3.8, Amsterdam, Noord-
                        Holland, the Kingdom of the Netherlands) was used for drawing the figure of stand-state
                        unit circles.

                        3. Results
                        3.1. Preservation of Eucalyptus Pure and Mixed Plantation
                             The preservation rates varied in tree species and stands, as shown in Table 3. Regard-
                        ing the tree species in each experiment plantation, Eucalyptus surviving in EA and EP were
                        5.0% and 7.6% greater than those in the pure Eucalyptus forest (EE), respectively, while
                        Eucalyptus surviving in the EN mixture was 18.8% fewer than those in EE. Therefore, both
                        A. mangium and P. elliottii × P. caribaea had positive effects on the preservation of Eucalyptus.
                        Among the mixed species, N. cadamba survived the most, at 88.9%, A. mangium survived at
                        59.3%, and P. elliottii × P. caribaea survived the least, at 50.2% (Table 3). As for the whole
                        stand, the preservation rates of pure and mixed-Eucalyptus plantations demonstrated in
                        Table 3 were all at a rather lower level (less than 70%) after experiencing severe wind
                        damage four times, and only the preservation rate of EA was 2.9% greater than that of EE.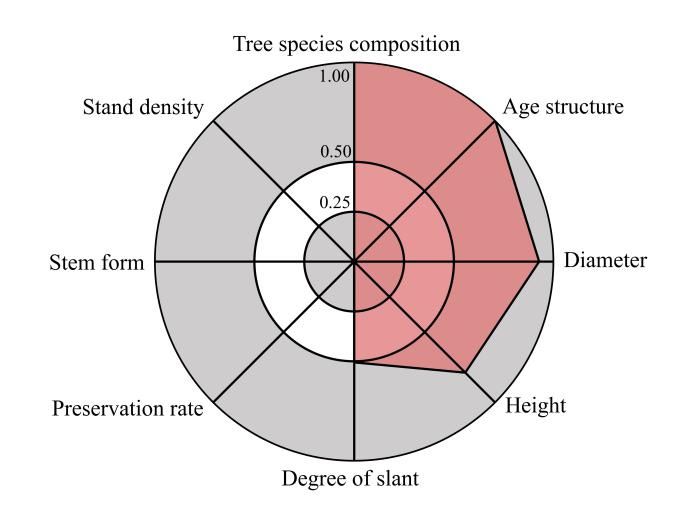
Forests 2021, 12, 458 7 of 18
Table 3. Preservation rate of pure and mixed-Eucalyptus plantations (unit: %).
Stand Type Eucalyptus Mixed Species Stand
EN 41.6 88.9 49.9
EAREVIEW
Forests 2021, 12, x FOR PEER 65.4 59.3 63.3 8 of 20
EP 68.0 50.2 59.7
EE 60.4 — 60.4
Regarding the four forests of pure Eucalyptus and mixtures, the tree heights of EA
3.2. Tree Height Distribution
were mainly distributed from 6.00 to 10.00 m (51.6% for the height class of 7 m and 22.2%
for the height class of 9 m), which was identical with that of EE (Table 4). However, the
The distribution pattern of tree height structures of 18-month-old Eucalyptus was
tree heights of EN and EP were lower than that of EE in that tree heights of EN were
demonstrated to mainly
be similar in the pure and mixed-Eucalyptus forests (Figure 4). The tree
distributed from 4.00 to 8.00 m (21.6% for the height class of 5 m and 54.3% for the
of Eucalyptus
height class of 7 mheight received
class of 7 m), theheights
and tree largestofpercentage in four
EP were mainly stands,from
distributed followed
2.00 toby
4.00 m
that of 9 m. As for(31.3%)
38-month-old mixed tree species, only the tree height distributions
and 6.00 to 8.00 m (39.0%). In addition, even though the proportion of height of class
N. cadamba and A.thatmangium were
was greater similar,
than 7 m ofsince the number
Eucalyptus was EA >ofEPtrees
> EEwith
> EN afrom
height
highclass
to lowofin se-
quence,
7 m was the largest, the proportion
followed by that ofof5height
m. The class that was
number ofgreater than 7a m
trees with in EAclass
height was similar
of 3 mto EE
was the largest in(0.3% less),
EP. All and
the that in EN and EP were
mixed-Eucalyptus 6.9%
forests and demonstrated
were 23.5%, respectively, lessunevenly
to be than that in EE
(Table 4).
aged, multistoried structures (Figure 4).
Eucalyptus N. cadamba Eucalyptus A. mangium
Eucalyptus N. cadamba Eucalyptus A. mangium
500 60 500 60
Frequency (trees ha-1)
Frequency (trees ha-1)
400 50 400 50
Percentage (%)
Percentage (%)
40 40
300 300
30 30
200 200
20 20
100 100 10
10
0 0 0 0
1 3 5 7 9 11 1 3 5 7 9 11 13
Tree height (m) Tree height (m)
(a) (b)
Eucalyptus
P. elliottii × P. caribaea Eucalyptus Eucalyptus
Eucalyptus
800 P. elliottii × P. caribaea 90 1200 60
Frequency (trees ha-1)
Frequency (trees ha-1)
700 80 1000 50
Percentage (%)
70
Percentage (%)
600
60 800 40
500
50 600 30
400
40
300 30 400 20
200 20 200 10
100 10
0 0 0 0
1 3 5 7 9 11 1 3 5 7 9 11
Tree height (m) Tree height (m)
(c) (d)
Figure 4. Tree height distribution of E. urophylla × E. grandis at the age of 18 months and of mixed tree species at the age of
Figure 4. Tree height distribution of E. urophylla × E. grandis at the age of 18 months and of mixed tree
38 months in the monoculture and mixtures. Height of the histograms shows the distribution frequency of tree height of
each species at the
tree species per age of 38
hectare. months
The in the
line shows themonoculture and mixtures.
distribution percentage Height
of tree height of of thetree
each histograms
species pershows
hectare.the
(a)
Mixeddistribution
plantation offrequency
Eucalyptus of
andtree height of
N. cadamba each
(EN); (b)tree species
mixed per hectare.
plantation Theand
of Eucalyptus lineA.shows
mangiumthe(EA);
distribution
(c) mixed
plantation of Eucalyptus
percentage andheight
of tree P. elliottii
of ×each
P. caribaea (EP); (d) per
tree species purehectare.
forest of E.(a)
urophylla
Mixed× plantation
E. grandis (EE).
of Eucalyptus and
N. cadambaTable
(EN);4. (b)
Treemixed
height plantation Eucalyptus
ofpure
distribution of and
Eucalyptus A. and
forest mangium (EA); (c) mixed
mixed-Eucalyptus forest. plantation of
Eucalyptus and P. elliottii × P. caribaea (EP); (d) pure forest of E. urophylla × E. grandis (EE).Forests 2021, 12, 458 8 of 18
Regarding the four forests of pure Eucalyptus and mixtures, the tree heights of EA
were mainly distributed from 6.00 to 10.00 m (51.6% for the height class of 7 m and 22.2%
for the height class of 9 m), which was identical with that of EE (Table 4). However, the tree
heights of EN and EP were lower than that of EE in that tree heights of EN were mainly
distributed from 4.00 to 8.00 m (21.6% for the height class of 5 m and 54.3% for the height
class of 7 m), and tree heights of EP were mainly distributed from 2.00 to 4.00 m (31.3%)
and 6.00 to 8.00 m (39.0%). In addition, even though the proportion of height class that was
greater than 7 m of Eucalyptus was EA > EP > EE > EN from high to low in sequence, the
proportion of height class that was greater than 7 m in EA was similar to EE (0.3% less),
and that in EN and EP were 6.9% and 23.5%, respectively, less than that in EE (Table 4).
Table 4. Tree height distribution of pure Eucalyptus forest and mixed-Eucalyptus forest.
Height Class (Unit: m)
Stand Type 1 3 5 7 9 11 13
N % N % N % N % N % N % N %
EN 11 0.9 128 9.9 278 21.6 700 54.3 167 12.9 5 0.4 0 0
EA 28 2.0 111 8.1 217 15.7 711 51.6 306 22.2 0 0 5 0.4
EP 78 4.4 550 31.3 233 13.3 684 39.0 211 12.0 0 0 0 0
EE 44 2.5 211 12.0 194 11.0 1006 57.1 306 17.4 0 0 0 0
Note: N is the number of retained plants per hectare corresponding to the height class.
3.3. Diameter Distribution
The diameter distribution of Eucalyptus in the different mixtures resembled that of
EE: the diameter class of 7 cm accounted for the largest proportion, followed by the 9 cm
diameter class, in spite of some subtle differences being demonstrated among the four
stands (Figure 5). With regard to mixed tree species, both the diameter distribution of
N. cadamba and A. mangium were exhibited to be two-peak structures and ranged from
4.00 to 12.00 cm mostly, while most diameters of P. elliottii × P. caribaea ranged from 2.00
to 8.00 cm. The proportion of diameter class greater than 7 cm of Eucalyptus from high to
low was EP > EA > EN > EE, and that of mixed species from high to low was A. mangium,
N. cadamba, and P. elliottii × P. caribaea.
It was demonstrated (Table 5) that the distribution of stand diameters of EN and EA
were identical to EE for diameters that were mainly distributed in the 7 cm diameter class
(ranged from 6.00 to 8.00 cm), followed by the 9 cm diameter class (ranged from 8.00 to
10.00 cm). The diameters of the mixed forest of Eucalyptus and P. elliottii × P. caribaea were
mainly distributed in a diameter class of 7 cm (33.6% ranged from 6.00 to 8.00 cm), followed
by a 5 cm diameter class (25.6% ranged from 4.00 to 6.00 cm). Generally, the proportion of
diameter class that was greater than 7 cm of stands was EA > EN > EE > EP from high to
low (Table 5).
Table 5. Diameter class distribution of pure Eucalyptus forest and mixed-Eucalyptus forest.
Diameter Class (Unit: cm)
Stand Type 1 3 5 7 9 11 13 15
N % N % N % N % N % N % N % N %
EN 28 2.2 161 12.5 195 15.1 422 32.7 300 23.3 133 10.3 39 3.0 11 0.9
EA 28 2.0 122 8.9 222 16.1 456 33.1 361 26.2 139 10.1 50 3.6 0 0
EP 44 2.5 306 17.4 450 25.6 589 33.6 339 19.3 28 1.6 0 0 0 0
EE 55 3.1 267 15.2 339 19.3 728 41.3 372 21.1 0 0 0 0 0 0
Note: N is the number of retained plants per hectare corresponding to the diameter class.were identical to EE for diameters that were mainly distributed in the 7 cm diameter class
(ranged from 6.00 to 8.00 cm), followed by the 9 cm diameter class (ranged from 8.00 to
10.00 cm). The diameters of the mixed forest of Eucalyptus and P. elliottii × P. caribaea were
mainly distributed in a diameter class of 7 cm (33.6% ranged from 6.00 to 8.00 cm), fol-
lowed by a 5 cm diameter class (25.6% ranged from 4.00 to 6.00 cm). Generally, the pro-
Forests 2021, 12, 458 9 of 18
portion of diameter class that was greater than 7 cm of stands was EA > EN > EE > EP from
high to low (Table 5).
Eucalyptus N. cadamba Eucalyptus A. mangium
Eucalyptus N. cadamba Eucalyptus A. mangium
300 40 400 40
Frequency (trees ha-1)
Frequency (trees ha-1)
Percentage (%)
Percentage (%)
30 300 30
200
20 200 20
100
10 100 10
0 0 0 0
1 3 5 7 9 11 13 15 1 3 5 7 9 11 13
Diameter
Forests 2021, 12, x FOR PEER REVIEW class (cm) Diameter class (cm) 10 of 20
(a) (b)
Eucalyptus
Eucalyptus Eucalyptus
P. elliottii × P. caribaea
Eucalyptus
800 50
P. elliottii × P. caribaea
500 50
Frequency (trees ha-1)
Frequency (trees ha-1)
40
Percentage (%)
400 40 600
Percentage (%)
30
300 30 400
20
200 20
200
100 10 10
0 0 0 0
1 3 5 7 9 11 13 1 3 5 7 9 11 13
Diameter class (cm) Diameter class (cm)
(c) (d)
FigureFigure
5. Diameter distribution
5. Diameter of E. urophylla
distribution of E.×urophylla
E. grandis × at the age of 18
E. grandis atmonths
the ageand of mixed
of 18 months tree species
and at the tree
of mixed age of
38 months in the monoculture and mixtures. Height of the histograms shows the distribution frequency of diameter of
species at the age of 38 months in the monoculture and mixtures. Height of the histograms shows the
each tree species per hectare. The line shows the distribution percentage of diameter of each tree species per hectare. (a)
Mixeddistribution
plantation of frequency of diameter
Eucalyptus and N. cadambaof(EN);
each(b)
tree species
mixed per hectare.
plantation The line
of Eucalyptus and shows the distribution
A. mangium (EA); (c) mixed
plantation of Eucalyptus
percentage and P. elliottii
of diameter × P. caribaea
of each (EP); (d)per
tree species pure forest of (a)
hectare. E. urophylla
Mixed ×plantation
E. grandis (EE).
of Eucalyptus and
N. cadamba (EN); (b) mixed plantation of Eucalyptus and A. mangium (EA); (c) mixed plantation of
Table 5. Diameter class distribution of pure Eucalyptus forest and mixed-Eucalyptus forest.
Eucalyptus and P. elliottii × P. caribaea (EP); (d) pure forest of E. urophylla × E. grandis (EE).
Diameter Class (Unit: cm)
Stand 3.4. Structure of the Tree Stem Form
1 3 5 7 9 11 13 15
Type
NApparent
% differences
N % on the%degree
N N of % straight-fullness
N % and brunching
N % N are % demon-
N %
EN strated
28 in2.2Figure161 6. 12.5
In different
195 15.1mixed422 patterns,
32.7 only
300 the23.3proportion
133 10.3of straight-fullness
39 3.0 11 0.9
EA of Eucalyptus
28 2.0 stems
122 in
8.9 EA was larger than that in
222 16.1 456 33.1 361 26.2 139 EE (1.9% larger10.1
in Grade
50 I),
3.6and 0the 0
EP proportion
44 2.5of branches
306 17.4was 450lower
25.6than589that33.6
in EE339(0.7%19.3
lower28in Grade
1.6 III,0 3.8%0lower0 in 0
EE Grade 55 IV,3.1
and 0.3%
267 lower
15.2 339in Grade
19.3 V).728
The 41.3
proportion of Grade
372 21.1 0 I Eucalyptus
0 0 stems 0 in 0EN 0
was 26.2% lower
Note: than
N is the thatofinretained
number pure forests,
plants perand thecorresponding
hectare proportiontoofthe Grade III,class.
diameter Grade IV, and
Grade V Eucalyptus stems was 3.9%, 1.7%, and 6.2% greater, respectively, than that in EE.
3.4. Structure
The stem straight-fullness of the Tree Stem
proportion Form
of Eucalyptus in EP was slightly lower than that of
EE, and the branches Apparent
were slightlydifferences
more onthanthethat
degree of straight-fullness and brunching are demon-
of EE.
Compared tostrated
other in Figure
mixed 6. In different
species, mixedofpatterns,
the degree only the proportion
straight-fullness of straight-fullness
and brunching of tree of
Eucalyptus stems in EA was larger than that in EE (1.9% larger in Grade I), and the pro-
stems of N. cadamba in Grade I and Grade II accounted for the smallest proportions of 19.4%
portion of branches was lower than that in EE (0.7% lower in Grade III, 3.8% lower in
and 16.1%, respectively; and in Grade IV and Grade V, accounted for the largest proportions
Grade IV, and 0.3% lower in Grade V). The proportion of Grade I Eucalyptus stems in EN
of 29.0% and 31.2%, respectively,
was 26.2% lower than indicating
that in purethat branches
forests, and the most N. cadamba
ofproportion sprouted
of Grade III, Grade IV, and
from a position greater
Grade Vthan a third
Eucalyptus of the
stems washeight of the
3.9%, 1.7%, tree.
and 6.2%Most of A.
greater, mangium than
respectively, mainly
that in EE.
had a single slightly curved
The stem stem (46.5%
straight-fullness for Grade
proportion II), and the
of Eucalyptus proportion
in EP was slightly oflower
branches
than that of
of A. mangium was EE, substantially
and the branches were slightly
greater than thatmoreofthan that of EE.but lower than that of
Eucalyptus,
Compared to other mixed species, the degree of straight-fullness and brunching of
tree stems of N. cadamba in Grade I and Grade II accounted for the smallest proportions of
19.4% and 16.1%, respectively; and in Grade IV and Grade V, accounted for the largest
proportions of 29.0% and 31.2%, respectively, indicating that branches of most N. cadamba
sprouted from a position greater than a third of the height of the tree. Most of A. mangiumForests 2021, 12, 458 10 of 18
Forests 2021, 12, x FOR PEER REVIEW 11 of 20
N. cadamba. The majority of P. elliottii × P. caribaea grew straight and full for Grade I,
accounting for 81.3%.
I II III IV V VI
Tree species of each stand
EE
E
P
EP
E
A
EA
E
N
EN
E
0 20 40 60 80 100
Percentage of the degree of straight-fullness and brunching
(%)
Figure 6. Degree of straight-fullness and brunching of tree stems of different tree species in each
Figure 6. Degree of straight-fullness and brunching of tree stems of different tree species in each
stand.
stand. Length
Length of different
of different colors
colors shows shows the
the percentage percentage
of different gradesofofdifferent
stem form.grades of stem form. EN:
EN: mixed
mixed plantation
plantation of Eucalyptusof (E)Eucalyptus (E) (N);
and N. cadamba N. mixed
andEA: cadamba (N); EA:
plantation (E) and A. of Eucalyptus (E) and
mixed plantation
of Eucalyptus
mangium (A); EP:(A);
A. mangium mixed
EP:plantation of Eucalyptus
mixed plantation of(E) and P. elliottii
Eucalyptus × P. caribaea
(E) and (P); ×
P. elliottii EE:P.pure forest(P); EE: pure forest
caribaea
of E. urophylla × E. grandis.
of E. urophylla × E. grandis.
From the perspective of the whole stand, the stem structure of the trees in EN was
From the perspective
mainly manifested as a single stemof (including
the wholewell-formed
stand, theandstem structure
slightly curvedofstems),
the trees in EN was
and branched from the position that was higher than a third of the height of the tree (Table curved stems),
mainly manifested as a single stem (including well-formed and slightly
6).and branched
The stem structurefrom thetrees
of the position thatand
of EA, EP, wasEEhigher thanmanifested
was mainly a third of as the height of the tree
a single
stem (including
(Table 6). Thewell-formed and slightly
stem structure curved
of the stems),
trees with
of EA, theand
EP, mostEE well-formed
was mainlystemsmanifested as a
(EPsingle
> EE >stem
EA). In short, EN had
(including the highest ratio
well-formed of branching
and slightly visibly
curved (41.0%),
stems), and the
with EP had
most well-formed
thestems
most straight and complete stem form (68.7%).
(EP > EE > EA). In short, EN had the highest ratio of branching visibly (41.0%), and
EP 6.had
Table theofmost
Degree straight and
straight-fullness complete
and brunching stem
of tree form
stems (68.7%).
among pure and mixed forests of
Eucalyptus.
Table 6. Degree of straight-fullness and brunching of tree stems among pure and mixed forests
Stand Type I (%) II (%) III (%) IV (%) V (%) VI (%)
of Eucalyptus.
EN 32.3 25.0 7.8 16.8 16.4 1.7
EA 52.0 29.4 6.5 6.1 4.8 1.2
Stand Type I (%) II (%) III (%) IV (%) V (%) VI (%)
EP 68.7 17.4 8.5 3.2 0.3 1.9
EE EN 67.2 32.3
17.7 25.0
6.9 7.8
6.9 0.316.8 1.0 16.4 1.7
EA 52.0 29.4 6.5 6.1 4.8 1.2
EP
3.5. Degree of Stem Inclination 68.7 17.4 8.5 3.2 0.3 1.9
EE 67.2 17.7 6.9 6.9 0.3 1.0
In the four experimental forests, more than 95% of the trees grew vertically without
leaning to any side (Figure 7), except the A. mangium (no more than 85%), as its inclination
proportion
3.5. Degree is particularly evident, up to 15.1%. The degree of inclination of Eucalyptus in
of Stem Inclination
mixed plantations was more obvious than that in the pure forest, among which EN > EA
In the four experimental forests, more than 95% of the trees grew vertically without
> EP. There was no inclined stem, but broken-off tree stems of N. cadamba at 2.2% in EN.
There was atoslight
leaning any inclination
side (Figure 7), for
(1.8% except
Grade III,A.0.9%
the mangium (noIV)
for Grade more than
of the 85%),
stems as its inclination
of P.
proportion
elliottii is particularly
× P. caribaea evident,
and 0.5% broken-off upoftoEucalyptus
stems 15.1%. in The thedegree of inclination
mixed plantation of of Eucalyp-
tus in mixed
Eucalyptus plantations
and P. elliottii wasAs
× P. caribaea. more obvious
a whole, thanofthat
the degree stem in the pure
inclination forest,
of EA was among which
identified
EN > EA to be> greatest,
EP. There followed
was no byinclined
EN, EP, and stem,EE but
(Table 7).
broken-off tree stems of N. cadamba at 2.2%
in EN. There was a slight inclination (1.8% for Grade III, 0.9% for Grade IV) of the stems of
P. elliottii × P. caribaea and 0.5% broken-off stems of Eucalyptus in the mixed plantation of
Eucalyptus and P. elliottii × P. caribaea. As a whole, the degree of stem inclination of EA was
identified to be greatest, followed by EN, EP, and EE (Table 7).Forests 2021,12,
2021,
Forests 12,458
x FOR PEER REVIEW 12 of 20 11 of 18
I II III IV V VI
EE
E
Tree species of each stand
P
EP
E
A
EA
E
N
EN
E
0 20 40 60 80 100
Percentage of stem inclination (%)
Figure 7. Degree of stem inclination of different tree species among pure and mixed forests of
Figure 7. Degree of stem inclination of different tree species among pure and mixed forests of Eu-
Eucalyptus. Length of different colors shows the percentage of different grades of stem inclination.
calyptus. Length of different colors shows the percentage of different grades of stem inclination.
EN:mixed
EN: mixed plantation
plantation of Eucalyptus
of Eucalyptus (E) N.
(E) and and N. cadamba
cadamba (N);
(N); EA: EA: plantation
mixed mixed plantation of Eucalyptus
of Eucalyptus (E) (E)
andA.A.mangium
and mangium (A);
(A); EP:EP: mixed
mixed plantation
plantation of Eucalyptus
of Eucalyptus (E)P.and
(E) and P. elliottii
elliottii × P. caribaea
× P. caribaea (P); EE: pure
(P); EE: pure
forest
forestofofE.E.urophylla × E.
urophylla ×grandis.
E. grandis.
Table 7. Degree of the inclination of tree stems among pure and mixed forests of Eucalyptus.
Table 7. Degree of the inclination of tree stems among pure and mixed forests of Eucalyptus.
Stand Type I (%) II (%) III (%) IV (%) Ⅴ (%) VI (%)
Stand
EN Type 96.1 I (%) 1.3 II (%) 1.7 III (%) 0 IV (%) 0 V (%)0.9 VI (%)
EA EN 91.9 96.1 3.2 1.3 3.7 1.7 1.2 0 0 0 0 0.9
EP EA 96.8 91.9 1.0 3.2 1.6 3.7 0.3 1.2 0 0 0.3 0
EE EP 97.8 96.8 1.0 1.0 0.6 1.6 0.6 0.3 0 0 0 0.3
EE 97.8 1.0 0.6 0.6 0 0
3.6. Evaluation of Stand Stability
3.6. The
Evaluation
values of
of Stand Stability of nonspatial structure were characterized and pre-
eight indicators
sentedThe values
in Table of eight
8. The indicators
stability of nonspatial
of the four stands was structure
assessedwere characterized
by combining and presented
the subordi-
nate function
in Table valuestability
8. The of the fuzzy comprehensive
of the four stands and wasthe π valueby
assessed rule of the optimal
combining the stand
subordinate
state (Table
function 9, Figure
value of the8).fuzzy
The subordinate
comprehensive function
andvalue
the πofvalue
EA wasrule0.17 greater
of the than stand
optimal the state
pure forest, and its state value of real stand was 0.20 greater than the pure
(Table 9, Figure 8). The subordinate function value of EA was 0.17 greater than the pure forest. The
subordinate
forest, and itsfunction value of
state value of real
EP was 0.09
stand wasgreater than thethan
0.20 greater purethe
forest,
pureand its state
forest. Thevalue
subordinate
of
function value of EP was 0.09 greater than the pure forest, and its state value of
real stand was 0.09 greater than the pure forest. The subordinate function value ofENreal stand
was 0.06 less than the pure forest, and its state value of real stand was 0.05 greater than
was 0.09 greater than the pure forest. The subordinate function value of EN was 0.06 less
the pure forest. Hence, the stand stability of the mixed forest of Eucalyptus and A. mangium
than the pure forest, and its state value of real stand was 0.05 greater than the pure forest.
presented as optimal for its subordinate function value of 0.76, and the state value (ω2 =
Hence, the stand stability of the mixed forest of Eucalyptus and A. mangium presented as
0.61) of real stand was the largest, followed by the mixed forest of Eucalyptus and P. elliottii
optimal for its subordinate function value of 0.76, and the state value (ω 2 = 0.61) of real
× P. caribaea (ω3 = 0.50), pure Eucalyptus forest (ω4 = 0.41), and mixed forest of Eucalyptus
stand
and N. was the (ω
cadamba largest, followed by the mixed forest of Eucalyptus and P. elliottii × P. caribaea
1 = 0.36).
(ω 3 = 0.50), pure Eucalyptus forest (ω 4 = 0.41), and mixed forest of Eucalyptus and N. cadamba
(ω 18.=Summary
Table 0.36). statistics of pure and mixed-Eucalyptus plantation.
Stand Stand Density Preservation Heightstatistics
Table 8. Summary Diameter
of pureStem Degree of plantation.
and mixed-Eucalyptus Stem Tree-Species Age Struc-
Form
Type (Trees/ha) Rate (%) (m) (cm) Inclination Composition ture
Stand
EN Stand Density
994 Preservation
49.9 Height Diameter
6.50 ± 0.12 7.29 ± 0.17 4.35 ± 0.10 Degree
5.90 ± 0.04 of Stem 2 Tree-Species2 Age
Stem Form
Type (Trees/ha) Rate (%) (m) (cm) Inclination Composition Structure
EA 1200 63.3 6.77 ± 0.11 7.38 ± 0.16 5.14 ± 0.08 5.86 ± 0.03 2 2
ENEP 994
1589 49.9
59.7 5.496.50 ± 0.126.12 ±7.29
± 0.13 0.12± 0.17 4.35 ± 0.10
5.45 ± 0.06 5.90 ± 0.04 2
5.93 ± 0.02 2 2 2
EA 1200 63.3 6.77 ± 0.11 7.38 ± 0.16 5.14 ± 0.08 5.86 ± 0.03 2 2
EPEE 1628
1589 60.4
59.7 6.565.49
± 0.10
± 0.136.28 ±6.12
0.12± 0.12
5.42 ± 0.06 5.96 ± 0.02
5.45 ± 0.06 5.93 ± 0.02 1 2 1 2
EE 1628 60.4 6.56 ± 0.10 6.28 ± 0.12 5.42 ± 0.06 5.96 ± 0.02 1 1
Note: The values are mean ± standard error for height, diameter, stem form, and degree of stem inclination.Forests 2021, 12, x FOR PEER REVIEW 13 of 20
Forests 2021, 12, 458 12 of 18
Note: The values are mean ± standard error for height, diameter, stem form, and degree of stem inclination.
Table 9. Subordinate function values of eight nonspatial structure indexes and their means of stands.
Table 9. Subordinate function values of eight nonspatial structure indexes and their means of stands.
Tree-Species
Stand Stand Preservation Stem Degree of Stem Age Struc- Subordinate
Height Diameter Composi-
Type Density Rate Form Degree of
Inclination Subordinate
Stand Stand Preservation Tree-Species
tion Ageture Function Values
Height Diameter Stem Form Stem Function
Type Density Rate Composition Structure
EN 0.00 0.00 0.79 0.93 0.00
Inclination0.51 1.00 1.00 0.53
Values
EN 0.00 EA
0.00 0.32 0.79 1.00 0.931.00 1.00
0.00 0.72 0.51 0.00 1.00 1.00 1.001.00 0.76
0.53
EA 0.32 EP
1.00 0.94 1.00 0.73 1.000.00 0.00
0.72 1.00 0.00 0.75 1.00 1.00 1.001.00 0.68
0.76
EP 0.94 EE
0.73 1.00 0.00 0.78 0.000.83 0.12
1.00 0.97 0.75 1.00 1.00 0.00 1.000.00 0.59
0.68
EE 1.00 0.78 0.83 0.12 0.97 1.00 0.00 0.00 0.59
ω1 = 0.36 ω2 = 0.61
(a) (b)
ω3 = 0.50 ω4 = 0.41
(c) (d)
Figure 8. Stand-state unit circles of pure and mixed-Eucalyptus forests of different tree species. ω1 is the stable state value
Figure 8. Stand-state unit circles of pure and mixed-Eucalyptus forests of different tree species. ω
of mixed plantation of Eucalyptus and N. cadamba (EN); ω2 is the stable state value of mixed plantation of Eucalyptus and 1
is the stable
A. mangium (EA); ωstate value
3 is the stable of mixed
state plantation
value of of Eucalyptus
mixed plantation and
of Eucalyptus andN.P. cadamba
elliottii × P.(EN); 2 is the
ω(EP);
caribaea stable
and ω4 is
thestate
stablevalue
state value of the pure
of mixed forest of E.
plantation ofurophylla × E. grandis
Eucalyptus and A. (EE). (a) Mixed(EA);
mangium plantation
ω 3 isof the
Eucalyptus
stableand N. cadamba
state value of
(EN); (b) mixed plantation of Eucalyptus and A. mangium (EA); (c) mixed plantation of Eucalyptus and P. elliottii × P. caribaea
mixed plantation of Eucalyptus and P. elliottii × P. caribaea (EP); and ω 4 is the stable state value of
(EP); (d) pure forest of E. urophylla × E. grandis (EE).
the pure forest of E. urophylla × E. grandis (EE). (a) Mixed plantation of Eucalyptus and N. cadamba
4. Discussion
(EN); (b) mixed plantation of Eucalyptus and A. mangium (EA); (c) mixed plantation of Eucalyptus and
The(d)
P. elliottii × P. caribaea (EP); characteristics
pure forest of
ofstand structure×can
E. urophylla express and
E. grandis (EE).reflect the inter- or intraspecific
competition state and the stability of stands, and have great impacts on the maintenance
4. Discussion
The characteristics of stand structure can express and reflect the inter- or intraspecific
competition state and the stability of stands, and have great impacts on the maintenance of
biodiversity, the production of target tree species, and stand qualities [35,49–51]. Stability
of the forest represents the comprehensive ability of forest ecosystem to resist external
environment disturbance and restore the initial state after disturbance [52,53], and ecologi-
cal restoration is the fundamental measure of ecological security to maintain the relative
stability of the plant ecosystem [54]. Assessing stability from the perspective of nonspatial
structure can reveal its stand resistance, resilience, and durability in response to extreme cli-
mate or other natural disturbances. Building a fast-growing, high-yield, and high-stability
Eucalyptus mixed plantation in a windy area is a way of guaranteeing protection to ensure
economic benefits and improve the woodland ecological environment. Prodigious changesForests 2021, 12, 458 13 of 18
in nonspatial structure and stand stability of three kinds of mixed patterns of Eucalyptus
and other tree species were demonstrated in detail, and were in line with expectations, but
not all mixed patterns could improve stand stability.
4.1. Preservation Rate Changes with Mixed Tree Species
The preservation rate is not only an important indicator of the overall stability and
resistance of stands, but also an important indicator of stand quality and forest health. The
preservation rate reflects the internal living ability of the forest and the adaptability to the
environment of the forestland, which is the quantity basis for maintaining the reasonable
structure of the stand [55]. Under the condition of the same site, the stand preservation
rate of each experimental forest was mainly affected by external disturbance factors or
internal competition and interaction among different tree individuals in the stand. External
disturbance factors mainly included human disturbance and natural disturbance. The
management and tending measures of the experimental forests were all consistent except
for the mixed pattern, and all stands located at the same site grew under identical climate
and weather conditions, so they suffered from the same natural disturbances, especially
the wind damage in the Leizhou Peninsula. Therefore, the difference in stand preservation
rate was mainly affected by the mixed pattern, and the competition and interaction among
different individual trees.
In our study, both A. mangium and P. elliottii × P. caribaea had a positive effect on
the preservation of Eucalyptus, but only when Eucalyptus were mixed with A. mangium
could the overall stand preservation rate of the mixed forest be promoted (Table 3). This
is because the self-preservation rate of P. elliottii × P. caribaea was not high under the
influence of Eucalyptus and the natural environment, so the stand preservation rate of
EP was lower than that of pure Eucalyptus. Other studies in mixed forests of Eucalyptus
and other tree species obtained comparable results, even though they were conducted on
different mixed ratios and sites. Zheng and He demonstrated that the stand preservation
rate of the mixed forest of Eucalyptus “Leizhou No.1” and A. auriculiformis mixed by row
(1 row of Eucalyptus and 1 row of A. auriculiformis A. Cunn. ex Benth.) was greater than the
pure forest, while that mixed by two tree individuals was lower than the pure forest [56].
Yang et al. showed that only when Eucalyptus “U6” and A. crassicarpa Benth. were mixed
by ratios of 3:1 (3 rows of Eucalyptus and 1 row of A. crassicarpa) or 3:2 (3 rows of Eucalyptus
and 2 rows of A. crassicarpa), their stand preservation rates were lower than the pure forest,
but other mixed ratios were greater than that of the pure forest [37]. Chen indicated that
the preservation rate of E. wetarensis Pryor × E. camaldulensis Dehnh. “Wc3” had increased
by 1.79% after mixing with Cunninghamia lanceolata (Lamb.) Hook. (mixed ratio was 1 to 3)
and by 1.2% after mixing with P. massoniana Lamb. (mixed ratio was 1 to 6) as compared
with pure Eucalyptus forest. Meanwhile, the preservation rate of C. lanceolata increased,
and that of P. massoniana decreased in the mixtures [57]. Deng also demonstrated that the
stand preservation rates of the mixed forest of E. dunnii Maiden and C. lanceolata were
different when they were mixed at different ratios [58]. Therefore, different mixed tree
species and mixed ratios can lead to different stand preservation rates of mixed-Eucalyptus
plantations. In addition, the preservation rate of N. cadamba was the highest, up to 88.9%,
even though it had a negative effect on the survival of Eucalyptus (Table 3), which indicated
that N. cadamba had stronger resistance than Eucalyptus, and N. cadamba may become the
dominant tree species in the future. Therefore, the mixed pattern, competitive ability, and
interaction among tree species under the specific sites were the main factors from which
the effects will determine the future succession tendency of the community.
4.2. Mixed Pattern Affects Structure Distribution of Tree Height and Diameter
Diameter distribution and tree height distribution can reflect the degree of tree differ-
entiation and the competition among trees in the stand, which are important indexes of
the structural stability of the stand, and also important variables to measure the quality
of the stand and formulate the adjustment and optimization scheme when performingYou can also read