State of the AONB Report 2021 - Wye Valley Area of Outstanding Natural Beauty (AONB)
←
→
Page content transcription
If your browser does not render page correctly, please read the page content below

Wye Valley
Area of Outstanding Natural Beauty (AONB)

    State of the AONB Report 2021

                 To Accompany the
    Wye Valley AONB Management Plan 2021-2026
Contents
List of Tables ......................................................................................................................................................... 2
List of Figures & Maps .......................................................................................................................................... 4
Introduction .......................................................................................................................................................... 5
Wye Valley Area of Outstanding Natural Beauty (AONB) .................................................................................... 5
Priority Habitats analysis ...................................................................................................................................... 5
   Wales Priority Habitat data .............................................................................................................................. 6
   Orchards ........................................................................................................................................................... 7
   Sensitive Habitats ............................................................................................................................................. 7
   Priority Habitats in SSSIs ................................................................................................................................... 8
   Wider AONB Network picture .......................................................................................................................... 9
Farming statistics analysis .................................................................................................................................... 9
Land Management Agreements .........................................................................................................................12
Veteran Trees .....................................................................................................................................................13
Woodland Data...................................................................................................................................................17
   Carbon Offsetting ...........................................................................................................................................21
   Woodland in Active Management..................................................................................................................21
   Ancient Woodland ..........................................................................................................................................21
Traditional Orchards ...........................................................................................................................................22
Designated Sites data .........................................................................................................................................24
   Local Nature Reserves (LNRs) .........................................................................................................................24
   Special Areas of Conservation (SACs) .............................................................................................................25
   Sites of Special Scientific Interest (SSSIs) .......................................................................................................26
   SSSI condition (England) .................................................................................................................................30
   Local Wildlife Sites ..........................................................................................................................................33
Listed Buildings ...................................................................................................................................................34
Scheduled Ancient Monuments .........................................................................................................................35
Offa’s Dyke .........................................................................................................................................................36
Conservation Areas.............................................................................................................................................37
Heritage at Risk...................................................................................................................................................38
Welsh Historic Landscapes .................................................................................................................................39
Historic Parks and Gardens ................................................................................................................................40
Landownership ...................................................................................................................................................41
Small Commons ..................................................................................................................................................42
Access Land.........................................................................................................................................................43
Promoted Routes................................................................................................................................................44
Welsh Language..................................................................................................................................................45
Railway Heritage .................................................................................................................................................47
The River Wye and tributaries ............................................................................................................................50
Land Use .............................................................................................................................................................53
   Green Belt .......................................................................................................................................................53
   Flood possibility by land use...........................................................................................................................53
   Land Use Change: Land changing to residential use ......................................................................................54

Wye Valley AONB State of the AONB Report 2021                                                                                             Page 1 of 60

Housing Density ..............................................................................................................................................54
Dark Skies ...........................................................................................................................................................55
Ecosystem Services analysis ...............................................................................................................................55
  Carbon Stock value .........................................................................................................................................58

List of Tables

Table 1 – Wye Valley AONB England Priority Habitats (source - Natural England MEOPL data)                         6
Table 2 – Wales Sensitive Habitats (Glastir Woodland Creation Sensitivity Layer – Priority Habitats gis layer)    7
Table 3 – English AONB Priority Habitats and SSSIs (source – Natural England MEOPL data)                          8
Table 4 - SSSI English Priority Habitat condition (source – Natural England MEOPL data)                           8
Table 5 – English AONB land holdings (source – Natural England MEOPL data)                                        9
Table 6 – English AONB farmed area land use (source – Natural England MEOPL data)                                10
Table 7 – English AONB farm size (source – Natural England MEOPL data)                                           10
Table 8 – English AONB farm labour (source – Natural England MEOPL data)                                         10
Table 9 – English AONB pig and sheep farming (source – Natural England MEOPL data)                               11
Table 10 – English AONB cattle farming (source – Natural England MEOPL data)                                     11
Table 11 – English AONB poultry farming (source – Natural England MEOPL data)                                    11
Table 12 – Live (Jan 2021) Environmental Stewardship and Countryside Stewardship Agreements English AONB
     (source – Natural England MEOPL data and gis table)                                                         12
Table 13 - Wye Valley AONB Veteran Tree Survey data                                                              14
Table 14 - Woodland Trust Veteran Tree Survey data (source – Ancient Tree Inventory GB & NI)                     15
Table 15 – Parkland data in AONB (source – gis table)                                                            15
Table 16 - Wye Valley AONB woodland 2011 to 2018 (source - National Forest Inventory)                            18
Table 17- Wye Valley AONB woodland 2011 (source - National Forest Inventory 2011)                                19
Table 18 - Wye Valley AONB woodland 2012 (source - National Forest Inventory 2012)                               19
Table 19 - Wye Valley AONB woodland 2013 (source - National Forest Inventory 2013)                               20
Table 20 - Wye Valley AONB woodland 2014 (source - National Forest Inventory 2014)                               20
Table 21 - Wye Valley AONB woodland 2015 (source - National Forest Inventory 2015)                               20
Table 22 - Wye Valley AONB woodland 2017 (source - National Forest Inventory 2017)                               20
Table 23 – Wye Valley AONB woodland 2018 (source - National Forest Inventory 2018)                               20
Table 24 – Wye Valley AONB Ancient Woodland (source – Natural England (2020) & NRW (2011) gis layers)            21
Table 25 – Ancient woodland total for England and Wales, and Wye Valley AONB Ancient Woodland as a percentage
     (source – Natural England (2020) & NRW (2011) gis layers)                                                   22
Table 26 – Woodland cover in the Wye Valley AONB, including orchards                                             23
Table 27 – Wye Valley AONB Local Nature Reserves (source – NRW/NE gis tables)                                    24
Table 28 – Wye Valley AONB Special Areas of Conservation (source NRW/NE gis tables)                              25
Table 29 – Wye Valley AONB SSSIs in England and condition status (source - Natural England SSSI gis layer)       28
Table 30 – Wye Valley AONB SSSIs in England condition status (Source – Natural England data)                     28
Table 31 – Wye Valley AONB SSSIs in Wales (Source – NRW SSSI gis table)                                          29
Table 32 – Wye Valley AONB (England) SSSI condition 2003 to 2020                                                 33
Table 33 – Wye Valley AONB Local Wildlife Sites / SINCs / SNCIs (source – Wye Valley AONB gis data)              33
Table 34 – Listing buildings by grade in the Wye Valley AONB (source – Historic England / Cadw gis tables)       34
Table 35 - Time period of Scheduled Ancient Monuments in Wales (source – Cadw gis table data)                    35
Table 36 – Offa's Dyke Scheduled Ancient Monument sections condition (source – Historic England / English Heritage)
                                                                                                                 36
Table 37 – Offa's Dyke unscheduled sections condition (source – The Offa’s Dyke Conservation Management Plan
     (2018), extrapolated from past condition surveys of adjoining scheduled monument sections)                  37

Wye Valley AONB State of the AONB Report 2021                                                                                           Page 2 of 60
Table 38 - Heritage at Risk register, English AONB (Source – MEOPL data / Historic England Heritage at Risk Register)
                                                                                                                    38
Table 39 – Registered Historic Parks and Gardens in the Wye Valley AONB (sources – Historic England / Cadw gis
     datasets)                                                                                                      40
Table 40 – Welsh language ability in 3 most complete Wye Valley AONB electoral wards (source – 2011 census)         45
Table 41 – Welsh speakers in Monmouthshire 2001 and 2011 comparison (source – 2011 census)                          45
Table 42 – Welsh speakers in Monmouthshire all ages                                                                 45
Table 43 – Welsh speakers in Monmouthshire age 3-4                                                                  46
Table 44 – Welsh speakers in Monmouthshire age 5-15                                                                 46
Table 45 – Welsh speakers in Monmouthshire age 16-19                                                                46
Table 46 – Welsh speakers in Monmouthshire age 20-44                                                                46
Table 47 – Welsh speakers in Monmouthshire age 45-65                                                                46
Table 48 – Welsh speakers in Monmouthshire age 65-74                                                                46
Table 49 – Welsh speakers in Monmouthshire age 75+                                                                  46
Table 50 – Railway heritage features, condition and information (source – Wye Valley Cycleway Project Feasibility
     Study, Structural Condition Assessments (July 2001)                                                            49
Table 51 – Area of Flood Zones 2 & 3 in the Wye Valley AONB (Source – Environment Agency gis dataset)               50
Table 52 – River gauge data for Mordiford 2015 – 2020                                                               51
Table 53 – River gauge data for Ross-on-Wye 2015 – 2020                                                             52
Table 54 – River gauge data for Lydbrook 2015 – 2020                                                                52
Table 55 – River gauge data for Monmouth 2017 – 2020                                                                52
Table 56 – River gauge data for Redbrook 2017 – 2020                                                                52
Table 57 – Developed Land Use in the Wye Valley AONB and all AONBs (source – MHCLG land use statistics 2018) 53
Table 58 –Non-developed Land Use in the Wye Valley AONB and all AONBs (source – MHCLG land use statistics 2018)
                                                                                                                    53
Table 59 – Total developed land use at risk of flooding from rivers and sea, High probability (+3.3%) (source – MHCLG
     land use statistics 2018)                                                                                      54
Table 60 – Total non-developed land use at risk of flooding from rivers and sea, High probability (+3.3) (source –
     MHCLG land use statistics 2018)                                                                                54
Table 61 – Land changing to residential use in the Wye Valley AONB (England only) (Source – MHCLG land use change
     statistics 2017 and 2018)                                                                                      54
Table 62 – Wye Valley AONB (Wales) Light pollution levels (Source – Tranquility and Place – Dark Skies, NRW/LUC) 55
Table 63 – Value of assessed Ecosystem Services in Herefordshire (Source – The Marches Ecosystem Assessment,
     Holzinger 2016)                                                                                                56
Table 64 – Value of assessed Ecosystem Services for 6.9% of Herefordshire, representing the size of the Herefordshire
     AONB (Source – extrapolated from The Marches Ecosystem Assessment, Holzinger 2016)                             57
Table 65 – Annual Ecosystem Services value per ha Herefordshire (Source – The Marches Ecosystem Assessment,
     Holzinger 2016)                                                                                                57
Table 66 – Annual Ecosystem Services value for the Wye Valley AONB (Source – Extrapolated from data in The
     Marches Ecosystem Assessment, Holzinger 2016)                                                                  58
Table 67 – Carbon Stock value for Herefordshire (Source - The Marches Ecosystem Assessment, Holzinger 2016)         58
Table 68 – 6.9% of the Carbon Stock in Herefordshire, representing the size of the Herefordshire AONB (Source –
     Extrapolated from data in The Marches Ecosystem Assessment, Holzinger 2016)                                    58
Table 69 – Estimated Carbon Stock for the Wye Valley AONB (Source – Extrapolated from data in The Marches
     Ecosystem Assessment, Holzinger 2016)                                                                          59

Wye Valley AONB State of the AONB Report 2021                                                   Page 3 of 60
List of Figures & Maps

Figure 1 - Live (Jan 2021) Environmental Stewardship and Countryside Stewardship Agreements English AONB
     (source – Natural England open data gis table)                                                                12
Figure 2 - Recorded Veteran Tree locations (Source – AONB/Woodland Trust/Parkland data gis layers)                 13
Figure 3 - Wye Valley AONB Woodlands (source - National Forest Inventory 2018)                                     17
Figure 4 – Woodland in the AONB by type (source – National Forest Inventory 2018)                                  18
Figure 5 – Wye Valley AONB woodland cover (source - National Forest Inventory)                                     19
Figure 6 – Ancient Woodland in the Wye Valley AONB (source – Natural England (2020) & NRW (2011) gis layers) 22
Figure 7 – Orchards Wye Valley AONB (source – Open Source gis downloads)                                           23
Figure 8 – Wye Valley AONB Local Nature Reserves (source – NRW/NE gis tables)                                      24
Figure 9 – Wye Valley AONB Special Areas of Conservation (source – combined NRW/NE gis tables)                     26
Figure 10 – Wye Valley AONB Sites of Special Scientific Interest (SSSIs) (source – NE/NRW gis tables)              30
Figure 11 – SSSI condition in the Wye Valley AONB (England), favourable status 2003 to 2020 (source Natural England
     gis table)                                                                                                    31
Figure 12 – SSSI condition in the Wye Valley AONB (England), unfavourable recovering status 2003 to 2020 (source
     Natural England gis table)                                                                                    31
Figure 13 – SSSI condition in the Wye Valley AONB (England), unfavourable no change status 2003 to 2020 (source
     Natural England gis table)                                                                                    32
Figure 14 – SSSI condition in the Wye Valley AONB (England), unfavourable declining status 2003 to 2020 (source
     Natural England gis table)                                                                                    32
Figure 15 - Location of Local Wildlife Sites in the AONB (source – Wye Valley AONB gis data)                       34
Figure 16 - Schedules Ancient Monuments in the AONB (Source – Historic England / Cadw gis tables)                  35
Figure 17 - Conservation Areas in the Wye Valley AONB (source – Local Authority records)                           37
Figure 18 - Map showing the Welsh Historic Landscape of the Lower Wye Valley (source - Lle gis dataset)            39
Figure 19 - Registered Historic Parks and Gardens in the Wye Valley AONB (source – Historic England / Cadw gis
     datasets)                                                                                                     40
Figure 20 - Public Forest estate in the Wye Valley AONB (source – NRW / Forestry Commission gis datasets)          41
Figure 21 - Registered Common Land in the Wye Valley AONB (source – DEFRA / Lle gis datasets)                      42
Figure 22- CROW Access Land in the Wye Valley AONB (source – Combined Defra, NRW and FC gis datasets)              43
Figure 23 - Wye Valley Walk and Offa’s Dyke National Trail within the Wye Valley AONB (Source – Wye Valley AONB
     dataset)                                                                                                      44
Figure 24 - Wye Valley AONB former railway line and station/halt locations (source – Wye Valley AONB dataset) 47
Figure 25 – The river Wye and its main tributaries within the AONB, and the location of gauge stations (source – Wye
     Valley AONB dataset)                                                                                          50
Figure 26 – Flood Zone 2 (*black) and Flood Zone 3 (*Blue) in the Wye Valley AONB (England only) (source –
     Environment Agency gis dataset)                                                                               51
Figure 27 – Graph showing average river levels at river Wye gauges in the Wye Valley AONB (source - riverlevels.uk)
                                                                                                                   53

Wye Valley AONB State of the AONB Report 2021                                                  Page 4 of 60
Introduction
To assess habitat and landscape change, we need to collate and understand the baseline data that already
exists. This report is a comprehensive look at current data and statistics where they exist for the Wye Valley
Area of Outstanding Natural Beauty (AONB).
The Wye Valley AONB straddles the English Welsh border and 3 counties. There is not always consistency in
what, and the how, data is collated and disseminated in the different countries and counties. The result of this
is that some data is available only for one country or the other and a full picture across the nationally
designated protected landscape is not available. Methodologies vary and in some cases there is also
duplication with habitats being mapped and reported in both countries’ datasets. The source and scope of
data analysed is defined in this report.
This State of the AONB Report is an appendix of the statutory Wye Valley AONB Management Plan (2021-26)
and considers the variety of habitats, land use, features and Special Qualities across the AONB. It consolidates
the information available to measure and monitor the Special Qualities, including their extent, condition and
context within the wider landscape.
Wye Valley Area of Outstanding Natural Beauty (AONB)
The Wye Valley AONB covers 32,735 ha (126 square miles). It is the only cross-border Protected Landscape
being 20,864 ha in England and 11,871 ha in Wales. This is 0.16% of the total land mass of England and 0.57%
of Wales. The AONB contains 14,996 ha (45.8% of the AONB) in the County of Herefordshire, 11,871 ha (36.3%)
in Monmouthshire and 5,868 ha (17.9%) in Gloucestershire. There are 92km (58 miles) of the lower reaches
of the River Wye in the AONB.
Priority Habitats analysis
UK BAP priority habitats cover a wide range of semi-natural habitat types, and were those that were identified
as being the most threatened and requiring conservation action under the UK Biodiversity Action Plan (UK
BAP).
As a result of devolution, and new country-level and international drivers and requirements, much of the work
previously carried out by the UK BAP is now focused at a country-level rather than a UK-level, and the UK BAP
was succeeded by the 'UK Post-2010 Biodiversity Framework' in July 2012. The UK list of priority habitats,
however, remains an important reference source and has been used to help draw up statutory lists of priority
habitats in England, Scotland, Wales and Northern Ireland, as required under Section 41 of the Natural
Environment and Rural Communities (NERC) Act 2006 (England).
There are 28 Priority Habitats identified in England. 10 of these habitats are found in the Wye Valley AONB
(*mapped as Priority Habitat but considered non priority habitat).
Coastal and Floodplain grazing marsh
Deciduous Woodland
Good quality semi-improved grassland*
Lowland Calcareous Grassland
Lowland Dry Acid Grassland
Lowland Heathland
Lowland Meadows
Mudflats
Purple Moor Grass and Rush Pasture
Traditional Orchards
Wye Valley AONB State of the AONB Report 2021 Page 5 of 60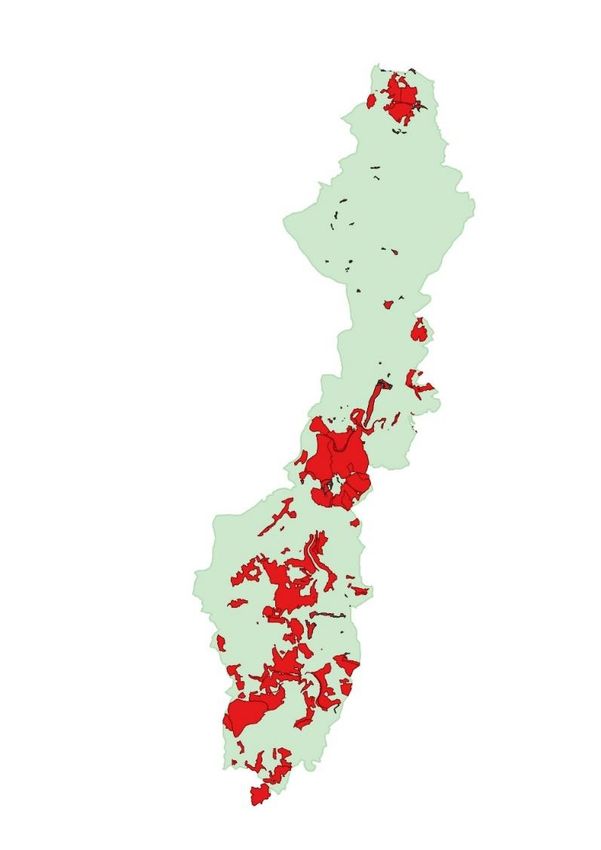
Priority Habitats not found in the Wye Valley AONB (habitats identified in bold are priority habitats in both
England and Wales) are Blanket Bog, Calaminarian Grassland, Coastal Saltmarsh, Coastal sand dunes,
Coastal vegetated shingle, Fragmented heath*, Grass moorland *, Limestone pavement, Lowland fens,
Lowland raised bog, Maritime cliff and slope, Mountain heath and willow scrub, Reedbeds, Saline lagoons,
Upland Calcareous Grassland, Upland flushes, fens and swamps, Upland hay meadows, and Upland
heathland.

3,903.07 ha of the English Wye Valley AONB are mapped as Priority Habitats (see table 1 below). Included in
this national data set are the habitats Good Quality Semi Improved Grassland, Fragmented Heath and Grass
Moorland which are all non-priority habitat (*), and ‘no main habitat but additional habitat present’ where
candidate habitats remain but no main habitat can be identified (**).

The 3,903.07 ha in the English part of the Wye Valley AONB equates to 18.71% of the land area.

The most widespread Priority Habitat is Deciduous Woodland of which there are 2,945.92 ha in the Wye Valley
AONB. This equates to 14.12% of the land area. Comparing this to 5.54% of the land area of England being
Deciduous Woodland gives a good indication of the importance of the Wye Valley for this particular priority
habitat. The Wye Valley AONB (England) contains 0.4% of the English Deciduous Woodland resource in only
0.16% of the land. In 2013 Deciduous Woodland accounted for 39% of total priority habitat resource in
England.

 Habitat (this table relates to England         England (ha)   WVAONB (ha)      WVAONB %      Resource as %       AONB
 only, but habitats identified as priority in                                    national      of England        coverage
 Wales also are in bold)                                                         resource
 Coastal and Floodplain grazing marsh           219,918.33          5.03          0.002%          1.654%          0.02%
 Deciduous Woodland (NB – specific              736,623.40        2945.92          0.400%         5.541%         14.12%
 woodland types priority in Wales)
 Good quality semi-improved grassland*           74,275.68         174.54          0.235%         0.559%          0.84%
 Lowland Calcareous Grassland                    62,942.80          3.25           0.005%         0.473%          0.02%
 Lowland Dry Acid Grassland                      15,560.16          1.49           0.010%         0.117%          0.01%
 Lowland Heathland                               57,073.04         11.13           0.020%         0.429%          0.05%
 Lowland Meadows                                 22,179.89         122.46          0.552%         0.167%          0.59%
 Mudflats                                        65,035.53         29.95           0.046%         0.489%          0.14%
 No main habitat but additional habitat         204,370.22         451.48          0.221%         1.537%          2.16%
 present**
 Purple Moor Grass and Rush Pasture               9,857.94          3.77           0.038%         0.074%          0.02%
 Traditional Orchards                            16,053.86         154.05          0.960%         0.121%          0.74%
                                                2,091,163.91      3903.07          0.187%                        18.71%
Table 1 – Wye Valley AONB England Priority Habitats (source - Natural England MEOPL data)

Wales Priority Habitat data
The Wye Valley AONB Unit are not supplied with comparable Priority Habitat data for Wales. The Environment
(Wales) Act 2016 Section 7 lists the ‘habitats of principle importance for the purpose of maintaining and
enhancing biodiversity in relation to Wales’. The list is the same as the list previously under section 42 of the
NERC Act and is under review. The list of habitats is extensive and similar to the England list, with the following
additions, Wood pasture & parkland; Upland Oak Woodland; Lowland beech and yew woodland; upland mixed
ash woodland; wet woodland; lowland mixed deciduous woodland (NB – England Priority habitat is Deciduous
Woodland); hedgerows; arable field margins; rivers; oligtrophic and dystrophic lakes; ponds; mestrophic lakes;
eutrophic standing waters; aquifer-fed natural fluctuating water bodies; inland rock outcrops and scree
habitats; open mosaic on previously developed land; intertidal boulder communities; sabellaria alvelata reefs;
estuarine rocky habitats; intertidal mudflats (presumed to be the same as England priority habitat Mudflats);

Wye Valley AONB State of the AONB Report 2021                                                Page 6 of 60
seagrass beds; sheltered muddy gravels; peat and clay exposures; tidal swept channels; fragile sponge and
anthozoan communities on subtidal rocky habitats; carbonate reefs; subtidal sands and gravels; subtidal mixed
muddy sediments; mud habitats in deep water; musculus discors beds; blue mussel beds; horse mussel beds;
maerl beds.

No GIS layer showing Welsh Priority Habitats is available on Lle, but a GIS table has been found showing
Orchards in Wales, as well as a Glastir Woodland Creation ‘sensitive habitats’ layer which identifies the
location of some priority habitats. From these data sources the following has been derived.

Orchards
The Natural Resources Wales report Traditional Orchard Habitat Inventory of Wales establishes there are
1,037.3ha of traditional orchard in Wales (including marginal sites), of which 452.4ha are found in
Monmouthshire. In the Monmouthshire part of the AONB there are 63.7ha of Orchard. This data establishes
that the Wye Valley AONB (Wales only) has 6.1% of the nation's traditional orchards in only 0.57% of the land
area.

Sensitive Habitats
Through the sensitive habitat data, we can analyse the priority habitats in the table 2 below. It can be seen
that whilst the Wye Valley AONB contains a number of the Wales priority habitats, other than traditional
orchards, there are only small pockets of the national resource. It is established elsewhere in this report that
the AONB landscape is made up of a high proportion of woodland, particularly in the southern half, but it has
not been possible to map the specific deciduous woodland types which are listed in the Welsh Priority Habitats
(other than wet woodland listed below). It is however known the Wye Valley AONB contains fine examples of
lowland beech and yew woodland, wood pasture and parkland, as well a mosaic of other woodland types
containing oak and ash amongst other important species.

 habitat                     Wales (ha)      WVAONB (ha)        WVAONB % of           Habitat Wales      Habitat AONB
                                                               national resource        coverage           coverage
 Blanket Bog or                272.95             1.85              0.678%               0.013%             0.016%
 Lowland Raised Bog
 Wet Woodland (scrub           487.87             0.19              0.039%               0.024%              0.002%
 component)
 Wet Woodland                  149.78            5.57               3.719%               0.007%              0.047%
 Purple Moor Grass            29,201.12          13.48              0.046%               1.415%              0.114%
 and Rush Pastures
 Mosaic of BAP                2.380.83             3.6              0.151%               0.115%               0.03%
 habitats
 May support Lowland          1,597.41           10.75              0.673%               0.077%              0.091%
 Meadows
 Maritime Cliff and           3,501.58            0.48              0.014%                0.17%              0.004%
 Slopes
 Lowland Meadows              1,273.64           24.37              1.913%               0.062%              0.205%
 Lowland Heathland           14,741.57           4.42              0.03%                 0.714%                0.037%
 Lowland Fens and             6,803.06           14.1             0.207%                  0.33%                0.119%
 Reedbeds
 Lowland Dry Acid            33,271.02           4.63             0.014%                 1.612%                0.039%
 Grassland
 Lowland Calcareous           1,018.36           1.67             0.164%                 0.049%                0.014%
 Grassland
 Inland Rock Outcrop          1,811.51           0.05             0.003%                 0.088%                0.000%
 and Scree habitats
 TOTAL                        96,510.7           85.16            0.088%                                       0.717%
Table 2 – Wales Sensitive Habitats (Glastir Woodland Creation Sensitivity Layer – Priority Habitats gis layer)

Wye Valley AONB State of the AONB Report 2021                                                      Page 7 of 60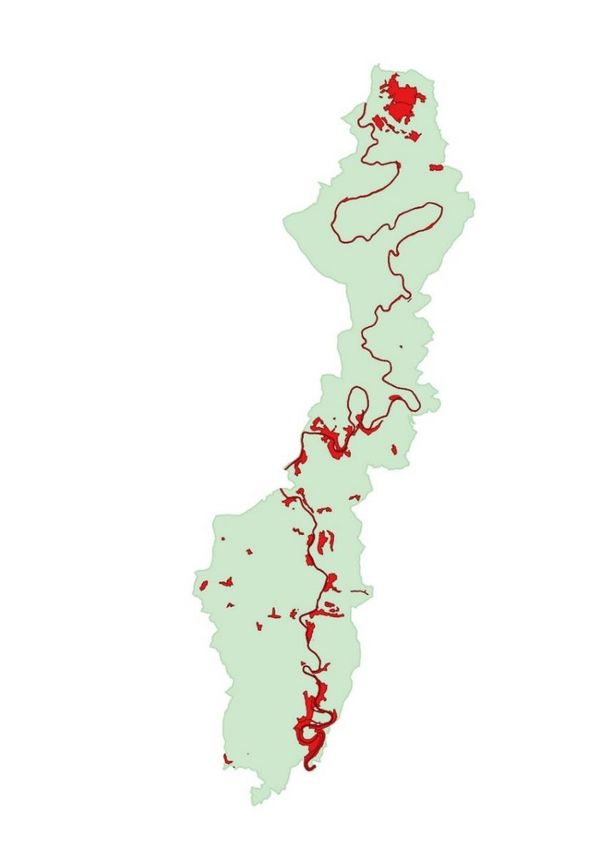
Priority Habitats in SSSIs
Of the 3,903.07 ha of Priority Habitat in the English AONB, 999.11 ha is within designated Sites of Special
Scientific Interest (SSSI) and 625.05 ha is on land within a Higher Level Stewardship agreement but outside
SSSI. The remaining 2,278.92 ha has no designation or land management agreement, the vast majority of this
(1,982.18 ha) is Deciduous Woodland. These statistics indicate that 41.6% of these Priority Habitats have a
level of protection and/or existing Environmental Stewardship Agreements over them.

Table 3 below shows Priority Habitats in SSSIs, and in Environmental Stewardship within the English parts of
the AONB.

 habitat                                      English Wye          In SSSI         In Higher Tier / HLS   Outside SSSI Not in
                                           Valley AONB total                         but outside SSSI      Higher Tier / HLS
 Coastal and Floodplain grazing marsh             5.03                                                            5.03
 Deciduous Woodland                             2945.92            836.29                127.45                1,982.18
 Good quality semi-improved                      174.54                0.77              153.14                  20.63
 grassland
 Lowland Calcareous Grassland                     3.25                 0.12                  2.33                 0.80
 Lowland Dry Acid Grassland                       1.49                                       1.45                 0.04
 Lowland Heathland                               11.13                                       10.97                0.16
 Lowland Meadows                                 122.46                6.06                  74.22               42.18
 Mudflats                                        29.95              29.44                                         0.51
 No main habitat but additional                  451.48            126.33                225.77                  99.38
 habitat present
 Purple Moor Grass and Rush Pasture               3.77                                       3.50                 0.27
 Traditional Orchards                            154.05                0.10                  26.22              127.74
 TOTAL                                          3903.07            999.11                625.05                2,278.92
Table 3 – English AONB Priority Habitats and SSSIs (source – Natural England MEOPL data)

Of the 999.11 ha of Priority Habitat is SSSIs, table 4 below indicates that 721.43 ha (72.21%) of this is
considered to be in favorable condition. 216.46 ha (21.67%) is in Unfavorable recovering condition. The
remaining 61.21 ha (6.13%), almost entirely Deciduous Woodland habitat, is in either Unfavorable no change
or Unfavorable declining condition. These statistics indicated that a very high percentage of priority habitat is
SSSIs are in good condition. Habitat outside SSSI is not monitored for condition status, but if we take the
monitored sites as a representative cross section of all habitats, we could suggest that over 90% of the Priority
Habitat in the English Part of the Wye Valley AONB is in good or moving towards good condition. This equates
to over 3,500 ha of habitat, or approximately 0.17% of the National Resource.

                                                          Favourable          Unfavourable     Unfavourable    Unfavourable
                                                                               recovering       no change        declining
 Deciduous Woodland                                           570.85             204.26           42.54           18.65
 Good Quality Semi Improved Grassland*                         0.26               0.51
 Lowland Calcareous Grassland                                  0.12
 Lowland Meadows                                               0.76            5.30
 Mudflats                                                      29.42           0.01
 No main habitat but additional habitat present**             120.00           6.30                                  0.02
 Traditional Orchard                                           0.01            0.09
 Total                                                        721.43          216.46           42.54 (4.26%)   18.67 (1.87%)
                                                             (72.21%)        (21.67%)
Table 4 - SSSI English Priority Habitat condition (source – Natural England MEOPL data)

Wye Valley AONB State of the AONB Report 2021                                                         Page 8 of 60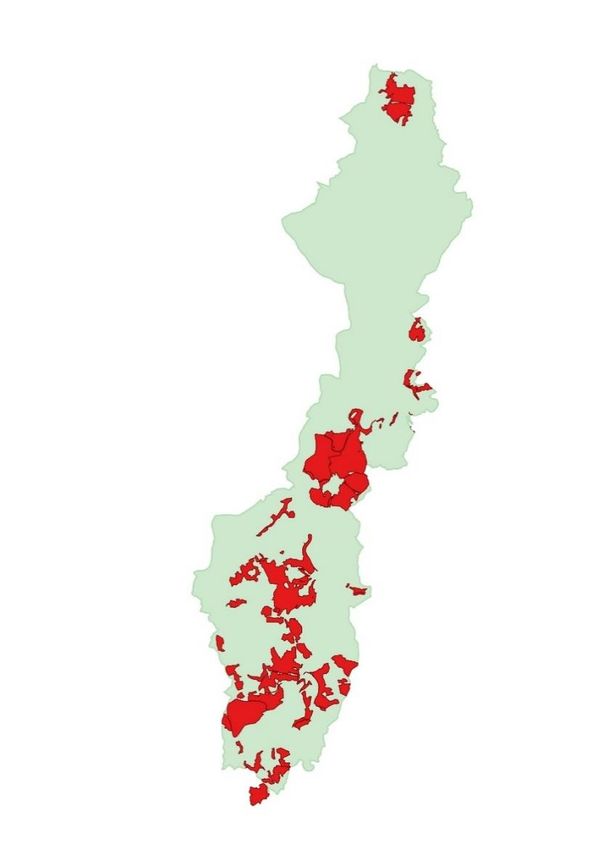
Wider AONB Network picture
The total land area of AONBs in England is 1,915,135 ha, which equates to 14.4% of the country. AONBs
collectively contain 512,533.75 ha of Priority Habitat, which equates to 26.76% of the total resource. Only
15.73% of England is considered to be Priority Habitat. This indicates that, as may be expected, AONBs are
strongholds for the nation’s highest priority habitats. By way of example, 22.7% of deciduous woodland,
25.77% of Good Quality Semi-Improved Grassland*, 31.01% of Lowland Heathland, 32.12% of Lowland
Calcareous Grassland, 39.01% of Blanket Bog, 64.17% of Maritime Cliff and Slope and 65.44% of Upland
Heathland is found in AONBs.

The 34 AONBs in England contain a wide variety of important habitats and as each landscape is different, so
the important and key habitats as different. The Wye Valley AONB, being a lowland and primarily inland
landscape, contains few examples of coastal or upland priority habitats. By analysing priority habitats across
the AONB network, we can though identify where the Wye Valley AONB can play an important role in both
the conservation and enhancement of particular habitats.

The Wye Valley AONBs 20,864 ha of land equates to 1.09% of the total covered by AONBs in England. The
three Priority Habitats where the Wye Valleys percentage of the resource across AONBs is greater than its
percentage of total AONB land are Deciduous Woodland (1.76% of the national AONB resource), Traditional
Orchards (6.56% of the national AONB resource) and Lowland Meadows (3.06% of the national AONB
resource). These habitats are all identified in the AONB Management Plan as Special Qualities. All AONBs play
an important role in the conservation and enhancement of valuable habitats. The statistics back up the special
nature of the Wye Valley AONBs Deciduous Woodland, Traditional Orchards and Lowland Meadows.

Farming statistics analysis
Natural England MEOPL data provides us with agricultural statistics, from which we can establish recent local
farming trends. The statistics in table 5 show that although the number of land holdings decreased in between
2010 and 2013, the total farmed area and amount of both rented and owned land increased. Although the
number of land holdings increased again by 2016, the statistics show us that the amount of land managed by
those holdings, both rented and owned, decreased. Over the time period 2010 to 2016, the number of
holdings in the English part of the Wye Valley AONB has increased slightly from 226 to 232, but the farmed
area has decreased by just under 500 ha. The hectares of land rented has overall decreased slightly and the
area of land owned increased by just over 400 ha.

                Farmed area            Rented land       Owned land
          Holdings      Area (ha)       Area (ha)         Area (ha)
 2010        226         13,777       4,416 (32.1%)     9,145 (66.4%)
 2013        220         15,446       5,855 (37.9%)     10,049 (65.1%)
 2016        232         13,290       4,399 (33.1%)     9,553 (71.9%)
Table 5 – English AONB land holdings (source – Natural England MEOPL data)

Statistics for land use (table 6 below) show that there has been a significant decrease in the amount of
permanent grassland in the English part of the AONB, decreasing from 41% of farmed area to 31.7%. Small
increases in temporary grass and rough grazing can be seem, with a more significant rise in the amount of
woodland on farmed land of 2.8%, from 3.8% to 6.6%. This equates to 343ha increase from 2010 to 2016. The
largest single land use increase can be seen in the crops & bare fallow land, rising by 4.8% over 6 years to over
half of all farmed land (50.6%).

Wye Valley AONB State of the AONB Report 2021                                              Page 9 of 60
LAND USE (hectares)
Crops & bare Temp grass Permanent Rough grazing Woodland All other Total (ha)
fallow grass (sole right) land
2010 6,306 (45.8%) 986 (7.2%) 5,651 (41%) 100 (0.7%) 527 (3.8%) 206 (1.5%) 13,776
2013 8,006 (51.8%) 1,134 (7.3%) 5,105 (33.1%) 54 (0.4%) 957 (6.2%) 190 (1.2%) 15,446
2016 6,719 (50.6%) 1,115 (8.4%) 4,217 (31.7%) 163 (1.2%) 870 (6.6%) 205 (1.5%) 13,289
Table 6 – English AONB farmed area land use (source – Natural England MEOPL data)
Data relating to farm size (table 7) over the same period show increases in the numbers of farms of less than
20 hectares in size, and a general decrease in the number of farms over 20 hectares in size. Farms of less than
20 hectares in size were 40.7% of all holdings in 2010; by 2016 47% of holdings were under 20 ha. At the largest
end of the scale, 18.1% of holdings were over 100 ha in size in 2010, compared to 13.4% in 2016.
Year Farm Size in hectares (number of farms)
= 100
2010 22 (9.7%) 70 (31%) 46 (20.4%) 47 (20.8%) 41 (18.1%)
2013 28 (12.7%) 64 (29.1%) 37 (16.8%) 50 (22.7%) 41 (18.6%)
2016 25 (10.8%) 84 (36.2%) 42 (18.1%) 50 (21.6%) 31 (13.4%)
Table 7 – English AONB farm size (source – Natural England MEOPL data)
Farm labour data (table 8) indicates that numbers of full-time farmers in the English AONB remained static
between 2010 and 2016, but there was a slight decrease in part-time farm workers from 197 to 185. The
numbers of casual workers increase from 325 in 2010 to 493 in 2013, but then decreased significantly to only
180 in 2016. This demonstrates the seasonal and unpredictable nature of casual work. The numbers of people
employed full time and part time by farms follows a similar trend, increasing from 2010 to 2013, before
decreasing significantly in 2016. The statistics all show that there are fewer people working in agriculture in
the Wye Valley AONB in 2016 than in 2010, which reflects the national trend.
Labour (number of people)
Farmers Farmers Managers Managers Casual Employees Employees Total
full time part time full time part time workers Full Time Part Time labour*
2010 175 197 325 100 56 872
2013 173 195 493 103 66 1060
2016 175 189 16 8 180 84 54 707
Table 8 – English AONB farm labour (source – Natural England MEOPL data)
*it is noted the number of people indicated in columns doesn’t add up to the ‘total’. These figures are taken directly
from the data supplied, the reason for this data anomaly is unknown.
We are also provided with data related to stock on farms in the English AONB, which are presented and
anylised here.
The Wye Valley AONB is a mixed farming landscape with no great tradition in pig farming. The amount of pigs
farmed across the English side of the AONB (table 10) rose between 2010 and 2016 from 1,752 animals to
2,503, a significant increase of 751 or a 42% increase from 2010 levels.
Sheep farming is a more common activity across the AONB, however in the same time period the total number
of sheep farmed in the English AONB fell (table 9), despite a small increase in 2013, from 27,627 to 23,419.
This represents a reduction in sheep numbers of 4,208, or 15.2% fewer than 2010 levels.
Wye Valley AONB State of the AONB Report 2021 Page 10 of 60Pigs Sheep (number)
(number)
Total pigs Breeding Lambs Other Total
Ewes under 1yr sheep sheep
2010 1,752 13,522 13,213 892 27,627
2013 1,833 14,262 13,011 778 28,051
2016 2,503 11,313 11,484 621 23,419
Table 9 – English AONB pig and sheep farming (source – Natural England MEOPL data)
Cattle numbers in the English AONB (table 10) also decreased between 2010 and 2016 by 1,005 animals in
total, or 13.9% of 2010 numbers. Dairy herds in the English AONB dropped about one quarter between 2010
and 2013, but levelled off in 2016. Beef herds have reduced gradually over the same time period, dropping by
just over 20% from 2010 levels. Calf numbers show a similar decrease.
Cattle (number)
Dairy herd Beef herd CalvesLand Management Agreements
MEOPL data provided by Natural England, along with gis data, provides a snap shot of live land management
agreements in the Wye Valley AONB (England only). Data for previous years has not been sought, but these
figures can be used to analyse trends in future reports.
In January 2021 there are 41 Environmental Stewardship agreements live covering 1,821.93ha, as well as 75
Countryside Stewardship Agreements covering 5,225.25ha. Table 12 and figure 1 below show a breakdown of
agreements.
Environmental Stewardship Agreements Countryside Stewardship Agreements
Higher Entry Level Organic Entry Hedgerows Higher Mid Tier Woodland
Level plus Higher Level plus and Tier Management
Level Higher Level Boundaries Plan
Hectares 145.29 1,258.28 418.36 77.00 1,003.16 3,673.17 471.91
Heref. 4 16 4
Agreements 1 11 53 10
Glouc. 2 14 1
Table 12 – Live (Jan 2021) Environmental Stewardship and Countryside Stewardship Agreements English AONB (source
– Natural England MEOPL data and gis table)
Figure 1 - Live (Jan 2021) Environmental Stewardship and Countryside Stewardship Agreements English AONB (source –
Natural England open data gis table)
Wye Valley AONB State of the AONB Report 2021 Page 12 of 60Veteran Trees
Figure 2 - Recorded Veteran Tree locations (Source – AONB/Woodland Trust/Parkland data gis layers)
The AONB have a number of different data sets for Veteran Trees, which are amalgamated on figure 2 above.
AONB surveys carried out by volunteers and ecological survey trainees from 2005 to 2007 recorded 2,273
trees in and directly adjacent to the AONB, the breakdown of species can be seen in table 13 below. Parkland
data (date unknown) also records 201 trees in the Herefordshire Part of the AONB (table 15), and Woodland
Trust records (table 14) derived from a number of projects and individuals including some (but not all) AONB
records, show 2,346 trees across the AONB. All three surveys were undertaken in isolation and have all added
to the record of veteran trees. Each survey has picked up new records, but it is certain that some records are
duplicated by more than one survey, and difficult to tell which ones without revisiting each record on the
ground. For this reason, we can say that at the time of surveying there were at least 2,350 veteran trees in the
Wye Valley AONB.
Species number % Recorded variations
oak 1,075 47.3% common oak (91), English Oak (1), pedunculate oak (287), sessile oak (119), Turkey
oak (2)
beech 243 10.7% common beech (2), copper beech (9)
ash 160 7% common ash (2)
lime 133 5.9% common lime (6), large leaved lime (2), broad leaved lime (4), small leaved lime (58)
willow 129 5.7% Crack Willow (32), Cricket Bat Willow (1), White Willow (3), Goat Willow (6)
redwood 68 3% coast redwood (1), Wellingtonia (41), giant sequoia (24), sequioa (1)
sweet chestnut 59 2.6%
sycamore 57 2.5%
Wye Valley AONB State of the AONB Report 2021 Page 13 of 60maple 53 2.3% field maple (51), norway maple (1)
horse chestnut 52 2.3%
yew 45 2% english yew (1)
unknown 37 1.6%
poplar 27 1.2% Black Poplar (16), hybrid black poplar (1), White poplar (1), lombardy poplar (1)
alder 21 0.9%
cherry 16 0.7% wild cherry (9)
hawthorn 16 0.7%
cedar 14 0.6% atlas cedar (1), cedar of lebannon (7), western red cedar (3)
birch 13 0.6% silver birch (11)
london plane 10 0.4%
hazel 8 0.4%
apple sp 7 0.3% crab apple (2), wild crab apple (1)
pine 6 0.3% corsican pine (2), Monteray Pine (1), Scots pine (1)
elm 5 0.2% Wych elm (2)
holly 5 0.2%
hornbeam 3 0.1%
pear 3 0.1% wild pear (1)
walnut 3 0.1%
cypress 1
elder 1
Mullberry 1
Robina 1
Tulip 1
2,273
Table 13 - Wye Valley AONB Veteran Tree Survey data
Species number % Recorded variations
oak 960 40.9% pedunculate oak (378), sessile oak (133), holm oak (1), turkey oak (3), hybrid sessile
and english oak (5)
beech 333 14.2% common beech (11), copper or purple beech (17)
lime 251 10.7% small leaved lime (126), large leaved lime (4), commono lime (17), broad leaved lime
var. lubra (1)
ash 185 7.9% Common Ash (3)
willow 96 4.1% goat willow or sallow (3), crack willow (21), cricket bat willow (1), white willow (4)
yew 65 2.8% Irish yew (1), common yew (41)
sycamore 57 2.4% verigated sycamore (1)
redwood 55 2.3% giant sequoia (54), coast redwood (1)
sweet chestnut 52 2.2%
horse chestnut 39 1.7% red horse chestnut (2)
maple 39 1.7% Norway maple (1), field maple (36)
unknown 33 1.4%
poplar 20 0.9% wild black poplar (14), lombardy poplar (1)
whitebeam 19 0.8% symonds yat whitebeam (1), herefordshire whitebeam (1), evans whitebeam (1),
doward whitebeam (1), common whitebeam (4), wild service tree (4)
birch 16 0.7% silver birch (8), downy birch (5)
Wye Valley AONB State of the AONB Report 2021 Page 14 of 60cheery 16 0.7% wild cherry (14)
Hazel 16 0.7%
alder 15 0.6% alder buckthorn (1)
cedar 15 0.6% atlas cedar (1), Cedar of Lebanon (7), western red cedar (3)
london plane 10 0.4%
pine 9 0.4% scots pine (2), maritime pine (1), monterey pine (1), corsican pine (3)
hawthorn 8 0.3% common hawthorn (3)
pear 7 0.3% common pear (1), wild pear (2)
elm 6 0.3% wych elm (3)
holly 5 0.2%
apple 4 0.2% crab apple (3)
hornbeam 3 0.1% common hornbean (1)
walnut 3 0.1%
false acacia 2 0.1%
mullberry 2 0.1% black mulberry (1)
tulip tree 2 0.1%
cypress 1
european larch 1
spruse 1
2,346
Table 14 - Woodland Trust Veteran Tree Survey data (source – Ancient Tree Inventory GB & NI)
species number % Recorded variations
oak 105 52.2% pedunculate oak (64), evergreen oak (1), sessile oak (22), turkey oak (2)
beech 16 8%
unknown 12 6%
elm 8 4% English elm (4)
horse chestnut 8 4%
pine 8 4% scots pine (7)
sweet chestnut 8 4%
ash 7 3.5%
cedar of lebannon 6 3%
willow 6 3%
london plane 4 2%
sycamore 4 2%
pear 2 1%
conifer 1 0.5%
downy birch 1 0.5%
european larch 1 0.5%
lime 1 0.5%
spanish chestnut 1 0.5%
wellingtonia 1 0.5%
whitebeam 1 0.5%
201
Table 15 – Parkland data in AONB (source – gis table)
Wye Valley AONB State of the AONB Report 2021 Page 15 of 60All three sets of data paint a similar picture. Oak species make up more than 40% of veteran trees in the AONB. Beech species are second most populous in all surveys. Lime, Ash and Willow species are all found in good numbers, contributing around 20%. These figures help to highlight the importance of Ash to the landscape of the Wye Valley AONB, with at least 185 individual veteran Ash being recorded. The impact of ash-dieback has the potential to be great on this important feature of our landscape and ecology. A variety of species have been suggested as a replacement for Ash, but none can play host to as many species. Both Small and Large Leaved Lime are on the IUCN red list, on which they are noted as being of least concern but with decreasing populations. The number of recorded veteran lime in the Wye Valley AONB is therefore significant and needs to be safeguarded, along with younger specimens to help safeguard the future of the tree species. It is interesting to note a number of more unusual species in veteran tree statistics, indicating their presence in the landscape, although not in large quantities, for a substantial length of time. More than 50 sycamore, and nearly 70 redwood species have been recorded. Wye Valley AONB State of the AONB Report 2021 Page 16 of 60
Woodland Data
The most recent National Forest Inventory figures are from 2018 which establishes there are just over 9,002
ha of woodland across the whole AONB, equating to 27.5%. This is a slight increase from 27.35% in 2010. The
data shows the breakdown of woodland types as being 5,594.6 ha broadleaved, 1,994.2 ha conifer, 523.3 ha
mixed woodland, 263 ha Young Trees and the remaining 627.3 ha made up of a combination of felled, coppice,
bare ground, grassland, ground prep, shrubs, young trees, urban and assumed woodland. This can be seen
tabulated in table 17 below and mapped in figures 3 and 4.

Figure 3 - Wye Valley AONB Woodlands (source - National Forest Inventory 2018)

Wye Valley AONB State of the AONB Report 2021                                        Page 17 of 60
Key
Broadleaved woodland (Green)
Conifer woodland (Yellow)
Mixed woodland (Blue)
Other woodland (Grey)
Figure 4 – Woodland in the AONB by type (source – National Forest Inventory 2018)
National Forest Inventory woodland has been recorded in the same way since 2011 and gis files are
downloadable. When cut to the AONB boundary these provides us with useful data on both the total amount
of woodland in the AONB but also the breakdown of woodland type. National datasets have been cut manually
to the AONB boundary, meaning there may be slight variances in the size of woodland blocks which cross the
AONB boundary and have needed to be split individually for each year; this may account for any small
variances in annual figures. This can be seen in table 16 below (note: no statistics found for 2016).
Woodland Type (hectares)
Year Broadleaved Conifer Mixed Young Trees Other* Total
2011 5,584.9 2,168.5 521.2 225.1 454.3 8,954.0
2012 5,589.0 2,168.5 522.0 250.7 430.1 8,960.3
2013 5,592.0 2,166.2 526.2 257.7 436.9 8,979.1
2014 5,596.3 2,152.7 532.7 257.7 455.9 8,995.3
2015 5,604.3 2,142.8 525.5 257.7 457.1 8,987.4
2016 0.0
2017 5,608.7 2,117.4 525.4 257.7 494.1 9,003.3
2018 5,594.6 1,994.2 523.3 263.0 627.3 9,002.4
Table 16 - Wye Valley AONB woodland 2011 to 2018 (source - National Forest Inventory)
Wye Valley AONB State of the AONB Report 2021 Page 18 of 60It can be seen from the data that over the 7 year period the amount of woodland in the AONB has increase by
approximately 45ha. There has been a minimal increase in deciduous woodland cover of approximately 10ha.
Mixed woodland cover has remained almost unchanged. Changes in woodland composition can be seen when
looking at conifer woodland, young trees and ‘other’ woodland. Coniferous woodland has reduced in amount
by over 170ha and been replaced by the small deciduous woodland increase along with the amount of young
tree woodland cover rising by nearly 40ha and other woodland categories rising by over 160ha. It can be
assumed the change in composition is as a result of coniferous woodland felling and being replaced by new
planting, natural regeneration and ‘open space’ woodland.
Woodland cover in the AONB is high and the increase only slight since 2010, which makes demonstrating it in
map form difficult. Figure 5 below shows how the amount of woodland cover has increased from 2011 to
2018.
Figure 5 – Wye Valley AONB woodland cover (source - National Forest Inventory)
The following tables (17 to 23) show the breakdown of woodland type across the AONB according the National
Forest Inventory maps from 2011 to 2018.
Woodland Type AONB resource % of total % of AONB
2011 (ha) woodland
Broadleaved 5,584.9 62.4% 17.1%
Coniferous 2,168.5 24.2% 6.6%
Mixed 521.2 5.8% 1.6%
Young Trees 225.1 2.5% 0.8%
Other woodland types 454.3 5.1% 1.4%
TOTAL 8,954.0 27.35%
Table 17- Wye Valley AONB woodland 2011 (source - National Forest Inventory 2011)
Woodland Type AONB resource % of total % of AONB
2012 (ha) woodland
Broadleaved 5,589.0 62.4% 17.1%
Coniferous 2,168.5 24.2% 6.6%
Mixed 522.0 5.8% 1.6%
Young Trees 250.7 2.8% 0.8%
Other woodland types 430.1 4.8% 1.3%
TOTAL 8,960.3 27.37%
Table 18 - Wye Valley AONB woodland 2012 (source - National Forest Inventory 2012)
Wye Valley AONB State of the AONB Report 2021 Page 19 of 60Woodland Type AONB resource % of total % of AONB
2013 (ha) woodland
Broadleaved 5,592.0 62.3% 17.1%
Coniferous 2,166.2 24.1% 6.6%
Mixed 526.2 5.9% 1.6%
Young Trees 257.7 2.9% 0.8%
Other woodland types 436.9 4.9% 1.3%
TOTAL 8,979.1 27.43%
Table 19 - Wye Valley AONB woodland 2013 (source - National Forest Inventory 2013)
Woodland Type AONB resource % of total % of AONB
2014 (ha) woodland
Broadleaved 5,596.3 62.2% 17.1%
Coniferous 2,152.7 23.9% 6.6%
Mixed 532.7 5.9% 1.6%
Young Trees 257.7 2.9% 0.8%
Other woodland types 455.9 5.1% 1.4%
TOTAL 8,995.3 27.5%
Table 20 - Wye Valley AONB woodland 2014 (source - National Forest Inventory 2014)
Woodland Type AONB resource % of total % of AONB
2015 (ha) woodland
Broadleaved 5,604.3 62.4% 17.1%
Coniferous 2,142.8 23.8% 6.5%
Mixed 525.5 5.8% 1.6%
Young Trees 257.7 2.9% 0.8%
Other woodland types 457.1 5.1% 1.4%
TOTAL 8,987.4 27.46%
Table 21 - Wye Valley AONB woodland 2015 (source - National Forest Inventory 2015)
Woodland Type AONB resource % of total % of AONB
2017 (ha) woodland
Broadleaved 5,608.7 62.3% 17.1%
Coniferous 2,117.4 23.5% 6.5%
Mixed 525.4 5.8% 1.6%
Young Trees 257.7 2.9% 0.8%
Other woodland types 494.1 5.5% 1.5%
TOTAL 9,003.3 27.5%
Table 22 - Wye Valley AONB woodland 2017 (source - National Forest Inventory 2017)
Woodland Type AONB resource % of total % of AONB
2018 (ha) woodland
Broadleaved 5,594.6 62.2% 17.1%
Coniferous 1,994.2 22.2% 6.1%
Mixed 523.3 5.8% 1.6%
Young Trees 263 2.9% 0.8%
Other woodland types 627.3 7% 1.9%
TOTAL 9,002.4 27.5%
Table 23 – Wye Valley AONB woodland 2018 (source - National Forest Inventory 2018)
The tables above show a gradual increase in woodland cover across the AONB from 27.35% in 2010 to 27.5%
in 2014 and a constant level since. Broadleaved woodland consistently covers 17.1% of the AONB; Confer
woodland cover has fallen gradually from 6.6% of the protected landscape to 6.1% in 2018.
Wye Valley AONB State of the AONB Report 2021 Page 20 of 60Carbon Offsetting
The Forestry Commissions Creating New Woodland: Woodland Carbon Code (2017) publication establishes
that “A new native woodland can capture 300-400 tonnes of CO2 equivalent per hectare by year 50. By year
100, it can capture 400-600 CO2 equivalent per hectare”. The approximately 10ha increase in broadleaved
woodland cover, assuming it will be managed over the next 50 and 100 years, could capture 4,000 tonnes of
CO2 equivalent by 2070 and 6,000 tonnes by 2120. Using a carbon offsetting calculator as a rough guide, this
is crudely calculated to be equivalent to 645 single passenger return economy class flights from Cardiff to
Sydney by 2070 (at 6.2 t CO2 per return trip), or 1 trip per month (calculations made using carbon offset
calculator at www.myclimate.org). Alternatively, the carbon stored in this additional woodland is equivaled to
driving a mid-range petrol car (at 0.343t per 1,000km) over 11.5 million km by 2070.
Assuming the full 45 ha increase in woodland cover is accounted for by native broadleaved planting and
natural regeneration, the carbon offset of this increase in woodland cover is calculated to be equivalent to up
to 18,000 tonnes of carbon by 2070; a return flight from Cardiff to Sydney every 16 days or more than 52.5
million km in a mid-range petrol car (1,310 times around the world).
Woodland in Active Management
Forestry Commission England record levels of woodland in active management. In March 2020 the Forestry
Commission England Managed Woodland Headline Performance Indicator showed that in the Wye Valley
AONB there were 3,389ha of woodland in active management and 1,164ha of woodland currently unmanaged.
This indicates that 74% of woodland in the English part of the AONB is considered to be in active management.
This compares to 59% of woodlands across England being actively managed (source: Forestry Commission Key
Performance Indicators report for 2019-20).
Ancient Woodland
Data is available for Ancient Woodland in both Wales and England. The Woodland Trust website describes
Ancient Woodlands as areas of woodland that have persisted since 1600 in England and Wales. The definitions
used for the habitat type is subtly different on each side of the border, as can be seen in table 24 below.
Broadly speaking there are two categories of Ancient Woodland, Ancient Semi-natural Woodland (ASNW),
these are woodlands which have developed naturally and have had woodland cover for over 400 years, and
Plantation on ancient woodland, which are ancient woodlands that have been felled and replanted with non-
native species; these sites often retain ancient woodland soils and woodland species. We can use these figures
to establish that within the AONB there are 6,684.72ha of Ancient Woodland covering 20.42% of the protected
landscape, of which 2,795.26 ha (8.54% of the AONB) is Ancient Semi Natural woodland.
Area in hectares
Ancient Semi- Restored Plantation on Unknown Total
Natural (ASNW) Ancient Ancient Woodland Category
Site (PAWS)
England 1,432.37 1,959.21 3,391.58
Wales 1,362.89 652.29 1,153.89 124.07 3,293.14
Total 2,795.26 652.29 3,113.1 124.07 6,684.72
Table 24 – Wye Valley AONB Ancient Woodland (source – Natural England (2020) & NRW (2011) gis layers)
Natural England and NRW gis tables show that across England and Wales there is 459,708 ha of ancient
woodland. The amount of each resource within the Wye Valley AONB is show in table 25 below.
England Wales
Ancient ASNW PAWS England ASNW PAWS Restored Unknown Wales Eng & Wal
Woodland type Total Ancient category Total total
National Total 214,667 150,100 364,767 41,787 25,749 21,962 5,444 94,941 459,708
Wye Valley AONB State of the AONB Report 2021 Page 21 of 60Wye Valley AONB 0.67% 1.31% 0.93% 3.26% 4.48% 2.97% 2.28% 3.47% 1.45% as % of national resource Table 25 – Ancient woodland total for England and Wales, and Wye Valley AONB Ancient Woodland as a percentage (source – Natural England (2020) & NRW (2011) gis layers) Figure 6 – Ancient Woodland in the Wye Valley AONB (source – Natural England (2020) & NRW (2011) gis layers) Traditional Orchards Analysis of the most recent 2020 gis data download for Orchards shows there are 158.9ha of Orchard in the English part of the AONB and 63.7ha of Orchard on the Welsh side of the border. This figure for England differs slightly from the 154.05 given as part of the MEOPL Priority Habitat data in 2017. Within the Monmouthshire part of the AONB there are 63.7ha of Traditional Orchards. The Natural Resources Wales report Traditional Orchard Habitat Inventory of Wales establishes there are 1,037.3ha of traditional orchard in Wales (including marginal sites), of which 452.4ha are found in Monmouthshire. This data shows Wye Valley AONB State of the AONB Report 2021 Page 22 of 60
us that the Wye Valley AONB (Wales only) has 6.1% of the nations traditional orchards in only 0.57% of the
land area.

The data shows us there are 222.6ha for Orchards across the whole AONB, equivalent to 0.68% of the
landscape.

Figure 7 – Orchards Wye Valley AONB (source – Open Source gis downloads)

This orchard data can be added to the Priority Woodland data to give a representation of tree cover across
the AONB, as seen in table 26 below.

                     Woodland       Orchard cover        Total tree    % AONB cover
                    cover 2018           2020              cover
 Total (ha)           9,002.4            222.6             9,227           28.19%
Table 26 – Woodland cover in the Wye Valley AONB, including orchards

Wye Valley AONB State of the AONB Report 2021                                         Page 23 of 60
You can also read