STATE OF THE NORDIC REGION 2018
THEME 1: DEMOGRAPHY
←
→
Page content transcription
If your browser does not render page correctly, please read the page content below
STATE OF THE NORDIC REGION 2018 THEME 1: DEMOGRAPHY

State of the Nordic Region 2018
Theme 1: Demography
Julien Grunfelder, Linus Rispling and Gustaf Norlén (eds.)

Nord 2018:002
ISBN 978-92-893-5472-1 (PRINT)
ISBN 978-92-893-5474-5 (PDF)
ISBN 978-92-893-5473-8 (EPUB)
http://dx.doi.org/10.6027/NORD2018-001

© Nordic Council of Ministers 2018

Layout: Louise Jeppesen and Gitte Wejnold
Linguistic editing: Chris Smith
Cover Photo: unsplash.com
Photos: unsplash.com, except photo on page 22 by Johner Bildbyrå

Nordic co-operation
Nordic co-operation is one of the world’s most extensive forms of regional collaboration,
involving Denmark, Finland, Iceland, Norway, Sweden, the Faroe Islands, Greenland, and Åland.

Nordic co-operation has firm traditions in politics, the economy, and culture. It plays
an important role in European and international collaboration, and aims at creating
a strong Nordic community in a strong Europe.

Nordic co-operation seeks to safeguard Nordic and regional interests and principles in
the global community. Shared Nordic values help the region solidify its position as one
of the world’s most innovative and competitive.

Nordic Council of Ministers
Nordens Hus
Ved Stranden 18
DK-1061 Copenhagen K
www.norden.org

Download Nordic publications at www.norden.org/nordpub
STATE OF THE NORDIC REGION 2018
THEME 1: DEMOGRAPHY
Julien Grunfelder, Linus Rispling and Gustaf Norlén (eds.)
COUNTRY CODES FOR FIGURES

AX                                      Åland
DK                                      Denmark
FI                                      Finland
FO                                      Faroe Islands
GL                                      Greenland
IS                                      Iceland
NO                                      Norway
SE                                      Sweden

EU                                      The European Union
EU28                                    The 28 European Union member states

OTHERS

b                                       billion
BSR                                     Baltic Sea Region
EFTA                                    European Free Trade Agreement
EII                                     Eco-Innovation Index
Eco-IS                                  Eco-Innovation Scoreboard
ESPON                                   European Observation Network for Territorial Development and Cohesion
FDI                                     Foreign Direct Investments
FTE                                     Full-time equivalent
GDHI                                    Gross disposable household income
GDP                                     Gross Domestic Product
GRP                                     Gross Regional Product
GWh                                     Gigawatt hour
ICT                                     Information and communication technology
ISCED                                   International Standard Classification of Education
ISO                                     International Organization for Standardization
ITQ                                     Individual Transferable Quotas
Ktoe                                    Kilotonnes of oil equivalent
LAU                                     Local Administrative Unit
LFS                                     Labour Force Survey
m                                       million
NACE                                    Statistical classification of economic activities in the European Community
NCD                                     Non-Communicable Diseases
NGA                                     Next Generation Access
NSI                                     National Statistical Insitute
NUTS                                    Nomenclature of Territorial Units for Statistic
OECD                                    Organisation for Economic Co-operation and Development
PPP                                     Purchasing Power Parity
R&D                                     Research & Development
RIS                                     Regional Innovation Scoreboard
SCB                                     Statistics Sweden
SDG                                     Sustainable Development Goals
SPI                                     Social Progress Index
TWh                                     Terawatt hour
UN                                      United Nations
USD                                     United States dollar
WWF                                     World Wildlife Fund

4     STATE OF THE NORDIC REGION 2018
Contents

 09   Preface      A look behind the scenes of the Nordic model

 11                INTRODUCTION
 12   Chapter 1    Introduction

 23   THEME 1      DEMOGRAPHY
 24   Chapter 2    Population growth and ageing: Past, present and future trends
 36   Chapter 3    Urbanisation: Nordic geographies of urbanisation
 48   Chapter 4    Migration: The wary welcome of newcomers to the Nordic Region

 61   THEME 2      LABOUR FORCE
 62   Chapter 5    Employment: Labour force participation
                   and productivity of Nordic labour markets
 74   Chapter 6    Towards inclusive Nordic labour markets
 88   Chapter 7    Education in an evolving economic landscape

101   THEME 3      ECONOMY
102   Chapter 8    Economic development: The Nordic Region still performing
                   well in relation to the EU
118   Chapter 9    The Nordics: Europe’s hotbed of innovation
132   Chapter 10   Foreign direct investment: Trends and patterns of FDI inflows

145   THEME 4      FOCUS CHAPTERS
146   Chapter 11   The rapidly developing Nordic bioeconomy
160   Chapter 12   Digitalisation for a more inclusive Nordic Region
170   Chapter 13   Health and welfare: We continue to live longer, but inequalities
                   in health and wellbeing are increasing
184   Chapter 14   Culture and arts: An essential area for Nordic co-operation

195   THEME 5      REGIONAL POTENTIAL INDEX
196   Chapter 15   Nordregio Regional Potential index: Measuring regional potential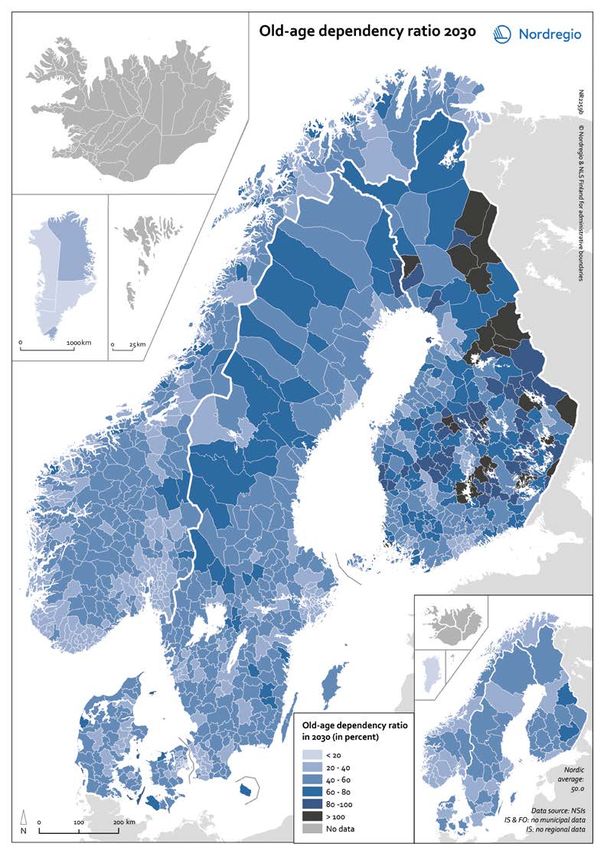
6 STATE OF THE NORDIC REGION 2018
Acknowledgements

The concept for the State of the Nordic Region           cation activities have been overseen by Michael
report has been developed by a Nordic working            Funch from Nordregio and André H. Jamholt from
group chaired by Kjell Nilsson, Director of Nordregio,   the Nordic Council of Ministers’ Secretariat.
the Nordic Council of Ministers’ research institution        In addition to the authors from Nordregio and
for regional development and planning. The Secre-        the NCM Secretariat, Lina Broberg, Erik Peurell and
tariat of the Nordic Council of Ministers (NCM) was      Karolina Windell from the Nordic Agency for Cul-
represented by the following: Geir Oddsson (co-          tural Policy Analysis should be acknowledged for
author of chapter 11 on Bioeconomy), Lise Østby,         writing the chapter 14 on Culture and Arts and Nina
Monika Mörtberg Backlund, Morten Friis Møller            Rehn-Mendoza from the Nordic Welfare Centre for
(co-author of chapter 12 on Digitalisation), Per         co-authoring chapter 13 on Health and Welfare.
Lundgren, Torfi Jóhannesson (co-author of chap-          Finally, a number of reviewers have contributed to
ter 11 on Bioeconomy), Ulla Agerskov and Ulf             the development of several chapters: Eva Rytter
Andreasson.                                              Sunesen and Tine Jeppesen from Copenhagen Eco-
    Nordregio acted as project owner and was             nomics (chapter 10 on Foreign Direct Investments),
financially responsible through Julien Grunfelder,       John Bryden (chapter 11 on Bioeconomy) and Moa
who together with his colleagues Linus Rispling and      Tunström from Nordregio and Eva Englund from
Gustaf Norlén coordinated with authors from              the Nordic Council of Ministers’ secretariat (chap-
Nordregio and other NCM institutions. Communi-           ter 14 on Culture and Arts).
8 STATE OF THE NORDIC REGION 2018
Preface
A LOOK BEHIND THE SCENES
OF THE NORDIC MODEL

The Nordic Region as such comprises the 12th larg-      The Nordic Council of Ministers has contributed
est economy in the world, with a population that is     with Nordic statistics for more than 50 years
growing faster than the EU average, a labour mar-       through e.g. the Nordic Statistical Yearbook, and
ket that receives global praise and a welfare system    Nordregio – our research institution for regional
that has proved resilient both in times of boom and     development and planning – has published regional
bust.                                                   statistics since its establishment in 1997.
    But the countries of Denmark, Finland, Iceland,         Now we are gearing up even more with a newly
Norway and Sweden along with Greenland, the             established Analytical and Statistical Unit at the
Faroe Islands and Åland also make out a macro-          Nordic Council of Ministers. In the same spirit, two
region of very different internal regions, both geo-    other Nordic actors – the Nordic Welfare Centre and
graphically and administratively.                       Nordic Agency for Cultural Policy Analysis – have
    It is an area spanning from the endless acres of    contributed along with Nordregio to the current
farmland in Denmark and the vast forests in Swe-        edition of the State of the Nordic Region, which is
den, over the thousand lakes of Finland and the         now published as a joint venture for the entire Nor-
mythical fjords of Norway to the Arctic splendour of    dic Council of Ministers’ network.
Iceland and Greenland. Indeed, even the island com-         By mapping and documenting information
munities of the Faroe Islands and Åland have their      about the state of the Nordic region(s), Nordregio
own characteristics, both when it comes to nature       provides a very important knowledge base that
and culture, economy and population.                    empowers local, regional and national authorities in
    The Nordics often are at the top of the list when   the Nordic countries to make informed decisions.
the UN or other international bodies rank nations on    Solid documentation of development trends is a
various parameters. And despite some bumps on           necessary starting point for developing good policy.
the road, we are also rated as some of the most             At the same time, the State of the Nordic Region
suited to fulfill the aim of the 2030 Agenda to reach   2018 is also a treasure trove of information for the
the UN Sustainable Development Goals.                   Nordic population at large, as well as a must read
    In fact, a recent publication from the Nordic       for international actors who want to learn about
Council of Ministers point to the almost unlikely       the Nordics and maybe even get inspired by the
success of the Nordic region in a global perspective.   Nordic model, however differently it may be played
But what is the picture behind the national figures     out in the various regions and areas.
and how do the various regions within the Nordic            I hope the many interesting facts, figures and
countries interact, both internally and across bor-     stories embodied in this impressive work will find a
ders?                                                   large audience and reach high and wide, just as the
    That question is addressed by this publication,     Nordic countries themselves seem to be doing.
the State of the Nordic Region 2018 that gives a
unique look behind the scenes of the world’s most       Dagfinn Høybråten
integrated region.                                      The Secretary General,
                                                        Nordic Council of Ministers

                                                                                                 PREFACE 9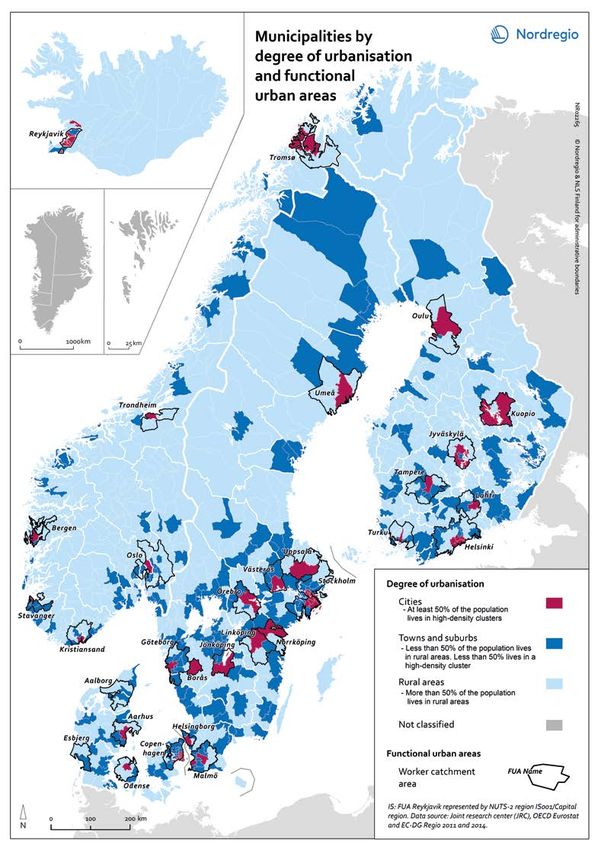
10 STATE OF THE NORDIC REGION 2018
INTRODUCTION

               PREFACE 11
Chapter 1
INTRODUCTION
Author: Kjell Nilsson
Map and data: Julien Grunfelder
Background also contribute to the strengthening of Nordic influ-
ence and competitiveness within Europe as well as
Since 1981, Nordregio and its predecessor organi- globally.
sations have produced the report State of the Nor- Given its focus on scale, State of the Nordic Re-
dic Region. The report is published every two years, gion builds on the collection and use of Nordic sta-
describing ongoing developments over time in the tistics at the local and regional levels. The advantage
Nordic Region at the municipal and regional levels. of following an administrative division is that it co-
This report is the 15th volume in the series “Regional incides with political responsibilities and thus be-
Development in the Nordic countries”, which has comes more relevant to politicians and other deci-
supplied policymakers and practitioners with com- sion-makers for whom access to comparable and
prehensive data and analyses on Nordic regional reliable statistical information is vital. The report
development for many years. itself should not however be viewed as being politi-
The report is based on the latest statistics on cally guided or seen as containing political pointers
demographic change, labour markets, education, or recommendations. Maintaining integrity and in-
economic development, etc. The analyses are based dependence is important for the credibility and, ul-
on a broad range of indicators covering the above- timately, for how the State of the Nordic Region is
mentioned areas. Since 2016, State of the Nordic received and used. When the inclusion of an interna-
Region has also included a Regional Development tional benchmarking approach makes sense, the
Potential Index which highlights the strengths and Nordic-focused material is supplemented with sta-
weaknesses of the 74 Nordic regions in relation to tistics and maps addressing the pan-European
one another and identifies the regions with the level.
strongest development potentials. The maps con- The concept of State of the Nordic Region can be
tained within the report can also be accessed through both scaled up and down. An example of the former
Nordregio's online map gallery, and NordMap, an is the ESPON BSR-TeMo project (2014) and its fol-
interactive map tool dealing with demographic, low-up TeMoRi (Rispling & Grunfelder, 2016), con-
labour market and accessibility issues in the Nordic
countries.
From 2018, publication of State of the Nordic
Region has been directly overseen by the Nordic
Council of Ministers centrally. The ambition here is The Nordic Region consists
to make the report a flagship project for the Nordic of Denmark, Finland, Iceland,
Council of Ministers, enhancing its analytical capac-
ity and its ability to collaborate across sectors and Norway and Sweden as well as
institutions. State of the Nordic Region strengthens Faroe Islands and Greenland
Nordic identity and community. It is deeply illustra-
tive thanks to its rich map material and is therefore (both part of the Kingdom of
suitable for the international marketing of the Nor-
Denmark) and Åland (part of
dic Region. Thanks to the Nordic Region’s strong
performance in international comparisons it can the Republic of Finland)
12 STATE OF THE NORDIC REGION 2018ducted by Nordregio on behalf of the Swedish Agency The average area of a Nordic region is 17,548 km².
for Economic and Regional Growth, with both pro- The smallest is Oslo (455 km²), followed by two Ice-
jects focusing on the development of a territorial landic regions, Suðurnes (884 km²) and Hövuðbor-
monitoring approach for the Baltic Sea Region garsvæði (1,106 km²). The largest region is Norrbot-
(ESPON, 2014; Rispling & Grunfelder, 2016). Exam- ten in Northern Sweden (106,211 km²), followed by
ples of scaling down include various assignments Lappi in Northern Finland (just under 100,000 km²).
that Nordregio has implemented for individual re- The average population density of a Nordic region
gions such as Jämtland, Värmland, and Lappi. The is 66 inhabitants per km² with densities ranging
potentials for extending the implementation of State from 1 inhab./km² (Austurland, Vestfirðir, Norður-
of the Nordic Region are therefore immense if aware- land vestra, and Norðurland eystra – all in Iceland)
ness increases due to its broader launch profile. to 1,469 inhab./km² (Oslo region). Other high-den-
sity regions include the Capital region of Denmark
Hovedstaden (706 inhab./km²) and Stockholm (335
The regional approach inhab./km²).
Among the Nordic countries Denmark, Finland
What is the Nordic Region? (including Åland) and Sweden, are Member States of
The Nordic Region consists of Denmark, Finland, Ice- the European Union (EU), although only Finland is
land, Norway and Sweden as well as Faroe Islands part of the Eurozone. Iceland and Norway are mem-
and Greenland (both part of the Kingdom of Den- bers of EFTA (European Free Trade Association)
mark) and Åland (part of the Republic of Finland). consisting of four countries, which either through
State of the Nordic Region is based on a suite of sta- EFTA, or bilaterally, have agreements with the EU to
tistics covering all Nordic municipalities and adminis- participate in its Internal Market. The Faroe Islands
trative regions. It is however worth noting here that and Greenland are not members of any of these eco-
several Nordic territories, e.g. Svalbard (Norway), nomic cooperation organisations. These differences
Christiansø (Denmark) and Northeast Greenland in supra-national affiliation have an impact on which
National Park (Avannaarsuani Tunumilu Nuna Allan- data that is available for this report. For example,
ngutsaaliugaq), are not part of the national admin- Eurostat, the statistical office of the EU, only pro-
istrative systems. Nevertheless, though not strictly vides data for EU, EFTA and EU candidate states,
included in the administrative systems, these territo- thus excluding the Faroe Islands and Greenland.
ries are included in the report where data is available. Whenever possible, data for these regions has been
State of the Nordic Region displays data using supplemented from other sources.
national, regional and municipal administrative divi- In the regular register data of Eurostat and the
sions (this edition according to the 2017 boundaries). National Statistics Institutes (NSIs), which are the
Large differences exist both in terms of the size and two prime data sources for this report, commuters to
population of the various administrative units at the neighbouring countries are not included in the Nordic
regional and municipal levels across the Nordic Re- countries. This results in incomplete information (i.e.
gion. The four largest municipalities are all Greenlan- underestimations) regarding employment, incomes
dic, with Qaasuitsup being the world’s largest munic- and salaries for regions and municipalities located
ipality with its 660,000 km² (however, split into two close to national borders, where a substantial share
municipalities in 2018). Even the smallest Greenlandic of the population commutes for work to the neigh-
municipality, Kujalleq, at 32,000 km² significantly bouring country. Estimates have been produced in
exceeds the largest Nordic municipalities outside some cases and included in this report. In 2016, the
Greenland, i.e. Kiruna and Jokkmokk in northern Swe- Finnish presidency of the Nordic Council of Ministers
den with approximately 20,000 km² each. Excluding launched a project to develop statistics on cross-bor-
Greenland and the Faroe Islands, the average size of der movement in the Nordic countries. There is how-
a Nordic municipality is 1,065 km². The smallest are ever still no up-to-date and no harmonised Nordic
less than 10 km² and are either insular municipalities cross-border statistical data available, other than
(e.g. Kvitsøy in Norway or Seltjarnarnes near Rey- that provided by some regional authorities.
kjavík) or within the greater capital areas (e.g. Sund-
byberg near Stockholm, Frederiksberg surrounded by Regional and administrative reforms
the municipality of Copenhagen, or Kauniainen sur- Administrative reforms provide a series of seem-
rounded by the municipality of Espoo near Helsinki). ingly never-ending stories across the Nordic politi-
INTRODUCTION 13cal systems. Today, the need for reforms and for the ities has voluntarily decreased from 452 to 311, but
reallocation of tasks between the national, regional the size of Finnish municipalities is still on average
and municipal levels can be derived from two major below 7,000 inhabitants. After failing with their
challenges facing the Nordic countries (Harbo, 2015). municipal reform, the government decided instead
Firstly, increased pressure on the Nordic welfare sys- to turn its attention to the regional level and to plan
tem caused by an ageing population which increases for a comprehensive expansion of the regions’
demand for public services while simultaneously responsibilities. The plan is for the 18 regions
shrinking the tax base. Secondly, enlargement of the (maakuntaliitto – landskapsförbund) to take over
regions due to widening labour markets caused by the main health care system from the municipali-
changing mobility and commuting patterns moves ties. They will also assume responsibility for regional
the functional borders of regions beyond their tra- development, e.g. business and transport policy. The
ditional administrative limitations. Finally, there is regions will have a directly elected political leader-
a common belief among professionals and decision ship, but the right to tax will remain with the munic-
makers that fewer and larger units are more effi- ipalities which will, however, lose more than half of
cient when it comes to service provision and public their budget (Sandberg, 2017).
administration. On the other hand, concerns remain Åland is not included in the above-mentioned
over the merging of administrative units especially administrative reform of the Finnish regions. There,
at the municipal level due to the increased distance responsibility for health care is already centralised
this potentially creates between citizens and the to the Government of Åland. Åland has 16 munici-
local political authority. palities, some of them with less than 500 inhabit-
Thus far, the Danish experience provides the best ants and one, Sottunga municipality, with even less
Nordic example of a completed reform process as it than 100. At the same time as several investigations
is now a decade since the process took place and into voluntary municipal mergers are in progress,
where the number of municipalities was reduced the current government is also preparing a bill to be
from 270 to 98. The reform as such was decided by introduced to the Åland Parliament, the Lagtinget,
the government, but the practical implementation, on reducing the number of municipalities to four.
i.e. which municipalities should merge, was dele- More than 50 years since the last municipal re-
gated to the municipalities themselves. At the same form, on 8 June 2017, the Norwegian parliament
time, 1 January 2007, the 13 counties (amt) were (Stortinget) decided on an administrative reform
abolished and replaced by five regions. The reform that reduces the number of regions (fylkeskom-
increased the political weight of the municipalities muner) from 18 to 11 and the number of municipali-
in society while the importance of the regions de- ties from 428 to 354. The basic goal of the reform,
creased. The regions are led by elected politicians, which should be fully implemented by 1 January
which reinforces their legitimacy, but they lack the 2020, is to transfer resources and responsibilities to
power to tax and the freedom to undertake tasks in local and regional authorities that are more robust
addition to their statutory responsibilities. In addi- than they are currently (Kaldager, 2015). In Norway,
tion to healthcare, which is the region’s main area of the health care system is organised by the state,
work, they are participating in regional public trans- while the regions are, among other things, responsi-
port companies and in the setting up of growth fo-
rums (which decide on the allocation of EU Struc-
tural Funds). Hence, there are no official regional
development plans except for the capital region, the
so-called Finger Plan, which is prepared by the state. Concerns remain over the
After having failed, for the second time since the
merging of administrative units
turn of the millennium, to try to implement a major
reform of the Finnish municipalities, the govern- especially at the municipal level
ment decided on 19 August 2015 that the municipal-
ities would no longer be required to investigate the
due to the increased distance
possibility of amalgamation (Sandberg, 2015). The this potentially creates between
government still wants to encourage municipal
mergers, but they should be done on an entirely vol-
citizens and the local political
untary basis. Since 2000, the number of municipal- authority
14 STATE OF THE NORDIC REGION 2018Figure 1.1 Urban rural typology of the Nordic regions.
INTRODUCTION 15The combined economy of ation has been put on the aganda (Traustadóttir,
2015). This idea is aimed at strengthening the local
the Nordic countries is the level through the decentralisation of tasks from the
12th largest in the world government, but without the merging of municipal-
ities.
The Faroe Islands and Greenland both sought to
reduce the number of municipalities through admin-
istrative reform processes. The Faroese reform pro-
ble for planning, transportation and regional devel- cess started in 2000 with a new piece of municipal
opment. The reform is based on the tasks that the legislation. The government wanted to encourage
regions currently have, but the government has ap- municipal mergers, but they should be done on an
pointed an expert group to review opportunities to entirely voluntary basis. Since 2000, the number of
strengthen the regions’ role as developer and their municipalities has voluntarily decreased from 49 to
capacity to provide better service to the citizens. 29. In a 2012 referendum on municipal mergers, the
The regions are led by directly elected politicians, majority in almost every municipality said no to more
they have a formal – but in practice no – right to tax mergers.
and they are free to undertake other than statutory By far the most radical change took place in
tasks. Greenland in 2009, where the administrative set up
In Sweden, the last municipal reform took place changed from 18 to four municipalities. The idea
in 1974 when the number was reduced from slightly behind the change which was supported by most of
more than 1,000 to 278. The latest merger of Swed- the political parties, was to delegate political deci-
ish municipalities took place in 1977. In the period sions and economic resources from the central ad-
since, the number has slightly increased to 290 due ministration to the municipalities (Hansen, 2015). In
to the dissipation of existing municipalities. Instead reality, only a few administrative areas have at least
of pushing further municipal mergers, the Swedish thus far been transferred, but major areas will be
government has instead focused on the regions in transferred to the municipalities in 2018 and 2019.
recent years. In March 2016, a committee presented Widespread dissatisfaction with the new municipal
a new map dividing Sweden into six new major re- structure especially in Qaasuitsup Kommunia, the
gions. The map raised such strong opposition how- largest municipality in the world in terms of square
ever that the government chose not to proceed with kilometres, led to a political decision to divide
the proposal. When the map turned out to be a Qaasuitsup Kommunia into two municipalities by
distortion of reality, instead of adjusting the map at 1 January 2018.
regional level, the government decided to change
the reality at local level. Thus, a new parliamentary NUTS classification
committee was set up to develop a strategy for Table 1.1 provides an overview of the administra-
strengthening the municipalities’ capacity, focusing tive structure in each country in the Nordic Region.
more on cooperation and the allocation and execu- These administrative structures are the basis for
tion of tasks than on administrative boundaries. the NUTS (Nomenclature of territorial units for sta-
In common with the Faroe Islands and Greenland, tistics) classification, a hierarchical system dividing
Iceland has only two administrative levels: national the states on the European continent into statisti-
and local. In recent times, Iceland has carried through cal units for research purposes. The NUTS and LAU
two large reform processes – in 1993 and again in (Local administrative units) classifications gen-
2005. On both occasions, consultative referendums erally follow the existing division but this may dif-
were held and on both occasions, a majority voted fer from country to country. For example, munici-
against the suggested mergers. Despite the out- palities are classified as LAU 1 in Denmark but as
comes of the referendums the reforms resulted in a LAU 2 in the other Nordic countries, and regions of
reduction in the number of municipalities from 196 primary importance within the national context as
in 1993 to 89 in 2006. In recent years, the number of NUTS 2 in Denmark but as NUTS 3 in Finland, Nor-
municipalities has been further reduced to 74 on a way and Sweden (figure 1.1).
voluntary basis though the government has, for its
part, decided not to push for further aggregations.
Instead, the idea of interregional municipal cooper-
16 STATE OF THE NORDIC REGION 2018NUTS 0 DK FI IS NO SE SNUTS FO GL
Regional Manner- Lands-
NUTS 1 Suomi/ Fasta del 3 SNUTS 1
Finland;
Ahvenanmaa/
Nomenclature level
Åland 2
NUTS 2 Region Suuralue; Lands- Riksom- SNUTS 2
5 Storområde 5 del 7 råde 8
Lands- Maakunta; Hag- Fylke 19 Län 21
NUTS 3 SNUTS 3
del 11 Landskap 19 skýrslu- (18)
svæði 2
Local Kom- Landsvædi Økono- Sýsla 6
mune 8 misk SNUTS 4
LAU 1
98 region
89
SNUTS 5
LAU 2 Sogn Kunta; Sveitar- Kom- Kom- Kom- Kom-
2165 Kommun félög 74 mune mune mune mune 4
311 426 290 30 (5)
(422)
Table 1.1 Administrative structures in the Nordic Region on 1 January 2017 (diverging number on 1 January 2018
in brackets).
1
Grey frames represent the regional levels presented in most regional maps in this report, comparable from a
Nordic perspective, while dark gray frames show the local units represented in the majority of our municipal level maps.
Data sources: NSIs, Eurostat, ESPON.
The Nordics in the world EU 2020 targets
The Europe 2020 strategy was designed in 2010
With its 3,425,804 km2, the total area of the Nor- with the aim of guiding the Member States through
dic Region would form the 7th largest nation in the the global financial crisis towards recovery. Three
world. However, uninhabitable icecaps and glaciers drivers of economic growth were identified as cru-
comprise about half of this area, mostly in Green- cial: (i) smart growth based on knowledge and
land. In January 2017, the Region had a population innovation, (ii) sustainable growth for a more effi-
of around 27 million people. More relevant is the cient, greener and competitive economy, and (iii)
fact that put together, the Nordic economy is the inclusive growth capable of delivering employment,
12th largest economy in the world (Haagensen et al., social and territorial cohesion.
2017). Targets to be achieved include increasing the
The power of the Nordic economy was acknowl- employment rate of the population aged 20–64
edged in the light of its general handling of the from 69% to 75%, investing at least 3% of the EU’s
economic crisis of 2007–08 (Wooldridge, 2013). GDP on research and development, reducing green-
What particularly impressed e.g. the journalists at house gas emissions by 20% compared to 1990, in-
the magazineThe Economist, that published a spe- creasing the share of renewable energy sources in
cial editoin on the Nordics, was the the ability of the final energy consumption to 20%, reducing the
Nordic countries to combine a generous tax-funded proportion of early school leavers from 15% to below
welfare system with efficient public administration 10%, ensuring that at least 40% of 30–34 years old
and a competitive business sector.
As such, the locational aspects of the Nordic
Region are noted in this edition of the State of the
Nordic Region, where relevant and when reliable The total area of the Nordic
data is available. In addition, European develop-
Region would form the 7th
ments generally and specifically those pertaining to
the EU level are also addressed. largest nation the world
INTRODUCTION 17Figure 1.2 Sustainable Development Goals.
should have completed tertiary or equivalent edu- 4. Ensure inclusive and quality education for all
cation and, finally, reducing poverty by lifting at and promote lifelong learning;
least 20 million people out of the risk of poverty or 5. Achieve gender equality and empower all
social exclusion. women and girls;
The European Commission expected that each 6. Ensure access to water and sanitation for all;
Member State would translate these targets into 7. Ensure access to affordable, reliable,
national targets and trajectories. According to Eu- sustainable and modern energy for all;
rostat’s headline indicators scoreboard only one 8. Promote inclusive and sustainable economic
target, i.e. the reduction of greenhouse gas emis- growth, employment and decent work for all;
sions, has thus far been reached. Two targets, those 9. Build resilient infrastructure, promote
regarding early school leavers and tertiary educa- sustainable industrialization and foster
tional attainment, are less than one percentage unit innovation;
from fulfilment. The target on reduced poverty is 10. Reduce inequality within and among countries;
also close to being attained, in 2015 18.5 million peo- 11. Make cities inclusive, safe, resilient and
ple have been lifted out of poverty since 2012. The sustainable;
employment rate had risen to 71% in 2016, but is still 12. Ensure sustainable consumption and
less than half way to the target while the R&D in- production patterns;
vestments are even further away from their speci- 13. Take urgent action to combat climate change
fied target. and its impacts;
14. Conserve and sustainably use the oceans,
UN Sustainable Development Goals seas and marine resources;
On 25 September 2015, the United Nations adopted 15. Sustainably manage forests, combat
Resolution A/RES/70/1 which contains 17 Sustain- desertification, halt and reverse land de-
able Development Goals (SDGs) with 169 targets gradation, halt biodiversity loss;
to be achieved over the next 15 years. The 17 goals 16. Promote just, peaceful and inclusive societies;
(figure 1.2) are: 17. Revitalize the global partnership for a
sustainable developmen.
1. End poverty in all its forms everywhere;
2. End hunger, achieve food security and The Nordic countries are performing well. In an
improved nutrition and promote sustainable overall assessment of OECD countries, Sweden is
agriculture; given the highest score followed by Denmark, Fin-
3. Ensure healthy lives and promote well-being land and Norway (Sachs et al., 2017). Nevertheless,
for all at all ages; the Nordic countries continue to face significant
18 STATE OF THE NORDIC REGION 2018challenges in terms of reaching all the identified Economy (chapters 8–10): Describes and analyses
targets by 2030. The Nordic Council of Ministers GDP, income levels, innovation capacity, research
has chosen goal number 12, to ”ensure sustainable and development and foreign direct investment
consumption and production patterns”, as its pri- (FDI).
oritised action field. But there are additional goals
where a certain amount of effort is still required, The second part consists of four thematic focus
such as the greening of the region’s agricultural areas. The chosen areas for the 2018 edition are:
systems (SDG 2), reducing the high levels of CO2
emissions per capita (SDG 7 and 13, and improving Bioeconomy (chapter 11): Focuses on land use and
ecosystem conservation (SDG 14 and 15) (Larsen & land ownership, forestry, biogas, fisheries and
Alslund-Lanthén, 2017). aquaculture.
Digitalisation (chapter 12): Focuses on the broad-
Further reading band coverage and use of Internet to interact with
the public sector.
The report consists of two parts; the first, consist-
ing of three thematic areas which have remained Health and welfare (chapter 13): Focuses on public
constant over the years of this publication (demog- health issues and the territorial dimensions of life
raphy, labour market and economy) and are sum- expectancy and accessibility to healthcare.
marised in the Regional Development Potential
Index (chapter 15). Culture and arts (chapter 14): Focuses on newly-
produced data at municipal and regional levels on
Demography (chapters 2–4): Describes and anal- cinemas, libraries and museums.
yses population development in terms of natural
increase or decline, migration, urbanisation and age
distribution.
Labour market (chapters 5–7). Describes and anal-
yses employment, unemployment and economical-
ly-inactive groups, especially among young people
and foreign born, as well as education.
INTRODUCTION 19References ESPON (2014). ESPON BSR-TeMo. Territorial Monitoring for the Baltic Sea Region. Final Report. Luxembourg: ESPON. Haagensen, K.M., Agerskov, U. & Vestergaard, T.A. (2017). Nordisk statistik 2017. Köpenhamn: Nordiska ministerrådet. https://doi.org/10.6027/ANP2017-747 Hansen, K.G. (2015). Greenland is rethinking the 2009 merging of municipalities (Nordregio News 2015:3). Stockholm: Nordregio. Harbo, L.G. (2015). A new wave of reforms sweeping over the Nordic countries (Nordregio News 2015:3). Stockholm: Nordregio. Kaldager, T. (2015). Norway: steps on the path to reforms (Nordregio News 2015:3). Stockholm: Nordregio. Larsen, M. & Alslund-Lanthén, E. (2017). Bumps on the road to 2030. Copenhagen: Nordic Council of Ministers. https://doi.org/10.6027/ANP2017-738 Rispling, L. & Grunfelder, J. (Eds.) (2016). Trends, challenges and potentials in the Baltic Sea Region. Stockholm: Swedish Agency for Economic and Regional Growth. Sachs, J., Schmidt-Traub, G., Kroll, C., Durand-Delacre, C. & Tekoscz, K. (2017). SDG Index and Dashboards Report 2017. New York: Bertelsmann Stiftung and Sustainable Development Solutions Network (SDSN). Sandberg, S. (2015). Why did the Finnish government reform of 2011 fail? (Nordregio News 2015:3). Nordregio: Stockholm. Sandberg, S. (2017). Regionen, kommunerna (och staten) i den regionala utvecklingspolitiken. En jämförelse av arbetsfördelning och erfarenheter i Danmark, Finland och Norge. In: Tynelius & Danell (eds.), Regionala tillväxtpolitiska utmaningar – behov av strukturreformer och nya samverkanslösningar. Östersund: Tillväxtanalys, pp. 27–37. Traustadóttir, S. (2015). Iceland leads the way (Nordregio News 2015:3). Stockholm: Nordregio. Wooldridge, A. (2013). The Nordic Light. The Economist, special report, 2 February 2013. 20 STATE OF THE NORDIC REGION 2018
PREFACE 21
22 STATE OF THE NORDIC REGION 2018
THEME 1
DEMOGRAPHY
The Nordic population: Increasingly urban, diverse and older
The current demographic situation in the Nordic and sparsely populated areas face population
Region is characterised by four main trends: decline and high rates of population ageing.
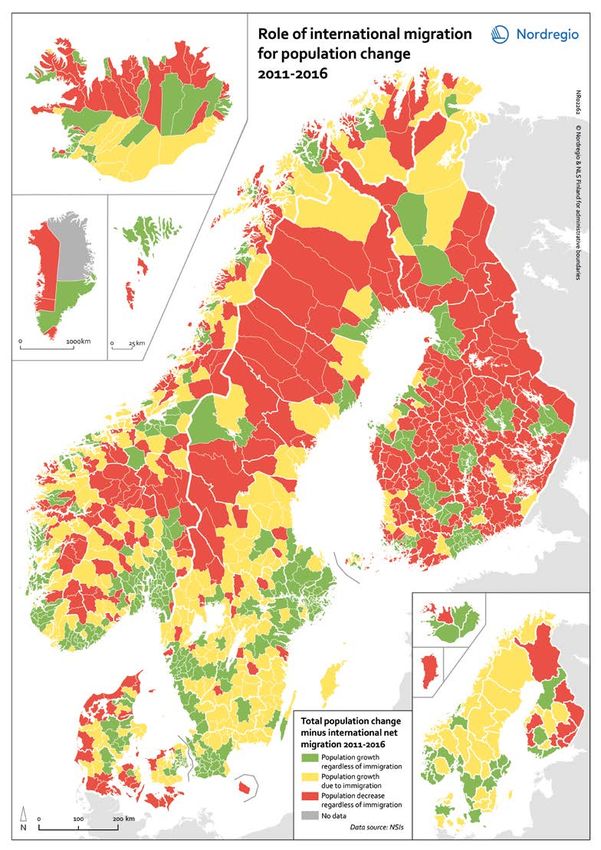
The Nordic population is growing, driven to a By 2030, large parts of northern and eastern
large extent by immigration, and is increasingly Finland, for example, are expected to have pop-
concentrated in urban settlements. The aver- ulations where more than 50% of people over
age age of the population is also increasing, 15 are aged 65 or more.
while a growing share of people have a foreign Around one in five people in the Nordic Region
background. All of these trends are expected to live in the five largest urban areas. Between
continue in the years to come. 2011 and 2016, growth in urban settlements has
By 2030, the Nordic Region is expected to been around 9% in Norway and Sweden, while
have almost 30 million inhabitants, an increase Denmark, Finland and Iceland register around
of more than 10% from the current 26 million. In half that rate. Immigration accounts for a large
Sweden, almost 80% of the population increase part of this increase. Indeed, roughly 26% of all
is expected to occur in the densely populated Nordic municipalities increased their population
urban areas in the south of the country. In the between 2011 and 2016 only due to international
other Nordic countries, population growth migration.
remains more decentralised and in many cases As of 2017, one in eight Nordic residents were
medium-sized towns may grow faster than identified as having been born abroad, either
capital areas. in another Nordic country or outside the Nordic
Over the past ten years, the population of the Region. Rural municipalities are increasingly
Nordic Region has grown quicker but also aged recognising the important contribution that
faster as a whole than in many other European immigrants can make to their communities.
regions. This process does not however affect Most migrants however still choose to live in
all Nordic regions and municipalities in equal the large urban settlements. As such, questions
measure. As the following chapters show, Nordic relating to how best the integration of refugees
municipalities and regions experience very dif- and other newcomers can be facilitated have
ferent, often contrasting, demographic trends, gained increasing in relevance in the after-
presenting specific opportunities and challenges math of the European ‘refugee crisis’ and will
to each: Population growth is largely concen- undoubtedly remain of central concern in the
trated in the urban areas while many remote years to come.
PREFACE 23Chapter 2
POPULATION GROWTH
AND AGEING
Past, present and future trends
Author: Nora Sánchez Gassen
Maps and data: Julien Grunfelder and Nora Sánchez Gassen
The demographic situation in Europe is character- mainly driven by migration. Iceland is the exception
ised by two main trends, population growth and here, as natural increase – a surplus of births over
ageing. Since 2007, the population of the Euro- the number of deaths – was the major source of
pean Union has increased slowly from 500 million population growth. Population decline occurred only
to 512 million people (Eurostat, 2017a). The old-age in Greenland. This decline was exclusively due to out-
dependency ratio, defined as the size of age groups migration. Natural population growth in Greenland
65 and older as a share of the working-age popula- remained positive during the last decade, in other
tion between 15 and 64 years, increased from 25.2% words, more people were born than died. Without
to 29.3% (Eurostat, 2017b). Thus, there are now 3.4 migration, the population of Greenland would thus
persons of working age for every person aged 65 have increased as well. The Faroe Islands also lost
and older in the European Union. Both trends have population due to net outmigration, but high natu-
been particularly pronounced in the Nordic Region. ral increase more than offset this loss.
Here, the old-age dependency ratio has increased While population increases have occurred in all
faster and population growth has been stronger Nordic regions except Greenland in recent years,
than in many other European countries. Migration growth rates varied strongly across municipalities.
has been the major source of population increase. As shown in Chapter 3, most of the population
These general trends however mask considerable growth in the Nordic Region has occurred in and
variation within and across the Nordic countries. around the largest cities such as Stockholm, Goth-
Municipalities and regions face diverse demo- enburg, Copenhagen, Helsinki, Reykjavík and Oslo.
graphic challenges with each, potentially, requir- Many inland municipalities with smaller populations
ing tailor-made policy responses. In the following have declined in size, particularly in Finland, Sweden
sections, the current and expected future trends in and Norway. While the general trend in the Nordic
population growth or decline and population age- countries thus seems to be one of urbanisation, in-
ing will be described, from both a regional and a teresting nuances can be seen when comparing ur-
municipal perspective. ban settlements within municipalities: For instance,
even in growing municipalities, e.g. in the Stockholm
Diverse levels of population growth area, some urban settlements have declined in size
In 2007, almost 25 million persons lived in the Nor- over the past five years. Conversely, in some munic-
dic Region. The number of inhabitants ranged from ipalities with declining populations, urban settle-
27,000 in Åland to 9.1 million in Sweden (table 2.1). ments may still have been growing. Visby in Gotland,
Between 2007 and 2017, the population of the Nordic and Skellefteå in Västerbotten in Sweden are cases
Region increased, but this growth was unevenly dis- in point here.
tributed: In Denmark, Finland, Sweden, Norway, Ice-
land and Åland, population increases have occurred,
24 STATE OF THE NORDIC REGION 2018Total population size Population change, 2007-2017
(in percentage)
2007 2017 Total Natural Net
increase migration
Nordic Region 24,931,018 26,949,609 8.1 2.3 5.8
Denmark 5,447,084 5,748,769 5.5 1.3 4.2
Finland 5,250,032 5,474,083 4.3 1.4 2.9
Sweden 9,113,257 9,995,153 9.7 2.4 7.2
Iceland 307,672 338,349 10.0 8.0 2.0
Norway 4,681,134 5,258,317 12.3 4.0 8.4
Faroe Islands 48,268 49,864 3.3 5.3 -1.9
Greenland 56,648 55,860 -1.4* 6.6* -7.5*
Åland 26,923 29,214 8.5 0.6 7.8
Table 2.1 Population change, 2007–2017.
* Natural increase and net migration values do not add up to the total population change (in %) shown here. This is due
to a correction term that Statistics Greenland uses in updating its statistics (not included in the table).
Data source: Eurostat and NSIs.
Strong population growth predicted for The NSI of Greenland expects the population to
urban centres until 2030 shrink by 0.2% to 0.3% in each projection year. This
NSIs expect that the population of the Nordic would translate into a loss of more than 1,800 in-
Region will continue to grow up to 2030. Again, habitants and a decline in the total population from
however, this regional trend hides interesting dif- 55,900 (2017) to around 54,000 (2030). The Faro-
ferences between countries and municipalities. ese population is projected to increase until 2029
NSIs in Denmark, Finland, Åland, Sweden, Iceland when it will reach 50,900 inhabitants. By 2030,
and Norway expect their populations to grow until however, population decline is expected to set in.
2030 (figure 2.1). In Iceland, the population is ini- It is important to note that the projections pub-
tially expected to increase more strongly than in lished by the NSIs differ in terms of the projection
any other part of the Nordic Region. In the 2020s, periods they cover and the number of scenarios they
growth rates are expected to decline and approach use. They also make different assumptions about
those of Åland, Norway and Sweden. In the latter how fertility rates, mortality rates and migration
three, annual population growth rates are expected numbers will develop in the future. These differences
to range between 0.6% and 1.1% throughout the must be kept in mind when comparing projection
projection period. Given these growth rates, pop- results across the Nordic Region. They influence the
ulation sizes will increase from 338,300 (2017) to projection results that we present in figure 2.1 and in
400,000 (2030) in Iceland. The populations in Nor- the other figures contained in this chapter. The online
way and Sweden will reach around 5.9 million per- appendix for this chapter provides more detailed in-
sons and 11.3 million persons respectively, in 2030, formation on the projections for each Nordic region.
while Åland will have around 32,700 inhabitants. While all Nordic regions apart from Greenland
The NSIs in Denmark and Finland also expect their are expected to have larger populations in 2030,
populations to grow up to 2030, but annual growth figure 2.2 shows that this growth will continue to be
rates are projected to remain between 0.2% and skewed towards urban areas. This is particularly
0.6%. Finland will have 5.7 million inhabitants in visible in Sweden, where population growth rates of
2030 (up from 5.5 million in 2017) while the Danish 10% or more are expected for Stockholm and its
population will be 6.1 million persons. surrounding municipalities, the area around Lund,
Population dynamics in Greenland and the Faroe Malmö and Helsingborg as well as Växjö and Goth-
Islands are expected to follow a different pattern. enburg/Kungsbacka. 80% of the population increase
THEME 1 DEMOGRAPHY 25Figure 2.1 Projected annual population growth in the Nordic Region, 2017–2030.
%)
2,1
1,6
1,1
0,6
0,1
-0,4
2018 2020 2022 2024 2026 2028 2030
Projection years
DK FI FO GL IS NO SE AX
Source: NSIs.
is expected to occur in the densely populated south This is particularly visible in
of the country, with Umeå as the only exception in the
North. The large majority of other municipalities in Sweden, where population
the northern part of the country will experience pop-
growth rates of 10% or more are
ulation decline. A similar pattern applies in Green-
land, where moderate population gains are only ex- expected for Stockholm and its
pected in the municipality of Semersooq which hosts
the city Nuuk. In Finland, Norway and Denmark,
surrounding municipalities
population growth is somewhat more dispersed. In
Norway, for instance, high rates of growth are ex- Horsens, though other areas of Sjaelland, Fyn and
pected in Oslo and its surrounding municipalities, Jylland are also expected to see growing numbers of
Bergen, Stavanger, Kristiansand and Trondheim, but residents. Many rural and less populated areas in
also in some more remote municipalities such as Denmark, Norway and Finland are expected to lose
Hammerfest and Bardu. The municipalities that to- inhabitants up to 2030. Overall, the municipal popu-
gether contribute 80% of Norway’s total population lation projections for the Nordic Region suggest that
increase are also somewhat more spread out than in the ongoing process of urbanisation will continue
Sweden. In Denmark, the strongest population apace.
growth is projected for Copenhagen, Aarhus and
26 STATE OF THE NORDIC REGION 2018Figure 2.2 Population change 2017–2030.
THEME 1 DEMOGRAPHY 27Figure 2.3 Population structure by major age groups, 2007 and 2017.
Size of age groups (in %)
0–14 years 15–64 years 65–79 years 80+ years
2007
2017
2007
2017
2007
2017
2007
2017
2007
2017
2007
2017
2007
2017
2007
2017
0% 20% 40% 60% 80% 100%
DK FI IS NO SE AX FO GL
Source: NSIs.
Population structure shifts to these two age groups only make up 8.1% of the pop-
higher ages in the Nordic Region ulation, though this share is also higher than it was
in 2007. The young population structure in Greenland
is not only due to comparatively high fertility rates,
In addition to changes in their population size, pop- but also to lower levels of life expectancy than in the
ulations in all Nordic regions have aged over the other Nordic regions. The other countries or regions
past decade: The proportion of elderly persons in lie in the middle of the spectrum, with proportions of
the population has increased while the proportion older people (combined age groups 65–79 years and
of young people and those in the working-age pop- 80+ years) ranging from 14.0% in Iceland to 20.9% in
ulation has either remained constant or declined. Finland in 2017. The increase in the proportion of
Figure 2.3 shows the size of major age groups older people is primarily driven by the population
within each country or region, and how age distribu- aged 65 to 79 years. The proportion of persons aged
tions have changed between 2007 and 2017. The 80 years and older – often referred to as the old-
population in Åland has the oldest age structure in est-old – increased only slowly or even declined in
the Nordic Region, with persons in the two oldest most Nordic regions between 2007 and 2017. This
age groups – 65 to 79 years and 80 years and older stands in contrast to other countries in Europe,
– together accounting for 16.9% (2007) and now where the oldest-old population generally increased
21.1% (2017) of the total population. In Greenland, more strongly. The increase in the proportion of
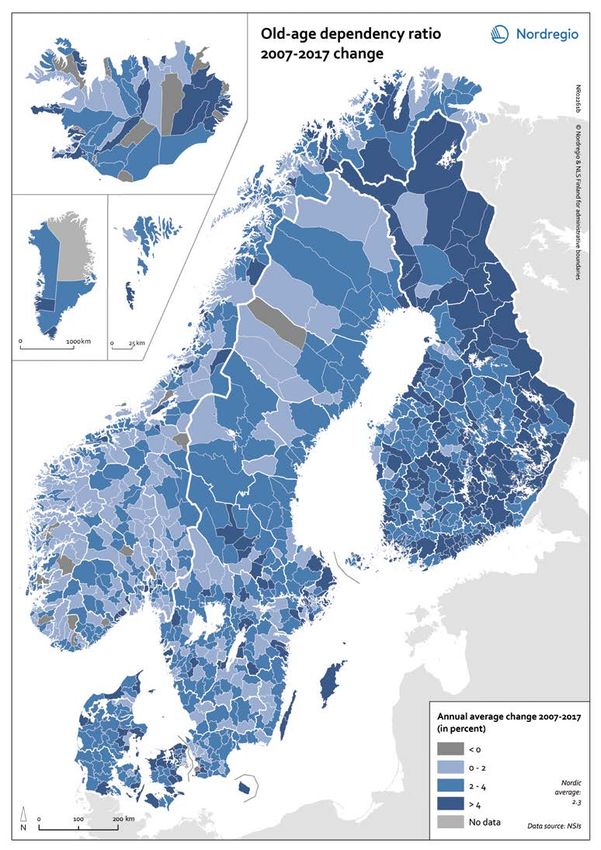
28 STATE OF THE NORDIC REGION 2018Figure 2.4 Old-age dependency ratio change 2007–2017: The number of elderly people at an age when they are generally
economically inactive (i.e. aged 65 and over), compared to the number of people of working age (i.e. 15–64 years old).
THEME 1 DEMOGRAPHY 29Figure 2.5 Population structure by major age groups, 2017, and projection results for 2030.
Size of age groups (in %)
0–14 years 15–64 years 65–79 years 80+ years
2017
2030
2017
2030
2017
2030
2017
2030
2017
2030
2017
2030
2017
2030
2017
2030
0% 20% 40% 60% 80% 100%
DK FI IS NO SE AX FO GL
Source: NSIs.
older people has come at the expense of the young these urban centres for education and work (Hansen
(0–14 years) and working age populations (15–64 & al., 2011). Smaller urban and rural municipalities in
years). The proportional size of these two groups the Nordic regions have almost exclusively witnessed
was smaller almost everywhere in the Nordic Re- increases in old-age dependency ratios. Strong an-
gion in 2017 than in 2007. The exceptions are Green- nual average increases of more than 4% occurred in
land, where the working-age population increased rural areas of Finland, Iceland and urban-adjacent
from 69.7% to 70.8% and Sweden, where the young municipalities in Denmark, for instance in the sur-
population was almost of the same proportional rounding areas of Aarhus and Copenhagen. In rural
size in 2017 as in 2007. and remote areas in Sweden, Norway and Denmark,
Within the Nordic Region, population ageing the average increase in old-age dependency ratios
between 2007 and 2017 has been least pronounced remained below 4 percent per year in the majority of
in large urban areas. Cities such as Stockholm, Co- municipalities. A few municipalities in Sweden, Nor-
penhagen, Oslo, Reykjavík and Malmö have either way and Iceland even experienced declines in their
registered declines in their old-age dependency ra- old-age dependency ratios between 2007 and 2017.
tios or slower increases than elsewhere (figure 2.4). Overall, however, such declines remain the exception in
This has largely been a result of the influx of young an otherwise ageing population in the Nordic Region.
people from rural areas and abroad who moved to
30 STATE OF THE NORDIC REGION 2018Figure 2.6 Old-age dependency ratio 2030.
THEME 1 DEMOGRAPHY 31Population ageing expected to progress at different speeds, reflecting differences
continue until 2030 in current age structures and expected demographic
behaviour.
All NSIs expect that the population ageing trend
will continue in the coming years. Projections sug-
gest that Finland and Åland will continue to have Concluding remarks
the oldest age structures among the Nordic regions
(figure 2.5). 17.0% of the population in both regions If the projection results described here are correct,
will belong to age groups 65–79 years in 2030, and the Nordic Region will be older and more urban in
around 8.5% will be aged 80 years or older. At the 2030 than it is today. Cities will have to provide
other end of the spectrum, Greenland’s population housing and infrastructure for more inhabitants,
is projected to remain comparatively young. Statis- while many rural and remote municipalities will
tics Greenland assumes that fertility will remain at have to develop strategies to influence or adapt to
a level of 2.1 children per woman in the future, and population decline. To different degrees, all munic-
that life expectancy will rise, but remain lower than ipalities will have to accommodate the needs and
in the other Nordic countries. Both factors con- demands of a growing number of older persons. As
tribute to the comparatively young projected age recent publications show, many villages, towns and
structure in 2030. Only 12.5% of the population will cities are already implementing innovative strate-
be of retirement ages (combined age groups 65–79 gies to address population changes and these may
years and 80+ years) in 2030, up from 8.1% in 2017. serve as examples for other Nordic municipalities in
Greenland, together with Sweden and Denmark, the coming years (Hörnström & al., 2015; Johnsen &
is also expected to see a small increase in the pro- Perjo, 2014).
portion of younger people, thanks to high fertility While the demographic outlook suggests that
rates: 21.4% of the population will be aged 14 or Nordic municipalities face a variety of challenges to
younger in 2030, up from 21.1% in 2017. Finally, the their traditional welfare state arrangements and
proportional size of the working-age population other areas of public and private life, two points
(15–64 years) is expected to decrease across the must be kept in mind:
Nordic Region. First, population projections are inherently un-
Figure 2.6 highlights differences in projected age certain. If fertility, mortality or migration trends
structures within each region. In 2030, the largest develop differently than currently projected by the
cities such as Stockholm, Oslo, Helsinki, Copenha- NSIs, the size and age structure of populations may
gen, Stavanger and Gothenburg will have old-age look somewhat different in 2030 than those shown
dependency ratios between 16% and 30%. The work- here. Migration to and from municipalities may play
ing age population (15 to 64 years) will be at least 3.3 a particularly important role: The closure of a com-
times larger than the retirement age population in pany that provides for a large share of jobs, the
these areas. Much higher old-age dependency ratios opening of a new service provider or similar local
are expected in many rural and sparsely populated events may prompt more people to leave or move to
areas. The highest levels are projected for many mu- a municipality than we can anticipate today (Foss &
nicipalities in northern and eastern Finland, which Juvkam, 2005). Similarly, municipal attempts to
will have more than one person of pension age for counteract the outmigration of young people or to
every person of working age. Most other rural areas attract new residents with the help of rural devel-
in Norway, Sweden, Denmark and Finland will have opment programmes may prove fruitful and change
lower old-age dependency ratios, but levels vary migration patterns. Hence, while the projection re-
widely between 20% and 100%. Figure 2.6 also sults in this chapter show likely population dynamics
shows that large parts of Greenland will retain com- in the Nordic Region up to 2030, somewhat differ-
paratively young age structures in their population ent outcomes are possible.
up to 2030. Kujalleq is the only municipality in Green- Second, while de facto population trends may
land expected to reach an old-age dependency ratio deviate from the trends outlined here, it is clear that
above 20%. In general, almost all municipalities in the proportion of people aged 65 years and older
the Nordic Region are expected to have higher old- will increase in the years to come. Nonetheless,
age dependency ratios in 2030 than today. These these changes do not necessarily imply that the
increases will however begin from various levels and number of patients dependent on health care and/
32 STATE OF THE NORDIC REGION 2018You can also read