Strategies to Control the Rising Cost of State Employee Health Care
←
→
Page content transcription
If your browser does not render page correctly, please read the page content below
Douglas R. Hoffer Vermont State Auditor
Strategies to Control the
Rising Cost of State
Employee Health Care
Examining price variation in the State
employee health plan
12 November 2021
Investigative 1Report 21-07
Investigative Report: The Vermont State Employee Health Plan 12 November 2021
Mission Statement: The mission of the Auditor’s Office is to hold State
        government accountable by evaluating whether taxpayer funds are
        being used effectively and identifying strategies to eliminate waste,
        fraud, and abuse.

        Investigative Report: An investigative report is a tool used to inform
        citizens, policymakers, and State agencies about issues that merit
        attention. It is not an audit and is not conducted under generally
        accepted government auditing standards. Unlike an audit, which
        contains formal recommendations, investigative reports include
        information and possible risk-mitigation strategies relevant to the topic
        that is the object of the inquiry.

        Principal Investigator: Fran Hodgins, Government Research Analyst

                                                     2

Investigative Report: The Vermont State Employee Health Plan             12 November 2021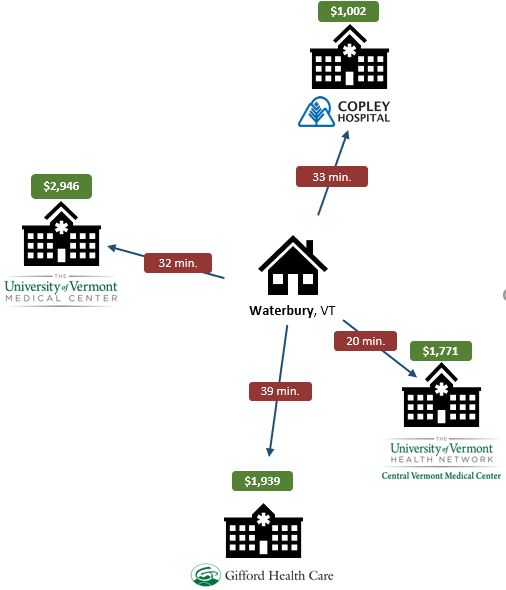
Table of Contents
        Table of Contents
        Executive summary ......................................................................................................................... 4
        Introduction .................................................................................................................................... 5
        Price variation in the Vermont State Employee Health Plan .......................................................... 8
        Strategies to reduce health care costs by addressing price variation .......................................... 10
           Reference-based pricing: Montana State Employee Health Plan ........................................................... 10
           Incentives to select cost-effective care: New Hampshire’s State Employee Health Plan ...................... 12
        Applying cost savings strategies to Vermont’s State Employee Plan ........................................... 12
           Scenario 1: Reference-based pricing ...................................................................................................... 12
           Scenario 2: Incentives to select cost-effective care ................................................................................ 14
        Appendix A .................................................................................................................................... 17
        Appendix B .................................................................................................................................... 25
        Acknowledgements....................................................................................................................... 29

                                                                                3

Investigative Report: The Vermont State Employee Health Plan                                                                              12 November 2021
Executive Summary
Executive summary
The Vermont State employee health plan covers more than 25,000 members and works like ordering
from an a la carte menu. Each time someone receives a medical service, the State pays a site-specific
price. When a State employee uses (often without knowing it) a more expensive provider, it increases
the overall cost of health care for the State, which is mostly paid for by taxpayers.
This report examines the extent to which the State is Example of Price Variation for an MRI
paying different prices to different medical providers
for the exact same services. The term used to describe Price: $4,290
this is “price variation.” Examining a sample of health Hospital A
care services commonly used by State employees, we
found that the highest priced provider for a given
Price: $2,589
service was paid an average of 3.5 times more than
Hospital B
the lowest priced provider for the exact same service.
The most extreme difference in prices is for State employee
echocardiographs – the highest priced provider is paid in need of an Price: $1,648
9.3 times more than the lowest priced! MRI Hospital C
Utilization of higher priced providers – and the resulting increase in health care spending – matters
because State employee health care is a significant and growing expense for Vermont. From 2010 to
2019, annual medical payments for State employees, retirees, and their families increased by 51%,
from $94 million to $142 million. That’s a combined $245 million in increased payments. Reducing the
cost of health care would free up resources that could support other State efforts or ease the pressure
on taxpayers. In response, we examined two strategies Vermont could pursue to reduce the cost of
State employee health care by addressing price variation.
1) Reference-based pricing: Reference-based pricing occurs
when a health care purchaser, in this case a state, sets a Successes in other states:
maximum amount they are willing to pay for a service rather Montana used reference-
than merely paying the prices negotiated by insurance based pricing in their State
companies and hospitals. We estimate that if reference-based employee health plan and
pricing was implemented for just the 39 services we sampled, saved $47.8 million from
savings could reach $2.3 million annually, with an average 2017 to 2019.
savings of 13% per service. If this level of savings was New Hampshire
achieved across all services, total savings could reach $16.3 implemented an incentive
million annually. program to encourage State
employees to select cost-
2) Incentives to select cost-effective care: Under this model, effective care. They saved
insurers provide employees with comparative price $4.7 million in 2019.
information and a cash incentive when an employee selects a
lower priced provider. We estimate that if the State implemented this program for seven types
of shoppable services in our sample, savings could reach approximately $202,000 annually, with
an average of 3% savings per service; with each added service (there are hundreds), the State
would enjoy additional savings.
4
Investigative Report: The Vermont State Employee Health Plan 12 November 2021Introduction
Introduction
Imagine that you are purchasing a new car. Two dealers in your town are selling the car that you want,
but one of them is charging 50% more. You wouldn’t choose the more expensive dealer, right? And yet,
in health care, Vermonters frequently use (often without knowing it) the more expensive option, seeing
providers that charge double, triple, or more for the exact same procedure. For a number of reasons,
health care does not operate like other markets, and patients may not be able or incentivized to seek
out a better deal. But when patients use more expensive providers, it increases the cost of health care
for patients, employers, and taxpayers.
Earlier this year, the State Auditor’s Office (SAO) published a memo highlighting the significant variability
in prices paid to health care providers for the same services in Vermont. We now turn our attention
toward the State employee health plan. The State employee health plan covers more than 25,000
members and works like ordering from an a la carte menu. Each time someone covered by the plan
receives a medical service, the State pays a site-specific price for that service. If a more expensive
provider of, say, an MRI is selected, then the taxpayers pay more than they would if a lower priced
option was used. Conversely, each time a State employee, retiree, or their family member uses a lower
priced option, taxpayers save money compared with higher priced options.
This report examines the extent to which the State is paying different prices to different medical
providers for the exact same services used by State employees, retirees, and their family members. The
term we will use to describe this is “price variation.” We then identified two strategies – reference-
based pricing and an incentive program – that Vermont could pursue to reduce the cost of State
employee health care by limiting the impact of price variation. In our sample, reference-based pricing
resulted in an average savings of 13% per service. If Vermont achieved this level of savings across all
medical services covered under the State plan, total savings could reach up to $16.3 million annually.
Under the incentive program, savings averaged 3% per service; total savings under an incentive program
are dependent on how many services are included in the program and employee participation.
Background
Background
Significant differences in prices for the same procedure contribute to rising health care costs
Price variation occurs when health care providers are paid different amounts for the same service. For
example, imagine that a State employee needs an MRI. This employee participates in the State
employee health plan which is administered by Blue Cross Blue Shield of Vermont (BCBSVT). The
employee’s co-pay will be the same at any hospital in Vermont. However, the price that BCBSVT
negotiates with each hospital differs even though the payment covers the exact same service. In the
example below, Hospital A’s price of $4,290 for an MRI is 166% greater than Hospital B at $2,589 and
260% greater than Hospital C at $1,648. (These are actual median prices that BCBSVT paid to three
hospitals for State employees’ care in 2019.) The employee pays the same $30 co-pay regardless of
which hospital performs the MRI. However, the extra cost to the State health plan of choosing Hospital
A instead of Hospitals B or C is $1,701 and $2,642 respectively. While insurance shields patients from
this price variation at the time of care delivery, when patients select or providers refer patients to higher
5
Investigative Report: The Vermont State Employee Health Plan 12 November 2021priced providers, it increases the overall cost of employee health care for the State, which is mostly
funded by taxpayers. 1,2
Figure 1. Example of price variation for an MRI using median price data from BCBSVT
Co-pay paid by patient: $30
Price paid by BCBSVT: $4,290
Hospital A
Co-pay paid by patient: $30
Price paid by BCBSVT: $2,589
Hospital B
State employee
Co-pay paid by patient: $30
in need of an MRI
Price paid by BCBSVT: $1,648
Hospital C
Source: BCBSVT, State of Vermont Employer Group: 2019 Median Price data.
For most goods and services, informed consumers consider price and quality when deciding what to
purchase, presumably driving the market towards better value. However, lack of accessible data has
historically been a barrier that prevents patients from being able to search for cost-effective care. 3, 4
Even when comparative data is available, patients commonly seek care where their health care provider
has referred them rather than shop around, 5 and in some cases, such as emergency care, patients are
not able to select their site of care in advance. 6 In addition, patients with comprehensive health
insurance (such as Vermont State employees) are insulated from price variation at the time of service
which means that these patients have no direct financial motivation to seek cost-effective care. 7
Higher prices are not associated with higher quality care
In many industries, higher prices are associated with higher quality goods and services. Does health care
have the same price-to-quality relationship? In other words, when an individual uses higher priced care,
1
University of Vermont College of Medicine, University of Massachusetts Medical School, & Wakely Consulting
Group. (2014). Price Variation Analysis. Prepared for the Green Mountain Care Board.
2
The State covers 80% of the medical plan; employees contribute the other 20%.
3
In 2014 and 2016, the SAO released two reports discussing the state of health care price and quality
transparency for consumers in Vermont.
4
In recent years, there have been efforts at both the state and federal level to increase price transparency,
making it easier for consumer to access health care price information. Starting in 2016, Vermont statute 18
V.S.A. § 9413 requires commercial health insurers to provide online cost and quality data to their members.
BCBSVT offers such a tool on their website. At the federal level, the Centers for Medicare and Medicaid
Services (CMS) require hospitals to publish the negotiated prices that they receive from insurance companies.
While the impact of these changes is still unfolding, there have been challenges with hospital compliance and,
more generally, consumer awareness and use of price comparison data is limited.
5
Chernew, M., Cooper, Z., Hallock, E., & Morton, F. (2021). Physician agency, consumerism, and the
consumption of lower-limb MRI scans. Science Direct, 76 (102427).
6
CMS defines shoppable services as, “a service that can be scheduled by a health care consumer in advance,”
such as imaging and lab services, medical and surgical procedures, and outpatient clinics.
7
Patients without health insurance or with high deductible plans are less insulated from price variation.
6
Investigative Report: The Vermont State Employee Health Plan 12 November 2021are they receiving better medical care than their peers who receive care at lower priced providers? The
short answer is that there is not consistent evidence that higher prices are associated with higher
quality care. 8, 9, 10
To better understand what is driving this price variation, a 2014 analysis prepared for the Green
Mountain Care Board looked at a range of insurer and provider-related factors that impacted price
variation for professional services in Vermont. The authors found that there, “is no consistency in the
share of variation explained by each factor across services.” Furthermore, a significant portion of
variation was “Unexplained” by their model, raising further questions about what drives this variation
and whether it is justified. In fact, for most medical services, more than 40% of the difference in prices
could not be explained. 11
Figure 2. Average variation in professional prices explained by each factor
Recreated using data from the 2014 analysis prepared for the Green Mountain Care Board
Medical and Insurer-related factors:
Unexplained variation, 44% Insurer-related 27% Provider-related, 29% • Payer
Ancillary visits
• Health plan product
• Imputed payment method
Surgical visits 57% 11% 32% • Patient share of payment
• Calendar quarter
Provider-related factors:
Evaluation and • Provider size
43% 37% 20% • Provider region
Manamgent visits
• Provider type
• Site of service
Radiology services 9% 4% 87% • Service code modifier
Source: University of Vermont College of Medicine, University of Massachusetts Medical School, & Wakely Consulting
Group. Price Variation Analysis. August 2014.
While some price variation may be warranted (e.g., variation due to the severity of a patient’s illness),
unwarranted price variation increases overall health care costs without offering better value or societal
benefits. 12 For example, the ability of some providers to negotiate higher prices creates unwarranted
price variation that raises prices with no quality improvement and no relationship to the actual costs to
provide the service. 13
8
Massachusetts Health Policy Commission. (2015). 2015 Cost Trends Report: Provider Price Variation.
9
Beauvais, B., Gilson, G., Schwab, S., Jaccaud, B., Pearce, T., & Holmes, T. (2020). Overpriced? Are Hospital
Prices Associated with the Quality of Care?. Healthcare (Basel, Switzerland), 8(2), 135.
10
Hussey, P. S., Wertheimer, S., & Mehrotra, A. (2013). The association between health care quality and cost: a
systematic review. Annals of internal medicine, 158(1), 27–34.
11
University of Vermont College of Medicine, University of Massachusetts Medical School, & Wakely Consulting
Group. (2014). Price Variation Analysis. Prepared for the Green Mountain Care Board.
12
Special Commission on Provider Price Variation Report. (2017).
13
Figures 8 and 9 on pages 15 and 18 illustrate the weakness of associating higher price with higher quality in
health care settings. Figure 8, for instance, displays the price for a CT scan of the chest at certain Vermont
hospitals. Using publicly available data from each hospitals’ website, we can see that (continued on next page)
7
Investigative Report: The Vermont State Employee Health Plan 12 November 2021PricePrice
variation in the in
variation Vermont State employee
the Vermont health plan
State Employee Health Plan
The State pays significantly different prices for the same health care services used by State employees
Using data from BCBSVT, we examined variation among prices paid for health care services used by
State employees, retirees, and their families. BCBSVT provided median price data for the top 75 services
(by total cost) used by the State employer group across the top 12 utilized providers. Data was provided
for claims incurred by State employees between January 1, 2019 to December 31, 2019. We then
narrowed our focus to 39 services that were offered by three or more providers, primarily focusing on
services with high volume, high cost, and/or high variation in prices.
Consistent with other studies in Vermont, we found significant price variation across providers. In our
sample, the highest priced provider for a given service was paid an average of 3.5 times more than the
lowest priced provider for the exact same service (an increase from 2.8 times in 2014, just five years
earlier). For some services, the difference between the highest and lowest priced provider was even
more extreme, such as a CT scan (5.8 times) and an echocardiograph (9.3 times). High levels of variation
were most common among outpatient services (see Appendix A for price information for all 39
services).
Figure 3. Variation in median prices paid by BCBSVT for CT scans and echocardiographs for State
employees and dependents
Median Price, CT scan of the chest Median Price, Echocardiograph
Hospital C $2,738 Hospital F $2,880
Hospital D $2,280 Hospital L $2,076
Hospital L $2,227 Hospital D $1,939
Hospital E $2,008 Hospital A $1,931
Hospital K $1,864 Hospital E $1,802
Hospital G $1,648 Hospital G $1,782
Hospital A $1,423 Hospital B $1,776
Hospital J $1,174 Hospital J $1,571
Hospital F $920 Hospital K $1,395
Hospital B $830 Hospital C $476
Hospital I $473 Hospital I $310
Source: BCBSVT, State of Vermont Employer Group: 2019 Median Price data.
the price for this procedure at Porter Medical Center is twice the price at Copley Hospital. There is absolutely
no indication that the quality of this procedure is any higher at Porter than at Copley, let alone twice as much.
8
Investigative Report: The Vermont State Employee Health Plan 12 November 2021We also looked at the extent to which State employees use higher priced health care providers. Across
the 87,679 services included in our sample, 32,912 services (38%) took place at providers with a median
price that was higher than the midpoint price across the 12 providers.
Figure 4. Percentage of services received at sites with median prices above the midpoint price
Inpatient Services Outpatient Services Professional Services
37% of 38% of
services services
55% 45% at or above the above the
of services below the 63% at or 62% at or
midpoint midpoint
above the midpoint below the below the
price price
midpoint price midpoint midpoint
price price price
n=326 n=48,519 n=38,834
Source: BCBSVT, State of Vermont Employer Group: 2019 Median Price data.
Utilization of higher cost providers – and the resulting increase in health care spending – matters
because State employee health care is a significant and growing expense for Vermont and State
employees. The State offers employer sponsored health insurance to State employees, retirees, and
dependents. 14 Between 2010 and 2019, annual medical claims covered under the State plan grew 51%,
from $94 million to $142 million, while the number of covered lives grew by just 16%. That’s a combined
$245 million in increased payments.
Figure 5. Medical claims for the State plan grew 51% between 2010 and 2019 15
$146 mill. $142 mill.
$134 mill.
$127 mill.
$119 mill. $119 mill.
$105 mill.
$94 mill. $99 mill. $100 mill.
21,878 lives 25,371
covered by lives
the state covered in
medical plan 2019, a 16%
in 2010 increase
2010 2011 2012 2013 2014 2015 2016 2017 2018 2019
Source: Vermont Department of Human Resources, Annual Utilization Reports 2010-2019.
14
Permanent classified or exempt employees who work at least 1,040 hours per year are eligible to participate
in the medical plan. Retirees are eligible to participate in a medical wrap plan if they have coverage on their
last day of employment. Per State legislation, certain employers called “Special Groups” are also eligible. As of
July 2021, this includes the Vermont Historical Society, the VSEA, and the Vermont Council on the Arts.
15
Prescription drug costs are not included but added $29 million to the total in 2019. The reduction in the 2019
claims amount resulted from changes that occurred when the state rebid the contracts for the medical and
pharmaceutical plans in 2019. Spending is anticipated to increase by 7% in both 2022 and 2023.
9
Investigative Report: The Vermont State Employee Health Plan 12 November 2021Strategies to reduce
Strategies health care
to reduce costs
health by costs
care addressing price variation
by addressing price variation
Reducing the cost of State employee health care would free up resources that could support other State
efforts or reduce the overall cost of delivering State services. With those goals in mind, we examined
strategies that the State could pursue to reduce the cost of employee health care by addressing price
variation.
Many states are grappling with the rising costs of their employee health plans. Some have implemented
innovative policies to reduce the cost of care for their employees by limiting price variation. Below, we
highlight strategies adopted by Montana and New Hampshire. We then use data from BCBSVT to
illustrate potential savings if these strategies were adopted by the Vermont State employees’ health
plan.
Reference-based pricing:
Reference-based Montana
pricing: State Employee
Montana Health Plan
State Employee Health Plan
Reference-based pricing occurs when a health Table 1. Overview of Montana’s strategy to
care purchaser, in this case a state, sets a reduce health care costs
maximum amount they are willing to pay for a Model Reference-based pricing
service rather than merely paying the prices State fiscal year 2017 -
negotiated by insurance companies and hospitals. Years in place
present
To address rising health care costs, Montana $47.8 million in State
implemented reference-based pricing for their Estimated savings
fiscal years 2017-2019
State employee health plan in State fiscal year Inpatient and outpatient
2017. Their State employee plan is comparable in Services covered services at all acute care
size to Vermont and covers approximately 29,000 hospitals in the state
members. Montana used Medicare payment rates Action required by
as the benchmark to establish reference payments employees None
across all of the state’s acute care hospitals. 16 For Limitations to
None
each procedure, Montana set the reference price employee choices
between 220% to 225% of the Medicare rate for Guaranteed savings Yes
inpatient services and 230% to 250% of the Medicare rate for outpatient services. 17
After implementing reference-based pricing, independent evaluators estimate that Montana saved
$47.8 million (17%) over three years for inpatient and outpatient care. In State fiscal year 2019,
Montana’s average per member per month spending decreased by 22% for inpatient services and 14%
for outpatient services. 18 It is important to note that this represents an actual reduction in
expenditures, not merely slowing the rate of growth in expenditures which is a more typical goal of
health care policy proposals.
16
In Montana, the contracted payment rate did not change for critical access hospitals, which are small, rural
hospitals with limited services. Critical access hospitals account for a small percentage of Montana State
employees’ health care costs.
17
Schramm and Aters, (2021). Estimating the Impact of Reference-Based Hospital Pricing in the Montana State
Employee Plan.
18
Ibid.
10
Investigative Report: The Vermont State Employee Health Plan 12 November 2021Figure 6. Average cost per member per month in Montana, traditional negotiations vs. reference-
based pricing
Recreated using data from the 2021 evaluation of the Montana reference-based pricing program
Inpatient services
$288
$272 $263
$233 $226
$206 $212 $213 $208
SFY14 SFY15 SFY16 SFY17 SFY18 SFY19
Traditional negotiation reimbursement Reference-based pricing
Outpatient services
$294
$278
$248 $248 $252
$233 $238
$223 $219
SFY14 SFY15 SFY16 SFY17 SFY18 SFY19
Traditional negotiation reimbursement Reference-based pricing
Source: Schramm and Aters, (2021). Estimating the Impact of Reference-Based Hospital Pricing in the Montana State
Employee Plan.
Because Montana was able to negotiate prices with all acute care hospitals in the state, nothing
changed from the perspective of the employee. Employees did not have to shop for lower prices; any
acute care hospital that offered these services was paid the reference price. Despite being paid lower
prices, there was no evidence that any health care provider in Montana reduced the range of services
they offered to State employees as a result of reference-based pricing. 19
19
Schramm and Aters, (2021). Estimating the Impact of Reference-Based Hospital Pricing in the Montana State
Employee Plan; Correspondence with the former Administrator of the State of Montana Health Care and
Benefits Division.
11
Investigative Report: The Vermont State Employee Health Plan 12 November 2021Incentives
Incentives to select
to select cost-effective
cost-effective care:
care: New New Hampshire’s
Hampshire’s State Employee
State Employee Health Plan
Health Plan
Incentives to select cost effective care: New Hampshire State Employee Health Plan
Several states have promoted incentive-based Table 2. Overview of New Hampshire’s
programs to reward employees when they select lower strategy to reduce health care costs
priced providers. 20 In these programs, insurers provide Model Incentive program
employees with comparative price information and a Years in place 2010-present
cash incentive when an employee opts for a lower Estimated savings $4.7 million in 2019
priced provider. In effect, the State and the employees Services covered 50 + shoppable services
share in the savings associated with utilizing lower Action required by Utilize shopping tool
priced providers. These voluntary programs don’t limit employees and select less
options or penalize employees if they decide to go to expensive providers
higher priced providers. Limitations to
None
employee choices
As of 2020, eight states have adopted incentive
programs for public employees, including New Guaranteed No, hinges on
savings employee participation
Hampshire. 21, 22 New Hampshire’s SmartShopper
program offers State employees, retirees, and their dependents incentives to select cost-effective
providers for more than 50 services. For example, if an employee chooses to get a colonoscopy at the
most cost-effective provider, she will get a $250 incentive payment.
In 2019, New Hampshire’s SmartShopper program saved $4.7 million after paying out $674,000 across
9,697 employee incentive payments. 23 The success of incentive-based programs hinges on employee
participation, and as such, promoting the shopping tool and educating employees about the benefits of
the program is critical. New Hampshire reports the highest rate of State employee participation, with
53% of eligible enrollees utilizing the SmartShopper tool at least once in 2019. 24
Applying
Applying cost savings
cost saving strategies
strategies to Vermont’s
to Vermont’s Stateplan
State employee Employee Plan
Drawing on the examples in Montana and New Hampshire, we used data from BCBSVT to estimate
potential savings if Vermont implemented similar programs in the Vermont State employee health plan.
Scenario
Scenario 1: Reference-based
1: Reference-based pricing pricing
For each of the 39 services in our sample, we modeled potential savings if the State implemented
reference-based pricing. We used the midpoint price across the 12 providers in our sample as the
reference price. For example, in our sample, the State plan covered 366 CT scans of the abdomen or
20
National Conference of State Legislatures. (2021). Transparency of Health Costs: State Actions.
21
The eight states that have adopted incentive programs are Florida, Kansas, Kentucky, Missouri, New
Hampshire, Texas, Utah, and Virginia. In addition to state efforts, companies have also implemented incentive-
based programs with evidence of modest savings.
22
Tennessee Advisory Commission on Intergovernmental Relations. (2020). Cost Savings of Right to Shop
Programs.
23
Ibid.
24
Ibid.
12
Investigative Report: The Vermont State Employee Health Plan 12 November 2021pelvis in 2019, at a total cost of $1,041,076. The median price at each hospital ranged from $1,075 to
$3,505, with the midpoint price of $2,615. Of the 366 visits, 240 (66%) took place at hospitals that were
above the midpoint price. If Vermont used the midpoint price as the reference price for CT scans, we
estimate that the State would save approximately $191,000 annually, or 18% of the total cost for just
this one service.
Table 3. Estimated savings for CT scans of the abdomen or pelvis using the midpoint price as the
reference price
Estimated
savings
using the
midpoint
price:
$190,853
Midpoint
Note: 2019 median price data was provided by BCBSVT for the State of Vermont Employer Group.
Across the 39 services in our sample, 32,912 visits (38%) took place at facilities with median prices above
the midpoint. We estimate that if reference-based pricing using the midpoint price was implemented
for just the 39 services we sampled, the State could save $2.3 million annually, with an average of 13%
savings per service. If this level of savings was achieved across all medical services, total savings could
reach $16.3 million annually.
As noted above, Montana negotiated reference-based pricing with all acute care hospitals in the state
so that regardless of where an employee went, the State paid the reference price. Alternatively, when
California implemented reference-based pricing, they did not set the price that each hospital could
charge, but instead limited how much the State plan would pay. If a provider charges more than what
the plan sets as its payment and the employee still chooses to receive care from that provider, the
employee has to cover the difference between the hospital’s price and the reference price (see
Appendix A for more detail on California’s model). In a “California” scenario, reference-based pricing
would only be appropriate for shoppable services since patients can’t always select their site of care in
advance (e.g., emergency care).
13
Investigative Report: The Vermont State Employee Health Plan 12 November 2021Scenario 2: Incentives to select cost-effective care
Scenario 2: Incentives to select cost-effective care
We also modeled potential savings if Vermont offered an incentive for employees to select lower priced
care (at the midpoint price or below). Because not all services are appropriate for shopping, we
narrowed our sample to shoppable services (drawing on CMS’ list of Shoppable Services) in which the
midpoint price was at or above $1,000. 25 For example, in our sample there were 827 outpatient claims
for colonoscopies in 2019. Over half (433) of these colonoscopies took place at hospitals with a price
above the midpoint price. Under an incentive program, employees would be encouraged to shop for
their care and rewarded if they select a lower priced provider.
Figure 7. Example of incentive payment program for a colonoscopy
A State employee needs a
colonoscopy
Hospital C Hospital A
Using the online comparison tool, the
employee identifies two hospitals in
their region that offer this procedure.
Price paid by BCBSVT: $887 Price paid by BCBSVT: $2,576
If the employee selects Hospital C, The employee is still able to
they will receive a $75 incentive select Hospital A with no penalty
payment
Net savings to state: $1,614
Note: 2019 median price data was provided by BCBSVT for the State of Vermont Employer Group. The incentive
payment amount is provided as an example. The actual amount depends on program design.
We estimated savings for seven types of shoppable services in our sample. Recognizing that not all
employees will be motivated to participate, we assumed that approximately one third of employees
would use the shopping tool and select lower priced care. 26 Under these conditions, we estimate
annual savings of approximately $202,000 across just these seven services, with an average of 3%
savings per service.
25
We selected higher cost procedures because the potential for savings and corresponding incentive payment
needs to be great enough to motivate change in an employee’s behavior. If, for example, the potential savings
was only $25, the incentive payment would need to be even smaller. Such a small incentive payment is
unlikely to prompt behavior change. This is a significant drawback of this model; while the per visit savings
may be modest, we found that some of the largest opportunities for savings came from high volume, low-cost
services (e.g., office visits).
26
The rate of uptake for the comparison tool was based on New Hampshire’s participation rate in their State
employee SmartShopper program. We drew from New Hampshire’s public employee SmartShopper program
to estimate the percentage of employees that use the tool and receive incentives.
14
Investigative Report: The Vermont State Employee Health Plan 12 November 2021Table 4. Estimated annual savings from an incentives program
Number of Net annual Savings as a
visits in savings at percentage of
sample 33% uptake current spend
CT scan 551 $68,655 5%
MRI 550 $42,312 3%
Colonoscopy 827 $39,914 2%
Joint replacement 49 $29,459 2%
Routine OB care 64 $9,006 5%
Cataracts 80 $7,361 5%
Echocardiogram 322 $5,394 1%
Total 2,443 $202,101
Note: 2019 median price data was provided by BCBSVT for the State of Vermont Employer Group.
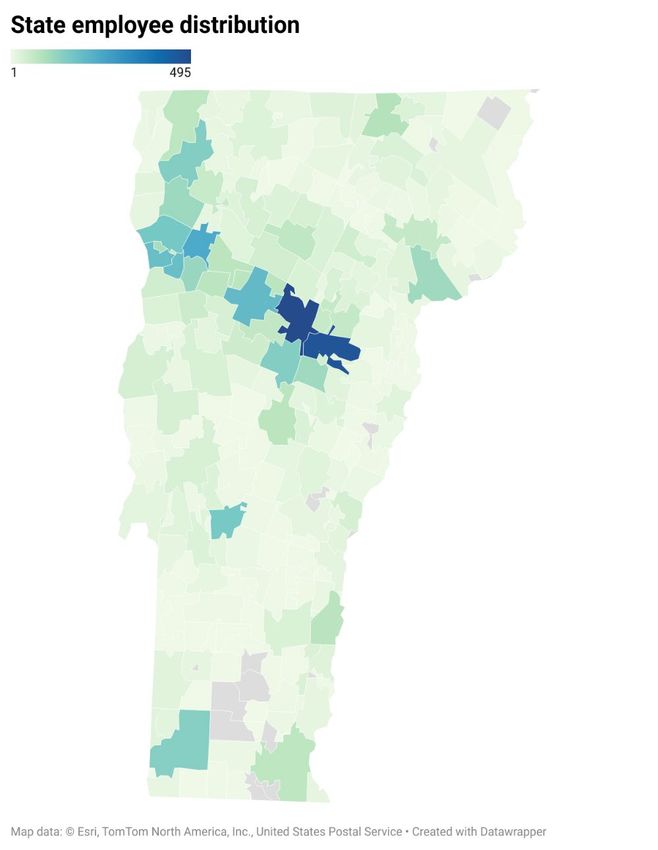
A potential challenge for an incentive program is that some areas of the state may have limited
providers for employees to choose from. To better understand this issue, we compared employee’s zip
codes and the locations of hospitals across Vermont. In many of the areas where employees are
concentrated, there are several hospitals within a reasonable driving distance. For example, half of State
employees live between Burlington and Montpelier and there are multiple hospitals in this region. Using
publicly available hospital price data for 2021, the map below shows the hospitals that employees in this
region could potentially choose between for a CT scan (Figure 8).
Figure 8. Distribution of employees and hospital locations with BCBSVT 2021 negotiated prices for a
CT scan of the chest
Sources: 1) Employee zip code data provided by VTHR. 2) 2021 price data accessed from hospitals’ price transparency
websites as of 10/20/21.
15
Investigative Report: The Vermont State Employee Health Plan 12 November 2021For example, an employee living in Waterbury has access to four hospitals within a 40-minute drive, but
prices range from $1,002 at Copley Hospital to $2,946 at the University of Vermont Medical Center (see
Appendix A). Receiving care from a less expensive provider could result in savings as great as $1,944 (or
66%) for just this one procedure. For many services, this map underrepresents possible sites of care
because non-hospital providers also offer these services. While there may be regions in the state where
choices are more limited (see Appendix A for map of the entire state), a feature of both the incentive
and reference-based pricing initiatives explored in this report is that neither penalizes employees in any
way for continuing to receive care at any location they choose.
Conclusion
Conclusion
Based on our analyses, we found significant differences in prices that the State pays for medical services
commonly used by State employees. Utilization of higher priced providers contributes to the high cost of
employee health care for the State and for taxpayers. Facing similar challenges, Montana and New
Hampshire took proactive steps to control costs by addressing price variation. Although their models
varied, both States achieved savings without penalizing or limiting employees’ choices in any way.
Drawing on their successes, our analyses demonstrate the potential for significant savings if Vermont
adopted either of these strategies, but especially reference-based pricing.
When interpreting the estimated savings in our analyses above, it is important to keep in mind that we
looked at a small sample of the total services covered by the State employee health plan. The total cost
for the 39 services in our sample was $20 million which is only 14% of the total claims ($142 million) that
BCBSVT paid on behalf of State employees for medical services in 2019. Our ability to extrapolate
findings across all services is limited since we do not know whether our sample is representative. But if,
for example, the levels of savings under our reference-based pricing scenario were achieved across all
services, total savings could reach up to $16.3 million annually. Total savings for an incentive-based
program depends on the number of services that are included in the program and employee
participation. The Vermont Department of Human Resources should conduct a more complete analysis
of State employees’ health care utilization and provider prices to model savings under reference-based
pricing or an incentive program.
We recognize that there are implementation challenges that accompany each of these models.
Hammering out the programmatic details and pricing structures as well as negotiations with relevant
parties would require significant effort. However, the status quo is not sustainable. The ever-rising cost
of State employee health care strains the State’s budgets. As the second largest employer in Vermont,
State action could also help drive needed change across Vermont’s health care system. For example,
either a reference-pricing system or an incentive-based program should encourage higher priced
facilities to become more efficient and reduce prices where nearly all other health care policies have
failed.
Lastly, it’s worth noting that there are ongoing health reform efforts in Vermont designed to slow the
rate of spending growth and reorient how health care is delivered (such as Vermont’s trial of the All-
Payer ACO model). However, regardless of the payment and delivery arrangements, controlling prices is
critical to controlling health care costs. Furthermore, establishing consistent and fair prices would be
beneficial when setting benchmarks for future payment and care delivery arrangements.
16
Investigative Report: The Vermont State Employee Health Plan 12 November 2021Appendix A
Appendix A
Table 5. Distribution of variation in median prices across the 39 services in our sample
Difference between
lowest and highest Inpatient Outpatient Professional
median price
1 to 2 times – – 9 services
2 to 3 times 3 services 3 services 4 services
3+ times 2 services 18 services -
Reference-based pricing: California Public Employees Retirement System (CalPERS)
In 2011 and 2012, the CalPERS adopted a reference-based pricing system for a number of high-cost
shoppable surgical procedures, including joint replacement, colonoscopies, arthroscopy of the knee and
shoulder, and cataract removal. Under this model, CalPERS worked with their third-party administrator,
Anthem, to set the maximum amount that they were willing to pay for a procedure. If employees
selected care at a designated site that was at or below the reference price, they would receive standard
coverage. However, if the employee selected a more expensive provider, then they were responsible for
paying the difference. 27, 28 Following implementation of reference-based pricing, employees were more
likely to utilize lower-priced facilities, resulting in savings across all procedures:
• Prices for arthroscopy of the knee and shoulder decreased by 18% and 17% respectively,
resulting in $2.3 million in savings over two years 29
• Prices for cataract removal were 20% for lower, resulting in $1.3 million in savings over two
years 30
• Prices for colonoscopies decreased by 21%, resulting in $7 million in savings over two years 31
• Prices for joint replacement surgeries decreased between 5-18% (depending on facility type),
resulting in $2.8 million in savings to the State over one year 32
27
Lechner, A., Gourevitch, R., and Ginsburg, P. (2013). The Potential of Reference Pricing to Generate Health
Care Savings: Lessons from a California Pioneer. Health System Change Research Brief No. 30.
28
If patients had a medical reason that they needed to go to a non-designated site or if patients were too far
from a designated site, they were not required to pay the difference.
29
Robinson, J. C., Brown, T. T., Whaley, C., & Bozic, K. J. (2015). Consumer Choice Between Hospital-Based and
Freestanding Facilities for Arthroscopy: Impact on Prices, Spending, and Surgical Complications. The Journal of
bone and joint surgery. American volume, 97(18), 1473–1481.
30
Robinson, J.C., Brown, T. and Whaley, C. Reference-Based Benefit Design Changes Consumers’ Choices and
Employers’ Payments for Ambulatory Surgery. Health Affairs, 34(3).
31
Robinson, J.C., Brown, T.T., Whaley, C., and Finlayson, E. Association of Reference Payment for Colonoscopy
With Consumer Choices, Insurer Spending, and Procedural Complications. JAMA Intern
Med. 2015;175(11):1783–1789.
32
Robinson, J.C. and Brown, T.T. (2013). Increases in Consumer Cost Sharing Redirect Patient Volumes and
Reduce Hospital Prices for Orthopedic Surgery. Health Affairs, 32(8).
17
Investigative Report: The Vermont State Employee Health Plan 12 November 2021Studies found no negative impacts on patient outcomes. In addition, other hospitals renegotiated their
contracts and/or reduced prices so that they could become designated sites of care, suggesting that
CalPERS was able to drive changes across the California health care system. 33
Figure 9. Examples of options for a CT scan of the chest for an employee living in Waterbury
Sources: BCBSVT negotiated prices at each hospital accessed via hospitals’ price transparency websites as of
10/20/21. Driving times were calculated using Google Maps.
33
Lechner, A., Gourevitch, R., and Ginsburg, P. (2013). The Potential of Reference Pricing to Generate Health
Care Savings: Lessons from a California Pioneer. Health System Change Research Brief No. 30.
18
Investigative Report: The Vermont State Employee Health Plan 12 November 2021Figure 10. Distribution of State employees by zip code with hospitals across Vermont
Sources: Employee zip code data provided by VTHR.
19
Investigative Report: The Vermont State Employee Health Plan 12 November 2021Table 6. Estimated savings using reference-based pricing at the midpoint across the 39 services in our sample
Estimated annual Savings as
Lowest priced Highest priced
Service Number Midpoint savings using % of
Service code and description site (median site (median
type of visits price reference pricing at current
price) price)
the midpoint spend
794 - neonate w other significant
61 $2,168 $18,031 $4,488 $217,536 46%
problems
807 - vaginal delivery without
sterilization/d&c without
102 $3,552 $11,279 $7,910 $132,709 15%
complications/medical
complications
Inpatient 470 - major joint replacement or
reattachment of lower extremity 49 $20,583 $41,491 $32,778 $100,990 6%
without medical complications
795 - normal newborn 102 $1,480 $4,082 $2,426 $49,624 17%
871 - septicemia without medical
ventilation 96+ hours with 12 $16,410 $34,100 $24,308 $40,350 14%
medical complications
74177 - computed tomography
(CT) of the abdomen and pelvis
366 $1,075 $3,505 $2,615 $190,853 18%
are performed concurrently; with
contrast
97140 - manual therapy
techniques (eg, mobilization/
3,242 $64 $228 $127 $168,853 28%
manipulation, manual lymphatic
Outpatient drainage, manual tract)
77067 - screening mammography
2,430 $249 $766 $399 $120,616 11%
bi 2-view breast inc cad
70553 - magnetic resonance (eg,
proton) imaging, brain (including
207 $1,648 $4,290 $3,287 $102,640 14%
brain stem); without contrast
material
20
Investigative
Vermont’s StateReport: TheHealth
Employee Vermont
PlanState EmployeeReport
Investigative Health Plan 12 November 2021 XX November 2021Estimated annual Savings as
Lowest priced Highest priced
Service Number Midpoint savings using % of
Service code and description site (median site (median
type of visits price reference pricing at current
price) price)
the midpoint spend
97110 - therapeutic procedure,
one or more areas, each
4,794 $83 $319 $190 $90,039 10%
15minutes; therapeutic exercises
to develop strength
45385 - colonoscopy flexible;
with removal of tumor(s) polyp(s)
278 $1,050 $3,816 $2,222 $65,075 11%
or other lesion(s) by snare
technique
45380 - colonoscopy flexible;
256 $1,050 $3,696 $2,176 $64,493 12%
with biopsy single or multiple
71260 - computerized axial
tomography, thorax; with 185 $473 $2,738 $1,648 $57,285 16%
contrast material(s)
45378 - colonoscopy flexible;
diagnostic including collection of
Outpatient
specimen(s) by brushing or 293 $770 $3,390 $2,004 $52,691 10%
washing when performed
(separate procedure)
J1745 - injection infliximab, 10
139 $2,484 $19,402 $11,074 $52,676 4%
mg
84443 - thyroid stimulating
3,900 $33 $204 $122 $50,634 13%
hormone (tsh)
85025 - blood count complete
6,496 $24 $101 $60 $41,509 13%
auto & auto difrntl wbc
80053 - comprehensive
6,339 $29 $146 $97 $37,200 7%
metabolic panel
73721 - magnetic resonance (eg,
proton) imaging, any joint of
198 $1,253 $3,199 $2,439 $36,550 8%
lower extremity; without contrast
material
21
Vermont’s StateReport:
Investigative Employee
TheHealth PlanState
Vermont Investigative
EmployeeReport
Health Plan 12 November 2021 XX November 2021Estimated annual Savings as
Lowest priced Highest priced
Service Number Midpoint savings using % of
Service code and description site (median site (median
type of visits price reference pricing at current
price) price)
the midpoint spend
88305 - level iv - surgical
pathology, gross and microscopic 1,544 $74 $481 $203 $35,289 8%
examination
72148 - magnetic resonance (eg,
proton) imaging, spinal canal and
145 $1,389 $3,001 $2,429 $29,517 8%
contents, lumbar; without
contrast material
80061 - lipid panel this panel
must include the following:
4,015 $33 $138 $83 $26,391 9%
cholesterol, serum, total (82465)
lipoprotein, ect.
93306 - echocardiography,
Outpatient transthoracic, real-time with
image documentation (2-d),
includes m-mode recording,
322 $310 $2,880 $1,782 $24,297 5%
when performed, complete, with
spectral doppler
echocardiography, and with color
flow
36415 - collection venous blood
11,052 $12 $38 $25 $12,435 5%
venipuncture
80048 - basic metabolic panel
2,279 $27 $95 $63 $12,048 8%
calcium total
J2505 - injection, pegfilgrastim, 6
39 $4,288 $15,545 $9,248 $7,065 2%
mg
99214 - office or other outpatient
visit for the evaluation and
Professional 13,228 $120 $188 $131 $174,085 9%
management of an established
patient
22
Vermont’s
Investigative
StateReport:
Employee
TheHealth
Vermont
PlanState
Investigative
EmployeeReport
Health Plan 12 November 2021 XX November 2021Estimated annual Savings as
Lowest priced Highest priced
Service Number Midpoint savings using % of
Service code and description site (median site (median
type of visits price reference pricing at current
price) price)
the midpoint spend
99213 - office or other outpatient
visit for the evaluation and
15,184 $80 $125 $89 $84,223 6%
management of an established
patient
99215 - office or other outpatient
visit for the evaluation and
1,050 $169 $267 $170 $43,857 20%
management of an established
patient
59400 - routine obstetric care
including antepartum care,
64 $2,192 $5,385 $2,192 $31,930 19%
vaginal delivery (with or without
episiotomy)
45380 - colonoscopy flexible;
Professional 227 $325 $1,135 $650 $40,135 24%
with biopsy single or multiple
99203 - office or other outpatient
visit for the evaluation and 1,985 $135 $212 $135 $24,113 8%
management of a new patient
99204 - office or other outpatient
visit for the evaluation and 737 $193 $303 $193 $19,292 12%
management of a new patient
45385 - colonoscopy flexible;
with removal of tumor(s) polyp(s)
205 $685 $1,281 $733 $36,196 19%
or other lesion(s) by snare
technique
99202 - office or other outpatient
visit for the evaluation and 689 $91 $143 $91 $7,459 11%
management of a new patient
23
Investigative
Vermont’s StateReport: TheHealth
Employee Vermont
PlanState EmployeeReport
Investigative Health Plan 12 November 2021 XX November 2021Estimated annual Savings as
Lowest priced Highest priced
Service Number Midpoint savings using % of
Service code and description site (median site (median
type of visits price reference pricing at current
price) price)
the midpoint spend
99212 - office or other outpatient
visit for the evaluation and
1,385 $54 $85 $55 $6,692 8%
management of an established
patient
90471 - immunization
administration (includes
percutaneous, intradermal, 3,866 $21 $50 $29 $6,375 6%
subcutaneous, or intramuscular
Professional injections)
45378 - colonoscopy flexible;
diagnostic including collection of
134 $482 $977 $545 $15,779 18%
specimen(s) by brushing or
washing when performed
66984 - extracapsular cataract
removal with insertion of
80 $1,138 $2,366 $1,338 $28,175 21%
intraocular lens prosthesis (one
stage procedure)
24
Investigative
Vermont’s StateReport: TheHealth
Employee Vermont
PlanState EmployeeReport
Investigative Health Plan 12 November 2021 XX November 2021Appendix B
Appendix B
Methods
Our objectives for this report were 1) to describe and quantify variation among prices paid to health
care providers for services commonly used by State employees and 2) to model potential savings if the
State adopted reference-based pricing or an incentive-based program. The sections below describe how
we approached these analyses, including a number of assumptions that we made when modeling
potential savings. Recognizing that adjustments may need to be made using more complete data, our
goal was to provide a reasonable representation of how these concepts could be deployed and to
inform ongoing conversations about opportunities for cost savings within the State health plan.
Median price data from hospitals and providers commonly utilized by State employees
The primary data for this report were provided by the Vermont Department of Human Resources (VTHR)
and the State’s third-party administrator, BCBSVT. The SAO first requested data regarding the State
employee health plan in 2015. At that time, BCBSVT provided deidentified median price data for the
State plan for the top 25 (by total cost) inpatient, outpatient, and professional services at the top 12
hospitals and providers utilized by State employees, retirees, and dependents. 34 BCBSVT also included
the number visits for each service at each site. The initial request covered claims incurred during
calendar year 2014 (paid through 3/31/15). Prices were provided for billed codes and did not necessarily
reflect all costs included in a visit (e.g., a code for an outpatient service, such as an MRI, does not include
the physician fee or other ancillary costs).
Earlier this year, we asked VTHR and BCBSVT to update this data for claims incurred during calendar year
2019 (paid through 6/16/21). In instances where the service codes used in 2014 were retired or
utilization did not meet the disclosure threshold, the next top utilized code (by volume of services
performed) was included. In addition, we asked BCBSVT to provide the minimum price, maximum price,
and total cost for each service at each site. We then narrowed our focus to services that were high
volume, high cost, and/or had high variability between the lowest median price and the highest median
price. We used the following criteria:
Volume Cost Variability
High volume: 250+ visits High cost: median is $1,000+ High variability: more than 2x
between min. and max.
We also included a number of other services, such as cataract removal, that were part of reference-
based pricing and incentive programs in other states. We excluded services that were offered at three or
fewer sites as well as emergency-based care. After applying these criteria, our final sample included 39
services.
For each of the 39 services, we compared the total number of visits covered under the State plan across
all providers to the number of visits captured in our sample of twelve providers to see what percentage
of total visits were captured in our sample. For the inpatient and outpatient services, our sample
34
Participants with Medicare as their primary insurer were excluded.
25
Investigative Report: The Vermont State Employee Health Plan 12 November 2021captured the majority of visits covered under the State plan. For the five inpatient services, our sample
included 75% to 93% of all State employees’ visits in 2019; for the 21 outpatient services, our sample
included 76% to 92% of all visits. However, a smaller percentage of visits were captured by the top
twelve providers of professional services, ranging from 6% to 55%. This is because these services are
more likely to be performed by smaller practices or independent doctors that were not well represented
in the top twelve providers in our sample (these providers generally represent the state’s largest
professional groups). For four professional codes (three codes related to colonoscopies and one code for
cataract removal), we requested updated data for the top twelve providers for each service (as opposed
to the top providers across all services) to capture a greater percentage of visits covered under the State
plan.
For services in which the highest median price was more than five times greater than the lowest median
price, we asked BCBSVT to explain what factors contributed to the high levels of variation. For most
services, the variation was due to “differences in provider charges.” In other words, BCBSVT pays a
provider more because the provider bills more for the exact same medical code. For neonatal care,
BCBSVT attributed the variation to a difference in reimbursement methodologies at different hospitals,
the duration of the newborn stay, and the diagnosis. The difference in price for an injection of infliximab
(a medication for autoimmune diseases) was attributed to the dosage and reimbursement method.
Modeling savings using reference-based pricing
For each service, we identified the midpoint (median) price across the providers or hospitals in our
sample. For example, of the eleven hospitals in our sample that offered a CT scan of the abdomen or
pelvis, the hospital with the highest median price was Hospital A at $3,505. The hospital with the lowest
median price was Hospital I at $1,075. And the midpoint (median) price across these eleven hospitals
was $2,615.
Service description CT of abdomen or pelvis
Total visits 366
Hospital Median Price Visits
Hospital A $3,505 94
Hospital B $3,449 94
Hospital F $3,418 15
Hospital L $3,270 12
Hospital E $2,969 25
Midpoint Hospital D $2,615 23
Hospital K $2,362 6
Hospital J $2,305 24
Hospital C $1,867 43
Hospital G $1,632 8
Hospital I $1,075 22
26
Investigative Report: The Vermont State Employee Health Plan 12 November 2021For each service, we looked at potential savings if the visits that occurred at sites with median prices
above the midpoint price were instead paid at the midpoint price (the reference price). Using the
example above, the difference between Hospital A’s median price ($3,505) and the midpoint ($2,615) is
$890. We then multiplied the savings per service by the number of visits at each site to calculate the
total estimated savings per site. For Hospital A, this totaled $83,702. We then totaled the potential
savings for each site to generate the estimated savings for each service.
Estimated
savings at
the
midpoint:
$190,853
Midpoint
One limitation of using median price data is that it is an imperfect representation of all the prices paid to
each site. In the example above, while the median price at Hospital A was $3,505, a portion of the
services at Hospital A were less expensive than the median price, some even below the midpoint price.
In these instances, there would be lower (or no) savings when moving to the reference price. However,
a portion of services at Hospital A were also more expensive than the median price, which would result
in higher savings if paid at the reference price. An analysis of all prices paid at each site would allow for a
more accurate estimate of potential savings.
We opted to use the midpoint price as the reference price because the midpoint price represents a
straightforward and realistic benchmark that half of hospitals in Vermont are already able to meet.
Using Medicare rates to establish reference prices – similar to Montana’s approach – is another strategy
that could be considered when exploring opportunities for reference-based pricing in Vermont.
Modeling savings using an incentive program
Similar to the reference-based pricing scenario, we focused on reducing the cost for visits that took
place at providers with prices above the midpoint. Because incentive programs require employees to
select care in advance, we narrowed our focus to seven types of services that are included in CMS’ list of
Shoppable Services. Table 4 combines similar types of codes. For example, we combined 1) colonoscopy
with biopsy, 2) colonoscopy with removal of a tumor, and 3) diagnostic colonoscopy into one category.
Drawing on New Hampshire’s experience, we estimated that 53% of State employees would utilize a
cost comparison tool. Recognizing that not all employees who shop will select lower priced care, we
27
Investigative Report: The Vermont State Employee Health Plan 12 November 2021You can also read