Surveillance of the Second Wave of COVID-19 in Europe: Longitudinal Trend Analyses
←
→
Page content transcription
If your browser does not render page correctly, please read the page content below
JMIR PUBLIC HEALTH AND SURVEILLANCE                                                                                                                      Post et al

     Original Paper

     Surveillance of the Second Wave of COVID-19 in Europe:
     Longitudinal Trend Analyses

     Lori Post1, PhD; Kasen Culler2, BSc; Charles B Moss3, PhD; Robert L Murphy4, MD; Chad J Achenbach5, MD, MPH;
     Michael G Ison5, MD, MSc; Danielle Resnick6, PhD; Lauren Nadya Singh1, MPH; Janine White1, MA; Michael J
     Boctor2, BSc; Sarah B Welch1, MPH; James Francis Oehmke1, PhD
     1
      Buehler Center for Health Policy and Economics, Feinberg School of Medicine, Northwestern University, Chicago, IL, United States
     2
      Feinberg School of Medicine, Northwestern University, Chicago, IL, United States
     3
      Institute of Food and Agricultural Sciences, University of Florida, Gainsville, FL, United States
     4
      Institute of Global Health, Feinberg School of Medicine, Northwestern University, Chicago, IL, United States
     5
      Divison of Infectious Disease, Feinberg School of Medicine, Northwestern University, Chicago, IL, United States
     6
      International Food Policy Research Institute, Washington DC, DC, United States

     Corresponding Author:
     Lori Post, PhD
     Buehler Center for Health Policy and Economics
     Feinberg School of Medicine
     Northwestern University
     420 E Superior
     Chicago, IL, 60611
     United States
     Phone: 1 203 980 7107
     Email: lori.post@northwestern.edu

     Abstract
     Background: The COVID-19 pandemic has severely impacted Europe, resulting in a high caseload and deaths that varied by
     country. The second wave of the COVID-19 pandemic has breached the borders of Europe. Public health surveillance is necessary
     to inform policy and guide leaders.
     Objective: This study aimed to provide advanced surveillance metrics for COVID-19 transmission that account for weekly
     shifts in the pandemic, speed, acceleration, jerk, and persistence, to better understand countries at risk for explosive growth and
     those that are managing the pandemic effectively.
     Methods: We performed a longitudinal trend analysis and extracted 62 days of COVID-19 data from public health registries.
     We used an empirical difference equation to measure the daily number of cases in Europe as a function of the prior number of
     cases, the level of testing, and weekly shift variables based on a dynamic panel model that was estimated using the generalized
     method of moments approach by implementing the Arellano-Bond estimator in R.
     Results: New COVID-19 cases slightly decreased from 158,741 (week 1, January 4-10, 2021) to 152,064 (week 2, January
     11-17, 2021), and cumulative cases increased from 22,507,271 (week 1) to 23,890,761 (week 2), with a weekly increase of
     1,383,490 between January 10 and January 17. France, Germany, Italy, Spain, and the United Kingdom had the largest 7-day
     moving averages for new cases during week 1. During week 2, the 7-day moving average for France and Spain increased. From
     week 1 to week 2, the speed decreased (37.72 to 33.02 per 100,000), acceleration decreased (0.39 to –0.16 per 100,000), and jerk
     increased (–1.30 to 1.37 per 100,000).
     Conclusions: The United Kingdom, Spain, and Portugal, in particular, are at risk for a rapid expansion in COVID-19 transmission.
     An examination of the European region suggests that there was a decrease in the COVID-19 caseload between January 4 and
     January 17, 2021. Unfortunately, the rates of jerk, which were negative for Europe at the beginning of the month, reversed course
     and became positive, despite decreases in speed and acceleration. Finally, the 7-day persistence rate was higher during week 2
     than during week 1. These measures indicate that the second wave of the pandemic may be subsiding, but some countries remain
     at risk for new outbreaks and increased transmission in the absence of rapid policy responses.

     (JMIR Public Health Surveill 2021;7(4):e25695) doi: 10.2196/25695

     https://publichealth.jmir.org/2021/4/e25695                                                          JMIR Public Health Surveill 2021 | vol. 7 | iss. 4 | e25695 | p. 1
                                                                                                                               (page number not for citation purposes)
XSL• FO
RenderX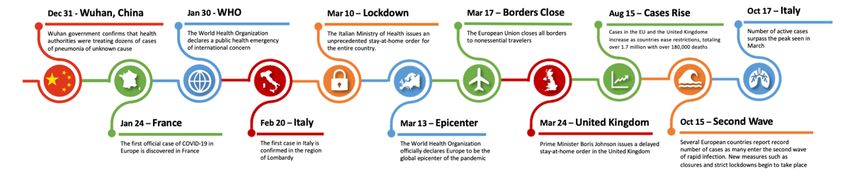
JMIR PUBLIC HEALTH AND SURVEILLANCE                                                                                                          Post et al

     KEYWORDS
     SARS-CoV-2 surveillance; wave two; second wave; global COVID surveillance; Europe Public Health Surveillance; Europe
     COVID; Europe surveillance metrics; dynamic panel data; generalized method of the moments; Europe econometrics; Europe
     SARS-CoV-2; Europe COVID surveillance system; European COVID transmission speed; European COVID transmission
     acceleration; COVID transmission deceleration; COVID transmission jerk; COVID 7-day lag; SARS-CoV-2; Arellano-Bond
     estimator; GMM; Albania; Andorra; Austria; Belarus; Belgium; Bosnia and Herzegovina; Bulgaria; Croatia; Czech Republic;
     Denmark; Estonia; Finland; France; Germany; Greece; Greenland; Hungary; Iceland; Ireland; Isle of Man; Italy; Latvia;
     Liechtenstein; Lithuania; Luxembourg; Moldova; Monaco; Montenegro; Netherlands; Norway; Poland; Portugal; Romania; San
     Marino; Serbia; Slovakia; Slovenia; Spain; Sweden; Switzerland; Ukraine; United Kingdom; Vatican City

                                                                           restrictions, with leaders reluctant to shut down businesses and
     Introduction                                                          quarantine citizens again [13,14]. As of February 9, 2021, the
     Background                                                            WHO reported 106,125,682 confirmed COVID-19 cases and
                                                                           2,320,497 deaths worldwide [15]. Collectively, 33,534,153
     The first European COVID-19 case was reported on January              COVID-19 cases have been reported in the EU and the United
     24, 2020, in France, with subsequent cases confirmed in               Kingdom, which have resulted in 740,733 deaths [4].
     Germany and Finland days later [1]. On March 11, 2020, the
     World Health Organization (WHO) declared that the spread of           The World Bank (WB), a global partnership dedicated to
     the novel coronavirus had exceeded the threshold of a pandemic        reducing poverty and increasing sustainable prosperity in
     [2] and, on March 13, 2020, the WHO declared Europe as the            developing nations, divides the world into regions based on
     global epicenter, when their caseload and deaths exceeded the         shared geographical, development, and cultural or historical
     combined caseload in the rest of the world [1] (See Figure 1).        features [16]. The Global SARS-CoV-2 Surveillance Project:
     The European Union (EU) closed all external borders on March          Policy, Persistence, & Transmission provides surveillance data
     17, 2020 [1]. Although the EU coordinated the COVID-19                [17] based on these WB-defined regions. The focus of this study
     response between member countries, individual governments             is on the spread of COVID-19 specifically within the Western
     enacted separate national policies and made individual decisions      European region, including Albania, Andorra, Austria, Belarus,
     regarding border closure and quarantine measures [3].                 Belgium, Bosnia and Herzegovina, Bulgaria, Croatia, Czech
     COVID-19 caseloads decreased for most European countries              Republic, Denmark, Estonia, Finland, France, Germany, Greece,
     after peaking in April and May [4].                                   Greenland, Hungary, Iceland, Ireland, Isle of Man, Italy, Latvia,
                                                                           Liechtenstein, Lithuania, Luxembourg, Moldova, Monaco,
     At present, European countries are experiencing a second wave         Montenegro, the Netherlands, Norway, Poland, Portugal,
     of COVID-19 [5-11]. The WHO has warned that the death                 Romania, San Marino, Serbia, Slovakia, Slovenia, Spain,
     counts in Europe could surpass the peak observed in April 2020        Sweden, Switzerland, Ukraine, the United Kingdom, and
     [12]. Nations worldwide are struggling to control COVID-19            Vatican City.
     transmission by imposing social isolation and economic
     Figure 1. Timeline of COVID-19–related events and decisions made (2020). EU: European Union; WHO: World Health Organization.

                                                                           family members [21]. Additionally, Southern European countries
     Outbreak and Governance                                               engage in physical greetings, with kisses on the cheek and
     Policies and Culture                                                  friendly hugs being common in Italy, Spain, and France [22].
                                                                           These cultural practices may be a contributing factor to the
     Analysis of COVID-19 cumulative incidence indicates that the
                                                                           increased transmission of COVID-19 and related mortality in
     drastic measures undertaken by the Italian government slowed
                                                                           the Southern European countries listed above, where the virus
     the spread of the disease to lower than the expected 7-10 days
                                                                           spread very rapidly and yielded severe adverse effects [23].
     after restrictions were implemented [18]. The rapid transmission
     was likely due to high population density [19], and the high          In contrast, in Northern European countries such as Sweden,
     case-fatality rate is associated with the older age distribution in   children tend to leave home earlier and frequently move farther
     Italy, wherein approximately 23% of the Italian population was        away from their parents, often to pursue higher education. A
     aged 65 years or older in 2019 [20].                                  “post-nuclear family structure” has developed more rapidly,
                                                                           and children in these countries may have less frequent contact
     Other factors that influenced the severity of the COVID-19 were
                                                                           with their families from an earlier age than those in the more
     family structures, which likely increased interaction among
                                                                           traditional Southern European countries [21]. Additionally,
     https://publichealth.jmir.org/2021/4/e25695                                              JMIR Public Health Surveill 2021 | vol. 7 | iss. 4 | e25695 | p. 2
                                                                                                                   (page number not for citation purposes)
XSL• FO
RenderX
JMIR PUBLIC HEALTH AND SURVEILLANCE Post et al
personal space is valued to a higher degree, and kissing is less activity; the future of the economy will be dependent on the
commonly used as a greeting compared to shaking hands or country’s ability to support investment and diversify exports
other less physical forms of greeting [24]. Sweden enacted less after the pandemic subsides [33].
strict policies than Southern European countries did and saw
Economic growth in Moldova had already declined sharply to
similar results as countries that enacted late-onset stringent
0.2% in late 2019, and the unemployment rate saw an increase
mandates [25]. It is worth noting that Sweden’s per capita
compared to 2018 [33]. Many citizens of Moldova rely heavily
COVID-19 death rate far outpaces that of its Scandinavian
on food self-provisioning or food sharing within village
neighbors, decreasing confidence in their mitigation strategies
networks [34]. Poverty is expected to increase in response to
[26]. At the other extreme lie countries such as Hungary, where
the COVID-19 pandemic, and the effects will likely impact
the Prime Minister pushed through legislation that allowed him
households with inadequate insurance mechanisms. The
to rule by decree for however long the pandemic continues and
maintenance of food security and economic stability will depend
mandates jail time for the spread of disinformation, leading to
on the government’s ability to alleviate food shortages and
concerns about restrictions on human rights and media freedoms
compensate for lost income, as well as to support jobs and
[27].
growth when the crisis subsides [33].
The United Kingdom, physically and organizationally separated
from its European neighbors since leaving the European Union,
Surveillance
took a delayed and somewhat hesitant approach to controlling Public health surveillance informs policy on “flattening the
the spread of the virus. The first two COVID-19 cases in the curve” of COVID-19 spread [17,35-37]. Epidemiologists have
nation were confirmed on January 31, 2020. The Department utilized various modeling techniques to forecast COVID-19
of Health and Social Care’s coronavirus action plan was case numbers and attributed deaths [38-42]. The European
approved on March 3, 2020, outlining the country’s plan to Center for Disease Control, the WHO, and the Center for
deploy four phased actions to deal with the pandemic: Contain, Systems Science and Engineering at Johns Hopkins University
Delay, Research, and Mitigate [28]. The government moved have developed tracking tools [11,38]. Although helpful, these
from the Contain phase to the Delay phase on March 12, 2020, static metrics are limited by incomplete case ascertainment and
after Italy had already locked down, and emphasized testing in data contamination [17,36]. Existing surveillance is a proxy for
hospital settings and not communities, with unrestricted entry the true COVID-19 caseload because public health surveillance
to the country via ports and airports [28]. On March 19, 2020, systems tend to pick up the most severe cases [43,44], which
COVID-19 was reclassified from level 4 to a milder threat level is especially problematic when tracking SARS-CoV-2 infections
(ie, level 3) by the Advisory Committee on Dangerous because most carriers are asymptomatic or presymptomatic or
Pathogens, allowing hospital infection control requirements to may have mild symptoms [45-48]. Therefore, public health
be lowered [28]. Finally, on March 24, 2020, the Prime Minister surveillance that can control for these limitations are needed.
declared an enforceable lockdown across the nation [28], but Moreover, metrics that detect the speed of transmission of the
COVID-19 spread rapidly throughout the United Kingdom, novel coronavirus, shifts in the pandemic, and acceleration of
leading Europe in COVID-19–related deaths at over 43,579 [4]. the speed and persistence of COVID-19 based on prior infections
Many European countries are experiencing a second wave of are needed to supplement existing measures.
infections, with surging daily case numbers in France, Spain,
Significance
the Netherlands, and the United Kingdom, and the WHO
warning that, within the coming months, daily death counts Ideally, the development of a more advanced methodology for
could surpass the April peak observed in Europe [12]. National tracking and estimating COVID-19 transmission in regions
governments are struggling to control the infection due to within Europe will allow for a more reliable analysis of which
increased pushback from local governments who are reluctant policies are effective and what other factors may be associated
to shut down businesses and quarantine citizens a second time with transmission rates. Public health departments, in addition
after being allowed to open up [13]. to several universities and media outlets, are tracking COVID-19
metrics by using raw data, including the number of new cases,
Economics and Food Insecurity diagnostic tests, positive results, transmission rates and deaths,
An important impact of the pandemic is the risk of food in addition to other measures such as local hospital capacity
insecurity in vulnerable nations such as Ukraine and Moldova [4,49-57]. To remove temporal effects, many surveillance
[29]. Much of the population in Ukraine lacks the ability to buy systems have shifted to 7-day moving averages to counter the
a sufficient amount of healthy food and often resides in dearth of reporting during holidays and weekends. Although
conflict-affected areas of the country. Moreover, the current moving averages temper volatility of data and testing or
pandemic threatens to impact Ukraine’s wheat exportation and reporting affects, surveillance is still limited by missing cases.
livestock processing, which could create even more scarcity in General public health surveillance is helpful and provides a
affordable food for its citizens [30,31]. Ukraine responded with proxy of the pandemic, but surveillance data are still limited by
early restrictive policies in response to widespread fear among significant bias due to undercounts, reporting delays, testing
citizens, and the country ended up reporting fewer cases than errors, dearth of testing, asymptomatic carriers, and other types
Russia and Belarus, indicating that its response was most likely of data contamination. In fact, surveillance systems are
effective in slowing disease transmission [32]. However, predicated on the fact that they tend to include only the more
economic growth in Ukraine was stable at 3.2% in 2019, but severe cases, whereas mild cases and undiagnosed infections
the pandemic has forced a sudden slowdown in economic and deaths are excluded [43,44].
https://publichealth.jmir.org/2021/4/e25695 JMIR Public Health Surveill 2021 | vol. 7 | iss. 4 | e25695 | p. 3
(page number not for citation purposes)
XSL• FO
RenderXJMIR PUBLIC HEALTH AND SURVEILLANCE Post et al
To that end, the objective of our study is to use a longitudinal from the GitHub repository [60]. This resulted in a panel of 39
trend analysis study design in concert with Dynamic Panel countries in Western Europe with 62 days in each panel
Modeling and Method of Moments to correct for existing (n=2418). Based on published reports [16,61], an empirical
surveillance data limitations [17,36]. Specifically, we will difference equation was specified in which the number of new
measure significant weekly shifts in the increase, decrease, or positive cases in each country at each day is a function of the
plateaued transmission of COVID-19. We will also measure prior number of cases, the level of testing, and weekly shift
the underlying causal effect from the previous week that persists variables that measure whether the contagion was growing
through the current week, with a 7-day persistence rate to faster, at the same speed, or slower than in the previous weeks.
explain a clustering-declustering effect. The 7-day persistence This resulted in a dynamic panel model that was estimated using
represents an underlying disease transmission wave, wherein a the generalized method of moments (GMM) approach by
large number of transmissions 7 days ago that resulted in a large implementing the Arellano-Bond estimator in R [17,36].
number of infections today then echoes forward into a large
number of new transmissions and, hence, a large number of Results
new cases 7 days forward. An example of the 7-day lag would
be large sporting events in the United Kingdom that drew huge Country Regression Results
crowds weekend after weekend even after new COVID-19 cases Regression results are presented for 39 European countries in
were confirmed in the country. Other potential “superspreader” Table 1. Weekly surveillance data presented in Tables 2-6 are
events such as the exportation of COVID-19 cases from a based in part on these regressions. Data for 44 European
popular ski town in the Austrian Alps back in March 2020 [58], countries were collected, but data for 5 countries were excluded
would certainly contribute to this persistence effect as well. In in the regression analysis due to missing data. The regression
summary, we will measure negative and positive shifts in the Wald statistic is significant (X28=4980; PJMIR PUBLIC HEALTH AND SURVEILLANCE Post et al
Table 2. Static surveillance metrics for European countries for the week of January 4-10, 2021.
Country New weekly Cumulative COVID- 7-day mov- Infection New week- Cumulative 7-day moving av- Deaths
COVID-19 cas- 19 cases ing average rate per ly deaths deaths due to erage of new rate per
es of new 100,000 pop- COVID-19 COVID-19–relat- 100,000
COVID-19 ulation ed deaths popula-
cases tion
Albania 562 63,595 593.86 19.53 8 1241 6.86 0.28
Andorra 0 8586 56.29 0.00 0 85 0.14 0
Austria 1651 380,722 2136.29 18.33 36 6723 57 0.40
Belarus 1833 212,201 1748.43 19.40 10 1517 9.43 0.11
Belgium 1569 664,263 2036 13.54 40 20,078 53.86 0.35
Bosnia & Herze- 254 115,633 426.86 7.74 25 4330 28.43 0.76
govina
Bulgaria 105 208,511 780 1.51 29 8126 64 0.42
Croatia 646 219,993 1005 15.74 26 4368 42.29 0.63
Czech Republic 8449 831,165 12,954.86 78.90 137 13,115 165 1.28
Denmark 1246 182,161 1829 21.51 28 1571 28.14 0.48
Estonia 427 33,516 626.43 32.19 5 283 5.57 0.38
Finland 198 38,590 259.71 3.57 0 586 3.57 0
France 159,44 2,840,864 18,269.86 24.43 151 67,885 388.71 0.23
Germany 948 1,929,410 20,787.71 1.13 339 40,936 877.86 0.40
Greece 445 144,738 662.71 4.27 36 5263 43.71 0.35
Hungary 1778 342,237 2034.57 18.41 94 10,648 109.14 0.97
Iceland 10 5890 19.43 2.93 0 35 0 0
Ireland 6886 147,613 6532.29 139.46 8 2344 12.14 0.16
Italy 18,625 2,276,491 17,292.14 30.80 361 78,755 489.00 0.60
Latvia 616 49,568 1010.14 32.66 31 849 24.14 1.64
Lithuania 1492 159,672 1862.14 54.81 26 2197 79.14 0.96
Luxembourg 0, 47,744 189.86 0.00 0 527 4.57 0.00
Malta 184 14,396 187.71 41.67 1 233 1.86 0.23
Moldova 298 149,391 502.57 7.39 9 3139 14.57 0.22
Netherlands 6655 885,098 7485.14 38.84 55 12,461 107.71 0.32
Norway 555 55,474 679.71 10.24 0 472 5.14 0
Poland 9133 1,385,522 9565.71 24.13 178 31,189 295.71 0.47
Portugal 7502 483,689 8062.14 73.57 102 7803 97.86 1.00
Romania 3082 671,284 4407.86 16.02 62 16,654 96.43 0.32
San Marino 0 2628 28.57 0.00 0 64 0.71 0
Serbia 3564 359,689 2259.86 40.79 69 3582 36.71 0.79
Slovakia 2973 208,209 2963.71 54.45 82 2919 85.86 1.50
Slovenia 763 139,281 2027.86 36.70 25 2998 27.86 1.20
Spain 0 2,050,360 17,442.14 0 0 51,874 148.14 0
Sweden 0 489,471 7441.71 0 0 9433 100.86 0.00
Switzerland 0 477,983 3669.57 0 14 8267 74.29 0.16
Ukraine 5322 1,150,265 6161.14 12.17 115 20,641 144.43 0.26
United Kingdom 55,026 3,081,368 59,809.86 81.06 567 81,567 918.57 0.84
Europe 158,741 22,507,271 208,581.43 26.52 2669 524,758 4649.43 0.45
https://publichealth.jmir.org/2021/4/e25695 JMIR Public Health Surveill 2021 | vol. 7 | iss. 4 | e25695 | p. 5
(page number not for citation purposes)
XSL• FO
RenderXJMIR PUBLIC HEALTH AND SURVEILLANCE Post et al
Table 3. Static surveillance metrics for European countries for the week of January 11-17, 2021.
Country New Cumulative 7-day moving Infection rate New week- Cumulative 7-day moving Deaths
weekly COVID-19 cases average of per 100,000 ly deaths deaths due to average of new rate per
COVID- new COVID- population COVID-10 COVID-19–re- 100,000
19 cases 19 cases lated deaths popula-
tion
Albania 474 67,690 585 16.47 7 1277 5.14 0.24
Andorra 45 9083 71 58.24 0 91 0.86 0
Austria 1267 393,778 1865.14 14.07 29 7082 51.29 0.32
Belarus 1924 22,5461 1894.29 20.36 9 1582 9.29 0.10
Belgium 1630 678,839 2082.29 14.06 39 20,435 51 0.34
Bosnia & Herzegov- 0 11,7011 196.86 0 0 4411 11.57 0
ina
Bulgaria 77 211,813 471.71 1.11 9 8483 51 0.13
Croatia 379 224,954 708.71 9.23 28 4616 35.43 0.68
Czech Republic 5253 889,159 8284.86 49.05 123 14,338 174.71 1.15
Denmark 889 189,767 1086.57 15.35 28 1776 29.29 0.48
Estonia 388 37,079 509 29.25 5 325 6 0.38
Finland 236 40,337 249.57 4.26 0 618 4.57 0
France 37,405 2,969,091 18,318.14 57.31 329 70,422 362.43 0.50
Germany 11,484 2,050,129 17,245.57 13.71 437 46,901 852.14 0.52
Greece 237 148,607 552.71 2.27 28 5469 29.43 0.27
Hungary 1241 351,828 1370.14 12.85 77 11,341 99 0.80
Iceland 0 5956 9.43 0 0 35 0 0
Ireland 2946 172,726 3587.57 59.66 13 2608 37.71 0.26
Italy 125,44 2,381,277 14,969.43 20.75 377 82,177 488.86 0.62
Latvia 567 55,664 870.86 30.06 17 978 18.43 0.90
Lithuania 836 167,516 1120.57 30.71 31 2445 35.43 1.14
Luxembourg 0 48,630 126.57 0 0 549 3.14 0
Malta 141 15,588 170.29 31.93 1 239 0.86 0.23
Moldova 214 152,854 494.71 5.30 5 3250 15.86 0.12
Netherlands 5643 925,355 5751 32.93 41 13,107 92.29 0.24
Norway 206 58,651 453.86 3.80 0 517 6.43 0.00
Poland 5970 1,435,582 7151.43 15.77 142 33,355 309.43 0.38
Portugal 10,385 549,801 9444.57 101.85 152 8861 151.14 1.49
Romania 2156 693,644 3194.29 11.21 57 17,221 81 0.30
San Marino 0 2778 21.43 0 0 65 0.14 0
Serbia 1317 372,533 1834.86 15.07 20 3750 24 0.23
Slovakia 573 223,325 2159.43 10.50 57 3475 79.43 1.04
Slovenia 569 149,125 1406.29 27.37 40 3180 26 1.92
Spain 0 2,252,164 28,829.14 0 0 53,314 205.71 0
Sweden 0 523,486 4859.29 0 0 10,323 127.14 0
Switzerland 0 495,228 2463.57 0 7 8682 59.29 0.08
Ukraine 6398 1,198,512 6892.43 14.63 130 21,767 160.86 0.30
United Kingdom 38,670 3,405,740 46,338.86 56.96 682 89,429 1123.14 1
Europe 152,064 23,890,761 17,7288 25.40 2920 558,494 4819.43 0.49
https://publichealth.jmir.org/2021/4/e25695 JMIR Public Health Surveill 2021 | vol. 7 | iss. 4 | e25695 | p. 6
(page number not for citation purposes)
XSL• FO
RenderXJMIR PUBLIC HEALTH AND SURVEILLANCE Post et al
Table 4. Novel surveillance metrics for European countries for the week of January 4-10, 2021.
Country Speeda (weekly average of Accelerationb (weekly aver- Jerkc (per 100,000 7-day persistence effect on
new daily cases per 100,000 age, per 100,000 population) population) speed (number of new daily
population) cases per 100,000 popula-
tion attributed to new cases
7 days ago)
Albania 20.64 0.57 0.67 9.48
Andorra 72.85 –4.81 –13.68 41.13
Austria 23.72 0.29 –1.11 13.20
Belarus 18.50 –604,7296.00 0.20 11.98
Belgium 17.57 0.90 –0.47 8.23
Bosnia & Herzegovina 13.01 –1.08 –3.08 7.71
Bulgaria 11.23 –0.14 –0.25 6.58
Croatia 24.48 –0.17 –4.16 16.75
Czech Republic 120.97 4.58 –8.31 55.90
Denmark 31.58 0.17 –0.15 22.78
Estonia 47.22 0.92 –0.90 24.14
Finland 4.69 0.08 –0.24 2.78
France 27.99 0.75 –2.90 12.66
Germany 24.81 –1.60 -3.64 12.81
Greece 6.36 0.08 –0.66 3.82
Hungary 21.06 0.70 –1.23 10.58
Iceland 5.69 0.42 –0.13 1.78
Ireland 132.29 5.57 1.38 27.34
Italy 28.60 1.03 –0.89 15.27
Latvia 53.55 0.36 –6.12 28.01
Lithuania 68.40 1.33 0.57 50.47
Luxembourg 30.33 0 0 16.50
Malta 42.51 3.20 –1.88 14.69
Moldova 12.46 0.42 0.46 9.59
Netherlands 43.68 –0.67 0.38 29.34
Norway 12.54 0.28 0.33 5.78
Poland 25.27 1.26 –0.15 13.75
Portugal 79.07 5.77 –2.97 27.46
Romania 22.91 0.04 –2.35 10.96
San Marino 84.20 0 0 49.73
Serbia 25.86 2.61 5.73 17.46
Slovakia 54.28 4.59 –1.52 31.29
Slovenia 97.54 0.14 -10.14 42.36
Spain 37.31 0 –203.00 13.43
Sweden 73.69 0 0 35.06
Switzerland 42.40 0 0 23.85
Ukraine 14.09 0.14 0.23 9.96
United Kingdom 88.10 –0.03 –0.50 46.37
Region 37.72 0.39 –1.30 18.97
https://publichealth.jmir.org/2021/4/e25695 JMIR Public Health Surveill 2021 | vol. 7 | iss. 4 | e25695 | p. 7
(page number not for citation purposes)
XSL• FO
RenderXJMIR PUBLIC HEALTH AND SURVEILLANCE Post et al
a
Speed: Daily positive cases per 100,000 population.
b
Acceleration: day-to-day change in the number of positive cases per day.
c
Jerk: week-over-week change in acceleration.
https://publichealth.jmir.org/2021/4/e25695 JMIR Public Health Surveill 2021 | vol. 7 | iss. 4 | e25695 | p. 8
(page number not for citation purposes)
XSL• FO
RenderXJMIR PUBLIC HEALTH AND SURVEILLANCE Post et al
Table 5. Novel surveillance metrics for the week of January 11-17, 2021.
Country Speeda (weekly average of Accelerationb (weekly aver- Jerkc (per 100,000 7-day persistence effect on
new daily cases per 100,000 age per 100,000 population) population) speed (number of new daily
population) cases per 100,000 popula-
tion attributed to new cases
7 days ago)
Albania 20.33 –0.44 –0.07 12.37
Andorra 91.89 8.32 9.24 43.68
Austria 20.71 –0.61 0.27 14.22
Belarus 20.05 0.14 –0.11 11.10
Belgium 17.97 0.08 –0.08 10.53
Bosnia & Herzegovina 6 –1.11 0.89 7.80
Bulgaria 6.79 –0.06 0.27 6.73
Croatia 17.26 –0.93 1.29 14.68
Czech Republic 77.36 –4.26 0.82 72.54
Denmark 18.76 –0.88 1.25 18.93
Estonia 38.37 –0.42 –0.88 28.32
Finland 4.50 0.10 0.44 2.81
France 28.06 4.70 9.05 16.78
Germany 20.58 1.80 3.16 14.88
Greece 5.30 –0.29 0.11 3.81
Hungary 14.18 –0.79 1.10 12.63
Iceland 2.76 –0.42 0.13 3.41
Ireland 72.66 –11.40 –6.74 79.33
Italy 24.76 –1.44 –0.57 17.15
Latvia 46.17 –0.37 0.68 32.11
Lithuania 41.16 -3.44 –0.71 41.02
Luxembourg 20.22 0 0 18.19
Malta 38.57 –1.39 0.87 25.49
Moldova 12.26 –0.30 –0.13 7.47
Netherlands 33.56 –0.84 0.87 26.19
Norway 8.37 –0.92 –0.39 7.52
Poland 18.90 –1.19 0.11 15.16
Portugal 92.62 4.04 1.98 47.41
Romania 16.60 –0.69 0.19 13.74
San Marino 63.15 0 –4.63 50.49
Serbia 21 –3.67 –5.95 15.51
Slovakia 39.55 –6.28 –0.98 32.55
Slovenia 67.64 –1.33 1.07 58.49
Spain 61.66 0 0 22.37
Sweden 48.12 0 0 44.18
Switzerland 28.47 0 0 25.42
Ukraine 15.76 0.35 –0.63 8.45
United Kingdom 68.26 –3.44 0.49 52.83
Europe 33.02 –0.16 1.37 22.62
https://publichealth.jmir.org/2021/4/e25695 JMIR Public Health Surveill 2021 | vol. 7 | iss. 4 | e25695 | p. 9
(page number not for citation purposes)
XSL• FO
RenderXJMIR PUBLIC HEALTH AND SURVEILLANCE Post et al
a
Speed: Daily positive cases per 100,000 population.
b
Acceleration: day-to-day change in the number of positive cases per day.
c
Jerk: week-over-week change in acceleration.
Table 6. Difference in 7-day persistence between the two study weeks.
Rank Week 1 (January 4-10, 2021) Week 2 (January 11-17, 2021)
Country Difference Country Difference
1 Czech Republic 55.90 Ireland 79.33
2 Lithuania 50.47 Czech Republic 72.54
3 San Marino 49.73 Slovenia 58.49
4 United Kingdom 46.36 United Kingdom 52.83
January 4-10, 2021. In the second week (January 11-17, 2021),
Interpretation: Europe Regression Results 7-day moving averages increased to 18,318 and 28,829 for
The lagging indicators and shift parameters suggested recent France and Spain, respectively. The 7-day moving average for
changes in disease transmission in Europe between November Germany, Italy, and the United Kingdom decreased to 17,245,
30, 2020, and January 17, 2021. The shift in the most recent 14 14,969, and 46,338, respectively. The infection rate per 100,000
days, or 2 weeks, was negative and statistically significant people during the week of January 4-10, 2021, was the highest
(PJMIR PUBLIC HEALTH AND SURVEILLANCE Post et al
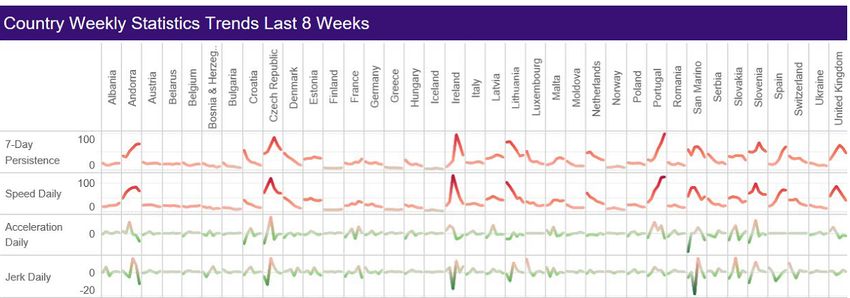
Figure 2. Weekly SARS-CoV-2 trends by country in Europe (December 7, 2020, to January 17, 2021; data source: [62]).
The 7-day persistence difference in Table 6 demonstrates the in the second week. San Marino slightly increased from 49.73
changes in 7-day persistence for the top 4 European countries to 50.49, but did not make it into the top 4 for the second week.
between January 4-10 and January 11-17, 2021, suggesting an
Among the top 5 countries by population (Table 7), Germany
underlying shift that significantly increased persistence for some
and France remained relatively stable, and the United Kingdom
countries but significantly decreased persistence for other
had the highest indicators of cause for alarm, with positive
countries during the week of January 11-17. Only two of the
increases in speed and persistence but slightly negative decreases
countries were in the top 4 for both weeks (ie, the Czech
in acceleration and jerk. Smaller countries such as the Czech
Republic and United Kingdom). Lithuania and San Marino were
Republic, Ireland, Andorra, and Portugal reported higher
in the top 4 for the first week, but Lithuania decreased to 41.01
positive increases in speed, acceleration, jerk, and persistence.
Table 7. Most populous European countries.
Country Population as of 2020
Germany 83,783,942
United Kingdom 67,886,011
France 65,273,511
Italy 60,461,826
Spain 46,754,778
that the speed was increasing at the beginning of the study period
Discussion but entered a downward trajectory by the end. However, jerk
Principal Results shifted from negative to positive during these two weeks,
indicating that the downward trend in acceleration was slowing
Thus far, European COVID-19 infection surveillance has toward the end of the study period. Interventions and continued
depended on static metrics with limited insight into longitudinal precautions will be necessary to maintain a decreasing 7-day
pandemic progression. Dynamic metrics provide an additional moving average of new cases and to continue the downward
lens for surveillance that better captures the evolving prevalence trajectory of speed and acceleration.
of disease. After combining static and dynamic metrics, some
European countries stand out as with the highest risk for Infection rates show the countries that were the hardest hit at
uncontrolled growth. These high-risk countries must maintain the time of data collection. The top 5 most populous countries
transmission mitigating policies if they are to protect their in Europe are Germany, the United Kingdom, France, Italy, and
citizens and the citizens of neighboring countries. Spain. Unsurprisingly, these 5 countries also had the largest
7-day moving averages for new infections during the study
Europe, as a region, is still experiencing high COVID-19 case period. The United Kingdom had the second highest infection
rates, but these appear to be trending downward as the region rate per 100,000 people during week 1 of the data collection,
emerges from its second wave. The 7-day moving average of along with the largest 7-day moving average of new cases. This
new cases showed a substantial decrease from 208,581 to finding indicates that the United Kingdom may be at risk of
177,288 between January 4 and January 17, 2021. The 7-day increasing transmission, but the infection rate per 100,000
moving average of COVID-19–related deaths, however, people decreased from 81.06 during week 1 to 56.94 in week
increased from the week of January 4-10 to the week of January 2, which is reassuring. Both the speed of virus transmission and
11-17, 2021. Speed of transmission in the region decreased and acceleration in the United Kingdom decreased over the recorded
acceleration shifted from positive to negative from week 1 to period as well, but jerk actually increased from –0.49 to 0.50,
week 2, suggesting that case rates may continue to trend and the country’s 7-day persistence was the fourth highest in
downward in coming weeks. This shift in acceleration implies Europe during both weeks, indicating that the United Kingdom
https://publichealth.jmir.org/2021/4/e25695 JMIR Public Health Surveill 2021 | vol. 7 | iss. 4 | e25695 | p. 11
(page number not for citation purposes)
XSL• FO
RenderXJMIR PUBLIC HEALTH AND SURVEILLANCE Post et al
does need to stay vigilant and ensure proper enforcement of Andorra’s population is relatively small for the region,
policies to reduce transmission in order to avoid another potentially insulating regional policy makers and agencies from
outbreak. an overwhelming surge in COVID-19 cases. In contrast, Spain
and Portugal are relatively large countries. Their caseloads and
France and Germany both reported increases in acceleration
positive dynamic metrics suggest that these two countries would
over the two weeks, and the jerk transitioned from a negative
require substantial effort to control the COVID-19 spread.
value to a positive value, putting both countries at risk of
Regional coordination would be essential given the size of these
experiencing increased growth in the coming weeks.
countries from a population and economic perspective.
Additionally, Spain had increasing speed and jerk, and its 7-day
Additionally, some countries such as the Czech Republic have
persistence effect increased over the 2-week period, indicating
very high 7-day persistence effects but decreasing speed and
an increase in forward echoes of COVID-19 cases present in
acceleration, indicating that the overall transmission in the
the country. Fortunately, Italy’s speed and acceleration both
country may be decreasing, but focused policy targeted toward
decreased over the recorded period, and the jerk was negative
preventing superspreader events may be helpful.
during both weeks, implying that mitigation strategies are
currently proving to be effective in Italy—the country that was Europe experienced a surge in COVID-19 transmission due to
initially one of the hardest hit. These 5 most populous countries the second wave of the pandemic [11,63-65]. Because infection
are responsible for a very significant portion of the total cases rates had significantly increased across Europe, many
in the European region, and they will likely require regional governments imposed strict lockdowns shutting down European
policy coordination for optimal control of virus transmission. economies again. Since SARS-CoV-2 cases were first reported
in Europe earlier in 2020, COVID-19–related research has kept
Some smaller countries in the region have also demonstrated
pace and, consequently, fewer deaths have been reported [61].
dynamic metrics that warrant concern, such as Andorra. The
The virus is still just as contagious and deadly, but targeted
speed increased from week 1 to week 2, and jerk and
therapies have resulted in attenuation of death rates across
acceleration both dramatically increased from negative to
countries [61].
positive values, indicating that more intense restrictions are
likely necessary to slow the spread. Ireland had the highest Limitations
infection rate per 100,000 people during week 1 of data Data are limited by granularity and collection method. Data
collection and the second highest infection rate during week 2. were collected at the country level, which precludes local
Additionally, Ireland had the largest speed and jerk and the analysis of surveillance trends. Moreover, data collection
second largest acceleration during week 1, thereby increasing mechanisms differ by country and may even differ by region
concern for a potential future outbreak in the country. However, within a given country. These different methods lead to weekend
all of these dynamic metrics decreased dramatically during week effects, missing data points, and other contamination.
2 (January 11-17, 2021), with acceleration and jerk actually
transitioning to negative values, supporting the idea that Comparison With Prior Work
Ireland’s mitigation strategy is proving to be effective, at least This study is part of a broader research program at Northwestern
during the time period in question. Feinberg School of Medicine, The Global SARS-CoV-2
Portugal was also at high risk of increased transmission, with Surveillance Project: Policy, Persistence, & Transmission. This
a transmission rate per 100,000 people in the top 5 countries of research program developed novel surveillance metrics to
the region during both weeks. With respect to novel dynamic include speed, acceleration, jerk, and 7-day persistence at the
metrics, Portugal had the largest positive acceleration in the country level [17,66]. We have also derived surveillance metrics
region during week 1 and the third largest in week 2. for all global regions.
Additionally, the country’s jerk increased from a negative value Conclusion
to a positive value and the 7-day persistence effect almost
Static and dynamic public health surveillance tools provide a
doubled from week to week. This finding indicates that Portugal
more complete picture of the progression of the COVID-19
should consider implementing new policies to reduce
pandemic across countries and regions. Although static
transmission and specifically to restrict the evolution of
measures, including infection rates and death rates, capture data
superspreader events, given the increase in 7-day persistence
at a given point in time, they are less successful in assessing
and the fact that Portugal had the second highest death rate per
population health over a period of weeks or months. By
100,000 people in the region during week 2 (January 11-17,
including speed, acceleration, jerk, and 7-day persistence, public
2021). Residents of Portugal were not only highly likely to
health officials may design policies with an eye to the future.
contract COVID-19 during this time period, but they were also
According to surveillance data, all countries in Europe that were
more likely to die of the disease than residents of most other
at the highest risk during the second wave of the COVID-19
European countries.
pandemic shared a number of characteristics. The United
Although some European countries showed signs of uncontrolled Kingdom, Spain, and Portugal demonstrated high infection
growth for the near future, many demonstrate decreasing rates, jerk, and 7-day persistence rates. Looking ahead, policy
dynamic metrics that provide reassurance that transmission is makers in these countries and the region at large should be
being controlled appropriately. However, based on these results, concerned about growth in the already substantial number of
countries with increasing dynamic metrics that are most at risk COVID-19 cases over the short term. Given the substantial
of outbreaks include Andorra, Portugal, and Spain. Fortunately, 7-day persistence rates in large countries such as the United
https://publichealth.jmir.org/2021/4/e25695 JMIR Public Health Surveill 2021 | vol. 7 | iss. 4 | e25695 | p. 12
(page number not for citation purposes)
XSL• FO
RenderXJMIR PUBLIC HEALTH AND SURVEILLANCE Post et al
Kingdom, Spain, and the Czech Republic, it is imperative that subsequent surveillance data using both static and dynamic tools
efforts be made to target superspreader events. Analysis of can help confirm the efficaciousness of new policies.
Acknowledgments
This study was partially supported by Feed the Future through the United States Agency for International Development, under
the terms of Contract No. 7200LA1800003. The opinions expressed herein are those of the authors and do not necessarily reflect
the views of the United States Agency for International Development.
Conflicts of Interest
None declared.
Multimedia Appendix 1
Tables S1-S10. Static and novel surveillance metrics for specific weeks.
[DOCX File , 54 KB-Multimedia Appendix 1]
Multimedia Appendix 2
Map showing global weekly explosive growth potential of COVID-19 cases.
[PNG File , 511 KB-Multimedia Appendix 2]
Multimedia Appendix 3
Map showing weekly speed of virus transmission by country in Europe.
[PNG File , 689 KB-Multimedia Appendix 3]
Multimedia Appendix 4
Map showing weekly acceleration/jerk by country in Europe.
[PNG File , 807 KB-Multimedia Appendix 4]
References
1. Linka K, Peirlinck M, Sahli Costabal F, Kuhl E. Outbreak dynamics of COVID-19 in Europe and the effect of travel
restrictions. Comput Methods Biomech Biomed Engin 2020 Aug;23(11):710-717 [FREE Full text] [doi:
10.1080/10255842.2020.1759560] [Medline: 32367739]
2. Cucinotta D, Vanelli M. WHO Declares COVID-19 a Pandemic. Acta Biomed 2020 Mar 19;91(1):157-160 [FREE Full
text] [doi: 10.23750/abm.v91i1.9397] [Medline: 32191675]
3. Goniewicz K, Khorram-Manesh A, Hertelendy AJ, Goniewicz M, Naylor K, Burkle FM. Current response and management
decisions of the European Union to the COVID-19 outbreak: A review. Sustainability 2020 May 08;12(9):3838. [doi:
10.3390/su12093838]
4. Weekly COVID-19 country overview. European Centre for Disease Prevention and Control. URL: https:/
/covid19-country-overviews.ecdc.europa.eu/ [accessed 2021-02-07]
5. Wise J. Covid-19: Risk of second wave is very real, say researchers. BMJ 2020 Jun 09;369:m2294. [doi: 10.1136/bmj.m2294]
[Medline: 32518177]
6. Middleton J, Lopes H, Michelson K, Reid J. Planning for a second wave pandemic of COVID-19 and planning for winter:
A statement from the Association of Schools of Public Health in the European Region. Int J Public Health 2020
Dec;65(9):1525-1527 [FREE Full text] [doi: 10.1007/s00038-020-01455-7] [Medline: 32857238]
7. Cacciapaglia G, Cot C, Sannino F. Second wave COVID-19 pandemics in Europe: a temporal playbook. Sci Rep 2020 Sep
23;10(1):15514 [FREE Full text] [doi: 10.1038/s41598-020-72611-5] [Medline: 32968181]
8. Grech V, Cuschieri S. Withdrawn: COVID-19: A global and continental overview of the second wave and its (relatively)
attenuated case fatality ratio. Early Hum Dev 2020 Oct 03:105211 [FREE Full text] [doi: 10.1016/j.earlhumdev.2020.105211]
[Medline: 33039260]
9. Seligmann H, Iggui S, Rachdi M, Vuillerme N, Demongeot J. Inverted covariate effects for first versus mutated second
wave Covid-19: High temperature spread biased for young. Biology (Basel) 2020 Aug 14;9(8):226 [FREE Full text] [doi:
10.3390/biology9080226] [Medline: 32823981]
10. Aleta A, Martín-Corral D, Piontti APY, Ajelli M, Litvinova M, Chinazzi M, et al. Modeling the impact of social distancing,
testing, contact tracing and household quarantine on second-wave scenarios of the COVID-19 epidemic. medRxiv. Preprint
posted online on May 18, 2020. [FREE Full text] [doi: 10.1101/2020.05.06.20092841] [Medline: 32511536]
https://publichealth.jmir.org/2021/4/e25695 JMIR Public Health Surveill 2021 | vol. 7 | iss. 4 | e25695 | p. 13
(page number not for citation purposes)
XSL• FO
RenderXJMIR PUBLIC HEALTH AND SURVEILLANCE Post et al
11. Win A. Rapid rise of COVID-19 second wave in Myanmar and implications for the Western Pacific region. QJM 2020
Dec 01;113(12):856-857 [FREE Full text] [doi: 10.1093/qjmed/hcaa290] [Medline: 33095232]
12. Reynolds E, Lister T. European nations smash Covid-19 records as WHO warns daily deaths could surpass April peak.
CNN. URL: https://www.cnn.com/2020/10/16/europe/europe-coronavirus-records-intl/index.html [accessed 2021-04-09]
13. Picheta R. European leaders face off against regions as a second wave engulfs continent. CNN. URL: https://www.cnn.com/
2020/10/18/europe/europe-coronavirus-restrictions-regions-intl/index.html [accessed 2021-04-09]
14. Stefana A, Youngstrom EA, Hopwood CJ, Dakanalis A. The COVID-19 pandemic brings a second wave of social isolation
and disrupted services. Eur Arch Psychiatry Clin Neurosci 2020 Sep;270(6):785-786 [FREE Full text] [doi:
10.1007/s00406-020-01137-8] [Medline: 32415510]
15. WHO Coronavirus (COVID-19) Dashboard. World Health Organization. URL: https://covid19.who.int/ [accessed 2021-02-03]
16. Kapur D, Lewis JP, Webb RC. The World Bank: Its First Half Century. Washington DC: Brookings Institution Press; 2011.
17. Oehmke JF, Moss CB, Singh LN, Oehmke TB, Post LA. Dynamic Panel Surveillance of COVID-19 Transmission in the
United States to Inform Health Policy: Observational Statistical Study. J Med Internet Res 2020 Oct 5;22(10):e21955
[FREE Full text] [doi: 10.2196/21955] [Medline: 32924962]
18. Sebastiani G, Massa M, Riboli E. Covid-19 epidemic in Italy: evolution, projections and impact of government measures.
Eur J Epidemiol 2020 Apr;35(4):341-345 [FREE Full text] [doi: 10.1007/s10654-020-00631-6] [Medline: 32306149]
19. Filippi AR, Russi E, Magrini SM, Corvò R. Letter from Italy: First practical indications for radiation therapy departments
during COVID-19 outbreak. Int J Radiat Oncol Biol Phys 2020 Jul 01;107(3):597-599 [FREE Full text] [doi:
10.1016/j.ijrobp.2020.03.007] [Medline: 32199941]
20. Onder G, Rezza G, Brusaferro S. Case-Fatality Rate and Characteristics of Patients Dying in Relation to COVID-19 in
Italy. JAMA 2020 May 12;323(18):1775-1776. [doi: 10.1001/jama.2020.4683] [Medline: 32203977]
21. Bordone V. Contact and proximity of older people to their adult children: a comparison between Italy and Sweden. Popul.
Space Place 2009 Jul;15(4):359-380. [doi: 10.1002/psp.559]
22. Fernandez J. Cross-cultural ethnology of greeting observances: From hands-free to hug-full. Legacy Volume Eight - Reading
Area Community College. 2009 May. URL: https://www.racc.edu/sites/default/files/imported/StudentLife/Clubs/Legacy/
pdf/LegacyVIII.pdf#page=82 [accessed 2020-11-14]
23. Ceylan Z. Estimation of COVID-19 prevalence in Italy, Spain, and France. Sci Total Environ 2020 Aug 10;729:138817
[FREE Full text] [doi: 10.1016/j.scitotenv.2020.138817] [Medline: 32360907]
24. Scroope C. Swedish Culture. The Cultural Atlas. 2017. URL: https://culturalatlas.sbs.com.au/swedish-culture [accessed
2020-11-14]
25. Kamerlin SCL, Kasson PM. anaging COVID-19 spread with voluntary public-health measures: Sweden as a case study for
pandemic control. Clin Infect Dis 2020 Dec 15;71(12):3174-3181 [FREE Full text] [doi: 10.1093/cid/ciaa864] [Medline:
32609825]
26. Habib H. Has Sweden's controversial covid-19 strategy been successful? BMJ 2020 Jun 12;369:m2376. [doi:
10.1136/bmj.m2376] [Medline: 32532807]
27. Resnick D. Trust in science and in government plays a crucial role in COVID-19 response. International Food Policy
Research Institute Blog. URL: https://www.ifpri.org/blog/trust-science-and-government-plays-crucial-role-covid-19-response
[accessed 2021-04-13]
28. Scally G, Jacobson B, Abbasi K. The UK's public health response to covid-19. BMJ 2020 May 15;369:m1932. [doi:
10.1136/bmj.m1932] [Medline: 32414712]
29. Swinnen J, McDermott J, editors. COVID-19 and global food security. Washington, DC: International Food Policy Research
Institute (IFPRI); 2020.
30. Klimova I. Food security in Ukraine and the world during a pandemic. Economics Management Innovations 2020;26(1):1-11
[FREE Full text] [doi: 10.35433/ISSN2410-3748-2020-1(26)-3]
31. Food Assistance Fact Sheet - Ukraine. USAID.gov. URL: https://www.usaid.gov/ukraine/food-assistance [accessed
2020-08-03]
32. Åslund A. Responses to the COVID-19 crisis in Russia, Ukraine, and Belarus. Eurasian Geography and Economics 2020
Jun 16;61(4-5):532-545. [doi: 10.1080/15387216.2020.1778499]
33. Europe and Central Asia Economic Update, Spring 2020: Fighting COVID-19. World Bank Group - Open Knowledge
Repository. 2020. URL: https://openknowledge.worldbank.org/handle/10986/33476 [accessed 2020-08-03]
34. Piras S. Home‐grown food and the benefits of sharing: The “intergenerational pact” in postsocialist Moldova. J Agrar
Change 2019 Dec 20;20(3):460-484. [doi: 10.1111/joac.12351]
35. Ibrahim NK. Epidemiologic surveillance for controlling Covid-19 pandemic: types, challenges and implications. J Infect
Public Health 2020 Nov;13(11):1630-1638 [FREE Full text] [doi: 10.1016/j.jiph.2020.07.019] [Medline: 32855090]
36. Oehmke JF, Oehmke TB, Singh LN, Post LA. Dynamic panel estimate-based health surveillance of SARS-CoV-2 infection
rates to inform public health policy: Model development and validation. J Med Internet Res 2020 Sep 22;22(9):e20924
[FREE Full text] [doi: 10.2196/20924] [Medline: 32915762]
https://publichealth.jmir.org/2021/4/e25695 JMIR Public Health Surveill 2021 | vol. 7 | iss. 4 | e25695 | p. 14
(page number not for citation purposes)
XSL• FO
RenderXJMIR PUBLIC HEALTH AND SURVEILLANCE Post et al
37. Foddai A, Lubroth J, Ellis-Iversen J. Base protocol for real time active random surveillance of coronavirus disease
(COVID-19) - Adapting veterinary methodology to public health. One Health 2020 Jun;9:100129 [FREE Full text] [doi:
10.1016/j.onehlt.2020.100129] [Medline: 32292815]
38. Dong E, Du H, Gardner L. An interactive web-based dashboard to track COVID-19 in real time. The Lancet Infectious
Diseases 2020 May;20(5):533-534. [doi: 10.1016/s1473-3099(20)30120-1]
39. Lin Y, Liu C, Chiu Y. Google searches for the keywords of "wash hands" predict the speed of national spread of COVID-19
outbreak among 21 countries. Brain Behav Immun 2020 Jul;87:30-32 [FREE Full text] [doi: 10.1016/j.bbi.2020.04.020]
[Medline: 32283286]
40. Sajadi MM, Habibzadeh P, Vintzileos A, Shokouhi S, Miralles-Wilhelm F, Amoroso A. Temperature, humidity and latitude
analysis to predict potential spread and seasonality for COVID-19. SSRN 2020 Mar 09:3550308. [doi: 10.2139/ssrn.3550308]
[Medline: 32714105]
41. Hamzah FAB, Lau CH, Nazri H, Ligot DV, Lee G, Tan CL, et al. CoronaTracker: worldwide COVID-19 outbreak data
analysis and prediction. Bull World Health Organ. Preprint posted online on March 19, 2020. [FREE Full text]
42. Petropoulos F, Makridakis S. Forecasting the novel coronavirus COVID-19. PLoS One 2020;15(3):e0231236 [FREE Full
text] [doi: 10.1371/journal.pone.0231236] [Medline: 32231392]
43. Thacker SB, Berkelman RL. Public health surveillance in the United States. Epidemiol Rev 1988;10:164-190. [doi:
10.1093/oxfordjournals.epirev.a036021] [Medline: 3066626]
44. Teutsch SM. Considerations in planning a surveillance system. In: Principles & Practice of Public Health Surveillance.
Online: Oxford Scholarship; Sep 2010:18-28.
45. Day M. Covid-19: four fifths of cases are asymptomatic, China figures indicate. BMJ 2020 Apr 02;369:m1375. [doi:
10.1136/bmj.m1375] [Medline: 32241884]
46. He J, Guo Y, Mao R, Zhang J. Proportion of asymptomatic coronavirus disease 2019: A systematic review and meta-analysis.
J Med Virol 2021 Feb;93(2):820-830 [FREE Full text] [doi: 10.1002/jmv.26326] [Medline: 32691881]
47. Al-Sadeq DW, Nasrallah GK. The incidence of the novel coronavirus SARS-CoV-2 among asymptomatic patients: A
systematic review. Int J Infect Dis 2020 Sep;98:372-380 [FREE Full text] [doi: 10.1016/j.ijid.2020.06.098] [Medline:
32623083]
48. An P, Song P, Wang Y, Liu B. Asymptomatic patients with novel coronavirus disease (COVID-19). Balkan Med J 2020
Jun 01;37(4):229-230 [FREE Full text] [doi: 10.4274/balkanmedj.galenos.2020.2020.4.20] [Medline: 32279479]
49. Daily Summary - Coronavirus (COVID-19) in the UK. Gov.UK. URL: https://coronavirus.data.gov.uk/ [accessed 2020-08-16]
50. About CoronaTracker. CoronaTracker.com. URL: https://www.coronatracker.com/about [accessed 2020-08-16]
51. Coronavirus in Ukraine. Webpage in Ukrainian. Ministry of Health of Ukraine. URL: https://covid19.gov.ua [accessed
2020-08-16]
52. Guardia AB, Pawelec H, Hirsch C. Coronavirus in Europe: Live data tracker. Politico. 2020 Mar 13. URL: https://www.
politico.eu/article/coronavirus-in-europe-by-the-numbers/ [accessed 2020-08-16]
53. Covid map: Coronavirus cases, deaths, vaccinations by country. BBC News. URL: https://www.bbc.com/news/
world-51235105 [accessed 2020-08-16]
54. Coronavirus tracker: the latest figures as countries fight the Covid-19 resurgence. The Financial Times. URL: https://www.
ft.com/content/a2901ce8-5eb7-4633-b89c-cbdf5b386938 [accessed 2020-08-16]
55. Coronavirus Disease 2019 (COVID-19) - Situation Report of the Robert Koch Institute. Robert Koch Institute. URL: https:/
/www.rki.de/EN/Content/infections/epidemiology/outbreaks/COVID-19/Situationsberichte_Tab.html [accessed 2020-08-16]
56. Daily Situation Report. Webpage in Italian. Ministry of Health of Italy. URL: http://www.salute.gov.it/portale/
nuovocoronavirus/homeNuovoCoronavirus.jsp? [accessed 2020-08-16]
57. Situación actual. Ministerio de Sanidad, Consumo y Bienestar Social. URL: https://www.mscbs.gob.es/en/profesionales/
saludPublica/ccayes/alertasActual/nCov-China/situacionActual.htm [accessed 2020-08-16]
58. Correa-Martínez CL, Kampmeier S, Kümpers P, Schwierzeck V, Hennies M, Hafezi W, et al. A pandemic in times of
global tourism: Superspreading and exportation of COVID-19 cases from a ski area in Austria. J Clin Microbiol 2020 May
26;58(6). [doi: 10.1128/jcm.00588-20]
59. Ritchie H, Ortiz-Ospina E, Beltekian D, Mathieu E, Hasell J, Macdonald B, et al. Coronavirus Pandemic (COVID-19) -
Statistics and Research. Our World in Data. URL: https://ourworldindata.org/coronavirus [accessed 2021-10-19]
60. Covid-19-data. URL: https://github.com/owid/covid-19-data [accessed 2021-04-13]
61. Kottasova C. Covid-19 deaths aren't rising as fast in Europe and US, despite soaring new infections. That doesn't mean the
virus is less deadly. CNN. 2020 Oct 28. URL: https://www.cnn.com/2020/10/28/europe/
coronavirus-death-rate-second-wave-lower-intl/index.html [accessed 2021-04-09]
62. Data Dashboard - The Global SARS-CoV-2 Surveillance Project (GASSP). Northwestern University. 2021. URL: https:/
/sites.northwestern.edu/covidglobalsurveillance/ [accessed 2021-04-11]
63. Moghnieh R, Abdallah D, Bizri AR. COVID-19: Second wave or multiple peaks, natural herd immunity or vaccine - We
should be prepared. Disaster Med Public Health Prep 2020 Sep 10:1-8 [FREE Full text] [doi: 10.1017/dmp.2020.349]
[Medline: 32907693]
https://publichealth.jmir.org/2021/4/e25695 JMIR Public Health Surveill 2021 | vol. 7 | iss. 4 | e25695 | p. 15
(page number not for citation purposes)
XSL• FO
RenderXJMIR PUBLIC HEALTH AND SURVEILLANCE Post et al
64. Lai JW, Cheong KH. Superposition of COVID-19 waves, anticipating a sustained wave, and lessons for the future. Bioessays
2020 Dec;42(12):e2000178 [FREE Full text] [doi: 10.1002/bies.202000178] [Medline: 33040355]
65. Standl F, Joeckel KH, Kowall B, Schmidt B, Stang A. Subsequent waves of viral pandemics, a hint for the future course
of the SARS-CoV-2 pandemic. medRxiv. Preprint posted online on July 14, 2020. [FREE Full text] [doi:
10.1101/2020.07.10.20150698]
66. Oehmke JF, Oehmke TB, Singh LN, Post LA. Dynamic panel estimate-based health surveillance of SARS-CoV-2 infection
rates to inform public health policy: Model development and validation. J Med Internet Res 2020 Sep 22;22(9):e20924
[FREE Full text] [doi: 10.2196/20924] [Medline: 32915762]
Abbreviations
EU: European Union
GMM: generalized method of moments
WB: World Bank
WHO: World Health Organization
Edited by G Eysenbach; submitted 11.11.20; peer-reviewed by J Walsh; comments to author 03.12.20; revised version received
11.02.21; accepted 04.04.21; published 28.04.21
Please cite as:
Post L, Culler K, Moss CB, Murphy RL, Achenbach CJ, Ison MG, Resnick D, Singh LN, White J, Boctor MJ, Welch SB, Oehmke JF
Surveillance of the Second Wave of COVID-19 in Europe: Longitudinal Trend Analyses
JMIR Public Health Surveill 2021;7(4):e25695
URL: https://publichealth.jmir.org/2021/4/e25695
doi: 10.2196/25695
PMID: 33818391
©Lori Post, Kasen Culler, Charles B Moss, Robert L Murphy, Chad J Achenbach, Michael G Ison, Danielle Resnick, Lauren
Nadya Singh, Janine White, Michael J Boctor, Sarah B Welch, James Francis Oehmke. Originally published in JMIR Public
Health and Surveillance (https://publichealth.jmir.org), 28.04.2021. This is an open-access article distributed under the terms of
the Creative Commons Attribution License (https://creativecommons.org/licenses/by/4.0/), which permits unrestricted use,
distribution, and reproduction in any medium, provided the original work, first published in JMIR Public Health and Surveillance,
is properly cited. The complete bibliographic information, a link to the original publication on https://publichealth.jmir.org, as
well as this copyright and license information must be included.
https://publichealth.jmir.org/2021/4/e25695 JMIR Public Health Surveill 2021 | vol. 7 | iss. 4 | e25695 | p. 16
(page number not for citation purposes)
XSL• FO
RenderXYou can also read


