Sustainability & CSR: The Relationship with Hofstede Cultural Dimensions - MDPI

Page created by Sheila Rose
 
CONTINUE READING
Sustainability & CSR: The Relationship with Hofstede Cultural Dimensions - MDPI
sustainability

Article
Sustainability & CSR: The Relationship with Hofstede
Cultural Dimensions
Minoo Tehrani 1, *, Andreas Rathgeber 2 , Lawrence Fulton 3                         and Bryan Schmutz 4

                                          1   Gabelli School of Business, Roger Williams University, Bristol, RI 02809, USA
                                          2   Finance & Information Management, Augsburg University, 86159 Augsburg, Germany;
                                              andreas.rathgeber@mrm.uni-augsburg.de
                                          3   School of Health Administration, Texas State University, San Marcos, TX 78666, USA; larry.fulton@txstate.edu
                                          4   School of Business, Western New England University, Springfield, MA 01119, USA; bryan.schmutz@wne.edu
                                          *   Correspondence: mtehrani@rwu.edu

                                          Abstract: This research explores the relationship between Hofstede’s femininity cultural dimension of
                                          quality of life and the masculinity cultural dimension of drive for success manifested by materialistic
                                          wealth by investigating the market value of the publicly traded firms appearing on the Dow Jones
                                          Sustainability Indices (DJSIs). The firms added to the DJSIs between the years 2010–2019 in countries
                                          with the femininity cultural dimension indicated by scores of ≤42, were selected for the first part of
                                          this study. In addition, France, with a masculinity score of 43 and Japan, with the highest masculinity
                                          score of 92, were chosen for comparison with the results from the countries with the femininity
                                          cultural dimension. The findings of this study indicate that companies in developed and emerging
                                          countries with the femininity cultural dimension show significant positive impact on their market
                                          values when added to the DJSIs. The publicly traded firms in France show a significant negative
                                          impact on their market values when added to the DJSIs. On the other hand, Japanese companies on
         
                                   the addition lists of DJSIs show a significant positive impact on their market values, despite Japan
Citation: Tehrani, M.; Rathgeber, A.;
                                          having the highest Hofstede masculinity score, a potential sign of cultural change in Japan.
Fulton, L.; Schmutz, B. Sustainability
& CSR: The Relationship with              Keywords: sustainability; CSR; DJSIs firm’s market value; Hofstede’s cultural dimensions; event study
Hofstede Cultural Dimensions.
Sustainability 2021, 13, 12052.
https://doi.org/10.3390/su132112052
                                          1. Introduction
Academic Editor: Andrea Pérez
                                                Numerous studies have utilized Hofstede’s cultural dimensions [1,2] to examine
                                          different nations [3–7]. These studies have investigated different aspects of Hofstede’s
Received: 2 October 2021
                                          cultural dimensions, such as the individualistic versus collectivist dimensions [4,7], and
Accepted: 25 October 2021
                                          uncertainty avoidance [8]. Meanwhile, other studies [9] have researched the relationship
Published: 1 November 2021
                                          between culture, corporate social responsibility (CSR), and impact on a firm’s performance.
                                                Investigating the relationship between the impact on the market values of the firms
Publisher’s Note: MDPI stays neutral
                                          that adopt sustainability strategies to achieve a net-zero carbon emission economy and
with regard to jurisdictional claims in
                                          enhancing the health and the welfare of communities has been the focus of several stud-
published maps and institutional affil-
iations.
                                          ies [10–15]. The Dow Jones sustainability indices (DJSIs) that report the engagement of
                                          corporations in sustainability practices along the social, economic, and environmental
                                          dimensions started more than twenty years ago. These indices have been used in dif-
                                          ferent studies to explore the extent of engagement in socially responsible sustainability
                                          practices [16–19]. Our research is novel in this area by utilizing Hofstede’s femininity and
Copyright: © 2021 by the authors.
                                          masculinity cultural dimensions to explore the relationship between the market values
Licensee MDPI, Basel, Switzerland.
                                          of the publicly traded firms when adopting socially responsible sustainability strategies
This article is an open access article
                                          manifested by appearance on the Dow Jones Sustainability Indices.
distributed under the terms and
conditions of the Creative Commons
Attribution (CC BY) license (https://
creativecommons.org/licenses/by/
4.0/).

Sustainability 2021, 13, 12052. https://doi.org/10.3390/su132112052                                      https://www.mdpi.com/journal/sustainability
Sustainability & CSR: The Relationship with Hofstede Cultural Dimensions - MDPI
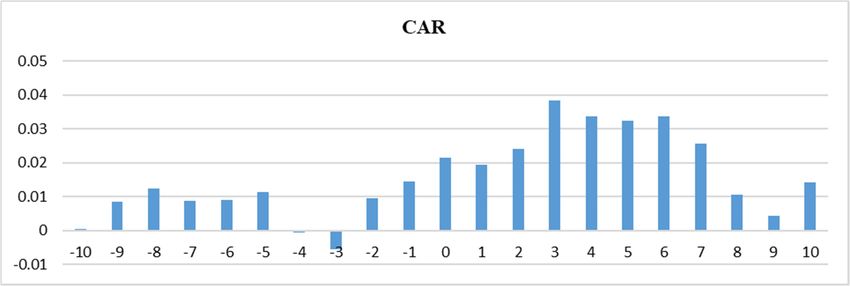
Sustainability 2021, 13, 12052                                                                                          2 of 17

                                 2. Literature Review and Research Goals
                                 2.1. Studies on Hofstede Cultural Dimensions
                                       Different studies have examined the relationship between culture and CSR [9] or the
                                 relationship between CSR among different groups of investors [18] and their impact on
                                 a firm’s performance. According to Shi and Veenstra [9], there is a strong relationship
                                 between the cultural aspects of a country (e.g., individualism), CSR, and performance
                                 of the firms in that country [9]. The findings of their study indicate that in countries
                                 with Hofstede’s collectivist cultural dimension, the shareholders value the engagement
                                 of the firms in socially responsible strategies indicated by positive impact on the financial
                                 performance of such companies. However, such an impact was not found in the countries
                                 that indicated Hofstede’s individualistic cultural dimension [9].
                                       Meanwhile, Lee et al. [18] studied different groups of investors and their reactions
                                 when the firms appeared on the DJSI in South Korea. The findings of their study indicate
                                 that governmental campaigns regarding CSR and appearance on the DSJI did not increase
                                 the market value of the firms [18].
                                       This research explores the relationship between appearance of the firms on the DJSIs,
                                 the impact of the market value of the firms, and Hofstede’s femininity and masculinity
                                 cultural dimensions. Based on Hofstede’s cultural theories, countries with low masculinity
                                 scores of ≤42 are considered cultures associated with attention to the quality of life [20].
                                 The adoption of sustainability strategies by different companies can enhance the health
                                 and the welfare and subsequently the quality of life in the communities around them.
                                 As a result, firms that adopt socially responsible strategies and contribute to enhancing
                                 the quality of life, as demonstrated by appearing on the Dow Jones Sustainability Indices,
                                 should be rewarded by increased stock prices upon the release of such news in the countries
                                 with the femininity cultural dimension.
                                       On the other hand, in the countries with masculinity scores of 43 and above, material-
                                 istic wealth is appreciated [20]. According to research exploring the relationship between
                                 the appearance of the firms on the DJSIs and the market value of such firms, investors
                                 may perceive the implementation of sustainability strategies to be costly to these compa-
                                 nies [14,21]. Consequently, companies in countries with the masculinity cultural dimension
                                 and appreciation for materialistic wealth [22] should experience negative impacts on their
                                 market value when added to the DJSIs due to the stockholders’ assumption that such
                                 strategies would be costly to the firm.

                                 2.2. Research Goals
                                      To investigate the relationship between the appearance of firms on the DJSIs and
                                 market value, this research selected companies that were added to the DJSIs between the
                                 years 2010 to 2019 in countries with Hofstede’s masculinity scores of ≤42, indicative of the
                                 femininity cultural dimension. The first proposal to be examined is delineated below:
                                 1.   There is a significant positive relationship between the market value of publicly traded
                                      companies and appearance on the DJSIs in countries characterized with the femininity
                                      cultural dimension (Hofstede’s masculinity score of ≤42).
                                      This study investigated this proposal by examining the list of countries with the
                                 femininity cultural dimension whose companies have been added to the Dow Jones Sus-
                                 tainability Indices between the years 2010–2019 include European and also emerging
                                 countries.
                                      The second proposal of this research considers the strict sustainability rules and
                                 regulations delineated by Paris Accord [23] and the European Union’s net-zero carbon
                                 emission goals [24]. As a result, the second proposal compares the addition of the European
                                 publicly traded firms to the DJSIs and the impact on their market values versus other listed
                                 companies from emerging countries. This proposal is presented below:
                                 2.   Publicly traded companies added to the DJSIs between the years 2010–2019 from
                                      the corresponding European countries with the femininity cultural dimension are
Sustainability & CSR: The Relationship with Hofstede Cultural Dimensions - MDPI
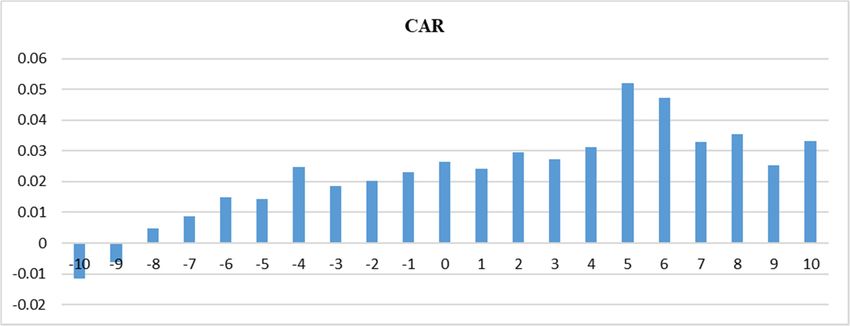
Sustainability 2021, 13, 12052                                                                                           3 of 17

                                      expected to see a higher significant positive impact on their market value compared
                                      to listed companies from the corresponding emerging countries.
                                      To further explore the differences between countries with the femininity cultural
                                 dimension and the countries with the masculinity cultural dimension, firms in two more
                                 countries were added to this research, France and Japan. France, with a masculinity score
                                 of 43, is considered halfway between the masculinity and femininity cultural dimensions.
                                 Japan, with the highest masculinity score of 92 is assumed to have the highest appreciation
                                 for material wealth. The proposals to be explored in this part of the research include:
                                 3.   There is a mixed significant negative or positive relationship between the market
                                      value of publicly traded French companies and their appearance on the DJSIs in
                                      France, a country with a Hofstede’s masculinity score of 43, halfway between the
                                      femininity and masculinity cultural dimensions.
                                 4.   There is a significant negative relationship between the market value of publicly
                                      traded Japanese companies and appearance on the DJSIs in Japan, a country with the
                                      highest Hofstede’s masculinity score of 92.

                                 3. Methodology
                                 3.1. Selected Countries
                                      Hofstede Insights web site [25] was used to identify countries with a masculinity score
                                 of 42 and below, which comprise the countries with the femininity cultural dimension.
                                 During the years 2010–2019, the Dow Jones Sustainability Indices for the World, Europe,
                                 Asia Pacific, Korea, Emerging Markets, and MILA (Mercado Integrado Latinamericano)
                                 Pacific Alliance, were used to identify the companies that appeared on these lists in
                                 countries with the masculinity score of ≤42. As a result, we identified ten countries. Table 1
                                 presents the list of these countries.

                                 Table 1. Countries with masculinity score of ≤42, indicating femininity cultural dimension,
                                 2010–2019.

                                                     Country                              Masculinity Cultural Score
                                                     Sweden                                            5
                                                     Norway                                            8
                                                 The Netherlands                                      14
                                                    Denmark                                           16
                                                     Finland                                          26
                                                      Chile                                           28
                                                     Portugal                                         31
                                                    Thailand                                          34
                                                   South Korea                                        39
                                                      Spain                                           42

                                       As indicated in Table 1, there are ten countries on the DJSIs that fit the definition of
                                 countries with the femininity cultural dimension. Seven of these countries are located in
                                 Europe, with the northern European countries indicating the lowest masculinity scores
                                 (5–26). Portugal (31) and Spain (42) are the other European countries on the list. All the
                                 European countries on the above list have signed the Paris Accord and, with the exception
                                 of Norway, all of them are members of the European Union. The rest of the countries on
                                 this list are from Latin America and Asia and are considered emerging countries. They
                                 include Chile (28), South Korea (39), and Thailand (34).
                                       Table 2 presents the companies in the European countries on Table 1 that appeared on
                                 the DJSI World and DJSI Europe during the years 2010–2019.
Sustainability & CSR: The Relationship with Hofstede Cultural Dimensions - MDPI
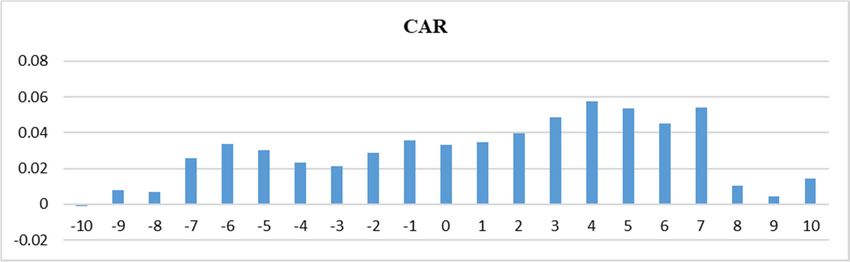
Sustainability 2021, 13, 12052                                                                                                  4 of 17

                                 Table 2. List of the companies on the Dow Jones Sustainability addition lists and their corresponding
                                 European countries with the femininity cultural dimension (scores of ≤42), 2010–2019.

                                      e             Index                        Company                             Country
                                    2010        DJSI World                      Aegon N.V.                      The Netherlands
                                    2010        DJSI Europe                     Aegon N.V.                      The Netherlands
                                    2010        DJSI Europe                   Royal KPN N.V.                    The Netherlands
                                    2010        DJSI Europe            Portugal Telecom SGPS S/A                    Portugal
                                    2010        DJSI World         Gamesa Corporacion Tecnologica S.A.               Spain
                                    2010        DJSI World                Red Electrica Corp. S.A                    Spain
                                    2011        DJSI Europe                     Orkla ASA                           Norway
                                    2011        DJSI Europe                   Atlas Copco AB                        Sweden
                                    2011        DJSI Europe                Svenska Cellulosa AB                     Sweden
                                    2012        DJSI Europe                UPM-Kymmene OYJ                          Finland
                                    2012        DJSI Europe                     Aegon NV                        The Netherlands
                                    2012        DJSI Europe                Koninklijke Ahold NV                 The Netherlands
                                    2012        DJSI Europe                    Telenor ASA                          Norway
                                    2012        DJSI Europe               Amadeus IT Holding SA                      Spain
                                    2012        DJSI World                 Hennes & Mauritz AB                      Sweden
                                    2013        DJSI World                    ING Groep NV                      The Netherlands
                                    2013        DJSI Europe                 ASML Holding NV                     The Netherlands
                                    2013        DJSI Europe                   ING Groep NV                      The Netherlands
                                    2013        DJSI World                     Telefonica SA                         Spain
                                    2014        DJSI World                     Telefonica SA                         Spain
                                    2015        DJSI World                     Telefonica SA                         Spain
                                    2016        DJSI Europe                 Novo Nordisk A/S                       Denmark
                                    2016        DJSI Europe                    Iberdrola SA                          Spain
                                    2017        DJSI World                  ASML Holding NV                     The Netherlands
                                    2018        DJSI World          Banco Bilbao Vizcaya Argentaria SA               Spain
                                    2018        DJSI Europe         Banco Bilbao Vizcaya Argentaria SA               Spain
                                    2018        DJSI Europe                      Essity AB                          Sweden
                                    2019        DJSI Europe           Telfonaktiebolaget LM Ericsson                Sweden

                                       Table 3 presents the list of the companies from the emerging countries with the
                                 femininity cultural dimension (scores of ≤42) on the Dow Jones Sustainability addition
                                 lists during the years 2010–2019. The indices included DJSI World, DJSI Korea, DJSI Asia
                                 Pacific, DJSI MILA Pacific Alliance, and DJSI Emerging Markets.
                                       Table 4 presents the French companies on the Dow Jones Sustainability addition lists
                                 collected from DJSI Europe and DJSI World during the years 2010–2019.
                                       Table 5 presents the Japanese companies on the Dow Jones Sustainability lists, DJSI
                                 World, and DJSI Asia Pacific, during the years 2010–2019.
Sustainability & CSR: The Relationship with Hofstede Cultural Dimensions - MDPI
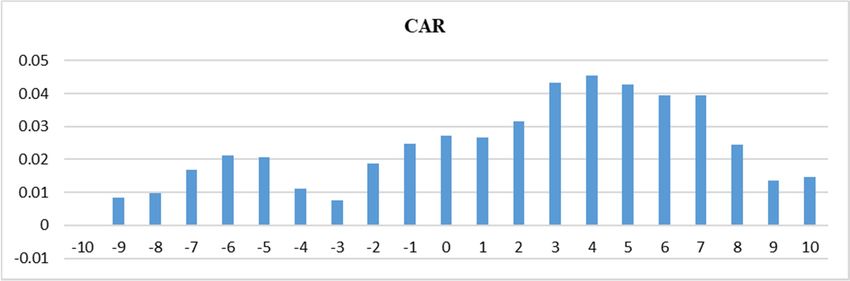
Sustainability 2021, 13, 12052                                                                                                   5 of 17

                                 Table 3. The list of the companies on the Dow Jones Sustainability addition lists and their associated
                                 emerging countries with the femininity cultural dimension (scores of ≤42), 2010–2019.

                                   Year                 Index                                Company                        Country
                                   2010              DJSI World                          KT&G Corp.                         S. Korea
                                   2011              DJSI World                     Hyundai Mobis Co. Ltd.                  S. Korea
                                   2011              DJSI Korea                    Hynix Semiconductor Inc.                 S. Korea
                                   2011              DJSI Korea                  Samsung Engineering Co. Ltd.               S. Korea
                                   2011              DJSI Korea               Samsung Heavy Industries Co. Ltd.             S. Korea
                                   2012              DJSI Korea                     Hanjin Shipping Co Ltd.                 S. Korea
                                   2012              DJSI Korea                           KCC Corp.                         S. Korea
                                   2012              DJSI Korea                 Samsung Life Insurance Co Ltd.              S. Korea
                                   2012            DJSI Asia Pacific            Samsung Life Insurance Co Ltd.              S. Korea
                                   2013              DJSI World                Shinhan Financial Group Co Ltd.              S. Korea
                                   2013              DJSI Korea                     Hanwha Chemical Corp.                   S. Korea
                                   2013              DJSI Korea                LG Household & Health Care Ltd.              S. Korea
                                   2013              DJSI Korea                      Samsung C&T Corp.                      S. Korea
                                   2013            DJSI Asia Pacific        Samsung Fire & marine Insurance Co Ltd.         S. Korea
                                   2015        DJSI Emerging Markets                    SACI Falabella                        Chile
                                   2015        DJSI Emerging Markets              Advanced Info Service PCL                 Thailand
                                   2016        DJSI Emerging Markets                  Kasikornbank PCL                      Thailand
                                   2016        DJSI Emerging Markets                  Thai Beverage PCL                     Thailand
                                   2017              DJSI World                   Samsung Electronics Co Ltd.               S. Korea
                                   2017            DJSI Asia Pacific              Samsung Electronics Co Ltd.               S. Korea
                                   2017        DJSI Emerging Markets                     CP ALL PCL                         Thailand
                                   2018       DJSI MILA Pacific Alliance               Enel Americas SA                       Chile
                                   2018       DJSI MILA Pacific Alliance                 Enel Chile SA                        Chile
                                   2018       DJSI MILA Pacific Alliance        Inversiones La Construccion SA                Chile
                                   2018        DJSI Emerging Markets                   Enel Americas SA                       Chile

                                 Table 4. French companies on the Dow Jones Sustainability addition lists, 2010–2019.

                                      Year.              Index                         Company                           Country
                                      2010           DJSI Europe                 Klepierre S.A.                           France
                                      2011           DJSI World              Schneider Electric S.A                       France
                                      2011           DJSI World               Societe Generale S.A                        France
                                      2011           DJSI Europe                 Alcatel-Lucent                           France
                                      2011           DJSI Europe                  Alstom S.A                              France
                                      2011           DJSI Europe             Societe Generale S.A.                        France
                                      2013           DJSI Europe                     Kering                               France
                                      2013           DJSI Europe       LVMH-Moët Hennessy Louis Vuitton SA                France
                                      2013           DJSI Europe              Societe Generale SA                         France
                                      2015           DJSI World                    GDF Suez                               France
                                      2015           DJSI World               Societe Generale SA                         France
                                      2015           DJSI World                     Vinci SA                              France
                                      2015           DJSI Europe                BNP Paribas SA                            France
                                      2015           DJSI Europe                      Sanofi                              France
                                      2015           DJSI Europe              Societe Generale SA                         France
                                      2016           DJSI World             Essilor International SA                      France
                                      2016           DJSI Europe            Essilor International SA                      France
                                      2016           DJSI Europe                   TOTAL SA                               France
                                      2017           DJSI Europe                 CapgeminiSA                              France
                                      2019           DJSI Europe                BNP Paribas SA                            France
                                      2019           DJSI Europe                      Sanofi                              France
Sustainability 2021, 13, 12052                                                                                               6 of 17

                                 Table 5. Japanese companies on the Dow Jones Sustainability addition lists, 2010–2019.

                                   Year             Index                                Company                          Country
                                  2010           DJSI World                        Nippon Yusen K.K                        Japan
                                  2010         DJSI Asia Pacific                   Seiko Epson Corp.                       Japan
                                  2010         DJSI Asia Pacific                Yokogawa Electric Corp.                    Japan
                                  2011         DJSI Asia Pacific                  Asahi Glass Co. Ltd.                     Japan
                                  2011         DJSI Asia Pacific                  Astellas Pharma Inc.                     Japan
                                  2011         DJSI Asia Pacific                       Itochu Corp.                        Japan
                                  2011         DJSI Asia Pacific                     Mitsubishi Corp.                      Japan
                                  2011         DJSI Asia Pacific                Mitsubishi Estate Co. Ltd.                 Japan
                                  2011         DJSI Asia Pacific           Mitsubishi UFJ Financial Group Inc.             Japan
                                  2011         DJSI Asia Pacific                   NTT DoCoMo Inc.                         Japan
                                  2011         DJSI Asia Pacific          Sumitomo Mitsui Trust Holdings Inc.              Japan
                                  2012         DJSI Asia Pacific                         JSR Corp.                         Japan
                                  2012         DJSI Asia Pacific                 Kirin Holdings Co Ltd.                    Japan
                                  2012         DJSI Asia Pacific                   Nitto Denko Corp.                       Japan
                                  2012         DJSI Asia Pacific                      Sysmex Corp.                         Japan
                                  2012         DJSI Asia Pacific                    Tokyu Land Corp.                       Japan
                                  2013           DJSI World                          ITOCHU Corp.                          Japan
                                  2013         DJSI Asia/Pacific             Daiwa House Industry Co Ltd.                  Japan
                                  2013         DJSI Asia/Pacific                       Eisai Co Ltd.                       Japan
                                  2013         DJSI Asia/Pacific                       Inpex Corp.                         Japan
                                  2013         DJSI Asia/Pacific                     ITOCHU Corp.                          Japan
                                  2013         DJSI Asia/Pacific            Sumitomo Electric Industries Ltd.              Japan
                                  2015           DJSI World                          Mitsubishi Corp.                      Japan
                                  2015           DJSI World                      Nomura Holdings Inc.                      Japan
                                  2015         DJSI Asia Pacific                 Honda Motor Co Ltd.                       Japan
                                  2015         DJSI Asia Pacific                Mizuho Financial Group                     Japan
                                  2015         DJSI Asia Pacific                      Terumo Corp.                         Japan
                                  2016           DJSI World                         Bridgestone Corp.                      Japan
                                  2016           DJSI World                      Nissan Motor Co Ltd.                      Japan
                                  2016         DJSI Asia Pacific                 Fast Retailing Co Ltd.                    Japan
                                  2016         DJSI Asia Pacific                     Mitsui & Co Ltd.                      Japan
                                  2016         DJSI Asia Pacific       MS&AD Insurance Group Japan Holdings Inc.           Japan
                                  2016         DJSI Asia Pacific                  NTT DOCOMO Inc.                          Japan
                                  2016         DJSI Asia Pacific                   Tokyo Electron Ltd.                     Japan
                                  2017           DJSI World                      Honda Motor Co Ltd.                       Japan
                                  2017           DJSI World                         NTT Docomo Inc.                        Japan
                                  2017         DJSI Asia Pacific                      Kubota Corp.                         Japan
                                  2017         DJSI Asia Pacific            Mitsubishi Heavy Industries Ltd.               Japan
                                  2017         DJSI Asia Pacific                   Sekisui House Ltd.                      Japan
                                  2018           DJSI World               Nippon Telegraph & Telephone Corp.               Japan
                                  2018         DJSI Asia Pacific             Chugai Pharmaceutical Co Ltd.                 Japan
                                  2018         DJSI Asia Pacific                      Ricoh Co Ltd.                        Japan
                                  2018         DJSI Asia Pacific               Tokio Marine Holdings Inc.                  Japan
                                  2019           DJSI World                  Takeda Pharmaceutical Co Ltd.                 Japan
                                  2019         DJSI Asia Pacific                       Eisai Co Ltd.                       Japan
                                  2019         DJSI Asia Pacific                 Meiji Holdings Co Ltd.                    Japan
                                  2019         DJSI Asia Pacific                     Olympus Corp.                         Japan
                                  2019         DJSI Asia Pacific                Recruit Holdings Co Ltd.                   Japan

                                 3.2. Statistical Analyses
                                      Studies on the information released in the capital markets and the impacts on the
                                 stock prices of the companies have often utilized event study methods [26–29]. According
                                 to these studies, a firm’s value can be examined based on the new available information in
                                 the capital markets. Utilizing event study, one can investigate the impact on a firms’ stock
                                 price of the release of such information within short windows of time [29]. As a result,
                                 event study can indicate the positive impact on the abnormal rate of returns (ARRs) when
                                 the released information is considered beneficial, or it can show negative abnormal rate
Sustainability 2021, 13, 12052                                                                                          7 of 17

                                 of returns when the market assumes that the released information is harmful [30]. The
                                 market model is often utilized to estimate ARRs [31,32]. The market model allows for
                                 the calculation of the correlation between stock price and expected or normal return on
                                 or around a window of time when specific information (the event) is released to capital
                                 markets [31,32]. The market model uses a short window before the event and assesses the
                                 abnormal returns (AR) on the stock. In addition, a short window is used after the event to
                                 allow for the calculation of the abnormal rate of returns (ARRs), which is the return due
                                 to the new information about the company (i.e., event), the cumulative abnormal returns
                                 (CAR), and cumulative average abnormal returns (CAARs) [31,32].
                                       This research utilizes event study to explore the impact of addition to the Dow Jones
                                 Sustainability Indices on the companies’ stock prices in the European countries presented
                                 in Table 2 and in the emerging countries presented in Table 3. Since France is halfway
                                 between the femininity and masculinity cultural dimensions with a score of 43, the French
                                 companies presented in Table 4 are also examined. Furthermore, the Japanese companies
                                 that were added to the DJSIs during the years 2010–2019 (Table 5) are also examined, and
                                 the results are compared with the companies in the countries with the femininity cultural
                                 dimension (Tables 2 and 3).
                                       All stock prices of the companies under the study were taken from the corresponding
                                 country’s stock market exchanges and currency within the years 2010–2019. The stock
                                 market exchanges for collecting the European stock prices included DJSI World and DJSI
                                 Europe. The currencies for the European countries included Norwegian Krone, Danish
                                 Krone, Swedish Krona, and for the rest, Euro. For South Korea, the currency used for the
                                 statistical analyses was the Won, and for Chile, the Chilean Peso. This information was
                                 collected from the corresponding stock market exchanges: DJSI Korea, DJSI Asia Pacific,
                                 DJSI MILA Pacific Alliance, DJSI World, and DJSI Emerging Markets. For Thailand, we
                                 had to use the Singapore dollar for one company (Thai Beverage), but the rest of the Thai
                                 companies’ stock prices were evaluated with Thai Baht. For France, DJSI World and DJSI
                                 Europe with Euro as the currency comprised the data. For Japan, DJSI World and DJSI Asia
                                 Pacific were used to collect the data with Japanese Yen as the currency.

                                 4. Results
                                      In order to investigate the impact of the addition to the DJSI lists for the countries
                                 with the femininity cultural dimensions, event study was utilized. Stock prices, within
                                 windows starting at most 10 days before and ending at most 10 days after the event, were
                                 investigated to evaluate the cumulative abnormal returns (CARs) for firms in the countries
                                 with Hofstede masculinity score of ≤42. Table 6 and Figure 1 present the results of this
                                 part of the study.

                                 Table 6. Daily cumulative abnormal returns (CARs) around the announcement dates for companies
                                 added to the DJSI in countries with Hofstede masculinity scores of ≤42, 2010–2019.

                                                               Additions to the DJSIs 2010–2019
                                                                            N = 49
                                          Day                    CAR                     Day                    CAR
                                          −10                   −0.0003                    1                   0.0268
                                          −9                    0.0083                     2                   0.0316
                                          −8                    0.0098                     3                   0.0434
                                          −7                    0.0170                     4                   0.0455
                                          −6                    0.0211                     5                   0.0428
                                          −5                    0.0206                     6                   0.0394
                                          −4                    0.0111                     7                   0.0394
                                          −3                    0.0076                     8                   0.0246
                                          −2                    0.0188                     9                   0.0137
                                          −1                    0.0248                    10                   0.0148
                                           0                    0.0271
−6                       0.0211                        5                         0.0428
                                       −5                       0.0206                        6                         0.0394
                                       −4                       0.0111                        7                         0.0394
                                       −3                       0.0076                        8                         0.0246
Sustainability 2021, 13, 12052         −2                       0.0188                        9                         0.0137            8 of 17
                                       −1                       0.0248                       10                         0.0148
                                        0                       0.0271

      Figure
      Figure 1.
             1. Daily
                Daily cumulative
                      cumulative abnormal
                                  abnormal returns (CARs) around
                                           returns (CARs)  around the
                                                                   the announcement
                                                                       announcement date
                                                                                    date [[−10,
                                                                                          −10, 10]
                                                                                                10] for
                                                                                                    for the
                                                                                                        the companies
                                                                                                            companies added
                                                                                                                      added to
                                                                                                                            to
      the DJSIs for countries with Hofstede masculinity scores of ≤42.
      the DJSIs for countries with Hofstede masculinity scores of ≤42.

                                       As
                                       As presented
                                            presentedininTable
                                                             Table6 and
                                                                      6 and Figure
                                                                                Figure1, the event
                                                                                          1, the    study
                                                                                                  event     usingusing
                                                                                                         study    a symmetric    10-day10-day
                                                                                                                         a symmetric       event
                                 window     [−10, 10]
                                 event window       [−shows
                                                        10, 10] that
                                                                  shows   addition   to the DJSIs
                                                                            that addition      to theresult
                                                                                                      DJSIsinresult
                                                                                                               a positive   impact on
                                                                                                                     in a positive       the cu-
                                                                                                                                     impact   on
                                 mulative    abnormal    returns    (CARs)     after  the  announcement      for the
                                 the cumulative abnormal returns (CARs) after the announcement for the companies in   companies    in countries
                                 with   the femininity
                                 countries                cultural dimension.
                                             with the femininity                       As indicated
                                                                         cultural dimension.           in Table in
                                                                                                  As indicated   6 and
                                                                                                                    TableFigure
                                                                                                                           6 and1,Figure
                                                                                                                                    this impact
                                                                                                                                          1, this
                                 is more   pronounced      from    1–7    days  after  the  announcement
                                 impact is more pronounced from 1–7 days after the announcement date.         date.
                                       In
                                       In the
                                          the event
                                               event study,     CAARs were
                                                       study, CAARs          were compared
                                                                                    compared to   to the
                                                                                                     the expected
                                                                                                         expected market
                                                                                                                     market model
                                                                                                                              model and
                                                                                                                                      and then
                                                                                                                                            then
                                 evaluated
                                 evaluated forfor statistically
                                                  statistically significant indicators. Simple t-tests were conducted to evaluate
                                 the
                                 the significance
                                      significanceofofthe thefindings.
                                                               findings.Table      7 is7the
                                                                               Table          event
                                                                                          is the     study
                                                                                                  event     analysis
                                                                                                         study         for four
                                                                                                                 analysis   for different   win-
                                                                                                                                four different
                                 dows:
                                 windows:[−10,[−
                                               10],
                                                 10,[−2,
                                                     10],2],
                                                           [−[−5,
                                                               2, 2],5],[−and  [−1,
                                                                           5, 5],   1].[−1, 1].
                                                                                  and

                                 Table                                     returns (CAARs)
                                 Table 7. Cumulative average abnormal returns      (CAARs) around
                                                                                            around the
                                                                                                     the announcement
                                                                                                         announcement date
                                                                                                                        date[[−10,
                                                                                                                             −10, 10]
                                 for the companies added   (N = 49) to the DJSIs in the countries with femininity cultural dimension,
                                 for the companies added (N = 49) to the DJSIs in the countries with femininity cultural dimension,
                                 Hofstede’s
                                 Hofstede’s score
                                            score of
                                                  of ≤42,
                                                     ≤42,2010–2019.
                                                          2010–2019.
                                                                                                                      t-Test
                                                                                                                          t-Test
                                              Days
                                               Days                            CAAR
                                                                                  CAAR                               p-Value
                                                                                                                         p-Value
                                            [−10,
                                              [−10,10]10]                      1.480%
                                                                                    1.480%                            0.1974
                                                                                                                          0.1974
                                             [−2,
                                               [−2]2, 2]                     2.404%   *** ***
                                                                                  2.404%                              0.0031
                                                                                                                          0.0031
                                               [ − 5, 5]
                                             [−5, 5]                         2.166% ** **
                                                                                   2.166%                                 0.0445
                                                                                                                      0.0445
                                               [ − 1, 1]
                                             [−1, 1]                                0.799%
                                                                               0.799%                                     0.1129
                                                                                                                      0.1129
                                 Note: Significant differences have been bolded. **, p < 0.01, ***, p < 0.001.
                                 Note: Significant differences have been bolded. **, p < 0.01, ***, p < 0.001.

                                       As indicated
                                      As   indicated in
                                                      in Table
                                                          Table7,7,the
                                                                    theannouncement
                                                                         announcementofofthe     addition
                                                                                               the  addition to to
                                                                                                                thethe
                                                                                                                     DJSIs hashas
                                                                                                                       DJSIs     a significant
                                                                                                                                     a signifi-
                                 positive   impact  on  the cumulative     average  abnormal     returns  (CAARs)
                                 cant positive impact on the cumulative average abnormal returns (CAARs) of the compa- of the  companies     in
                                 countries    with femininity   cultural   dimension    for [ − 2, 2] and  [ − 5, 5] windows.
                                 nies in countries with femininity cultural dimension for [−2, 2] and [−5, 5] windows.
                                       The results
                                      The    results of
                                                     of this
                                                         this part
                                                              part of
                                                                    of the
                                                                       the research
                                                                            research indicate
                                                                                      indicate support
                                                                                                 supportfor forProposal
                                                                                                                 Proposal11of   ofthis
                                                                                                                                   thisstudy.
                                                                                                                                         study.
                                 There   was   a significant   positive   relationship  between     the market      values
                                 There was a significant positive relationship between the market values of the publicly     of the   publicly
                                 traded companies
                                 traded   companies and and their
                                                              their appearance
                                                                     appearance on on the
                                                                                       the Dow
                                                                                            Dow Jones
                                                                                                   Jones Sustainability
                                                                                                          Sustainability Indices
                                                                                                                              Indices inin the
                                                                                                                                            the
                                 countries characterized
                                 countries    characterized with
                                                              with the
                                                                    the femininity
                                                                         femininity cultural
                                                                                     cultural dimension
                                                                                                dimension by   by having
                                                                                                                   having the
                                                                                                                            the masculinity
                                                                                                                                 masculinity
                                 score of ≤42. Based on these results, there was a significant increase in the stock prices
                                 of the companies when they were added to the Dow Jones Sustainability Indices in the
                                 countries with femininity cultural dimension. These results provide further support for
                                 Hofstede’s concept that the countries with low masculinity scores value quality of life that
                                 is manifested in this study by rewarding the companies that adopt socially responsible
                                 strategies with the potential of enhancing the health and the welfare of the communities.
                                       In the following event study analysis, the impact of the addition of the companies
                                 to the DJSIs on the cumulative abnormal returns (CARs) for the developed countries
                                 (The Netherlands, Spain, Sweden, Norway, Denmark, Finland) were compared with those
                                 in emerging countries (South Korea, Chile, Thailand). Tables 8 and 9 and Figures 2 and 3
Sustainability 2021, 13, 12052                                                                                                 9 of 17

                                   present the results of this part of the study. There was only one company from Portugal
                                   during the years 2010–2019 that was added to the DJSI, but the company was privately
                                   held and thus excluded from further analysis.

                                   Table 8. Daily cumulative abnormal returns (CARs) around the announcement date [−10, 10] for the
                                   companies added to the DJSIs in the developed countries with Hofstede’s masculinity score of ≤42,
                                   2010–2019.

                                                      Additions to the DJSIs, 2010–2019—Developed Countries
                                                                               N = 24
                                             Day                    CAR                       Day                     CAR
                                             −10                   −0.0012                      1                    0.0347
                                             −9                    0.0081                       2                    0.0395
                                             −8                    0.0070                       3                    0.0487
                                             −7                    0.0256                       4                    0.0578
                                             −6                    0.0339                       5                    0.0537
                                             −5                    0.0304                       6                    0.0453
                                             −4                    0.0233                       7                    0.0539
                                             −3                    0.0212                       8                    0.0106
                                             −2                    0.0286                       9                    0.0044
                                             −1                    0.0355                      10                    0.0143
                                              0                    0.0331

                                   Table 9. Daily cumulative abnormal returns (CARs) around the announcement date [−10, 10] for
                                   companies added to the DJSIs in the emerging countries with Hofstede’s masculinity score of ≤42,
                                   2010–2019.

                                                       Additions to the DJSIs, 2010–2019—Emerging Countries
                                                                                N = 25
                                             Day                    CAR                       Day                     CAR
                                             −10                   0.0005                       1                    0.0193
                                             −9                    0.0085                       2                    0.0241
                                             −8                    0.0124                       3                    0.0384
                                             −7                    0.0087                       4                    0.0337
                                             −6                    0.0089                       5                    0.0323
                                             −5                    0.0112                       6                    0.0337
                                             −4                    −0.0006                      7                    0.0255
                                             −3                    −0.0055                      8                    0.0106
                                             −2                    0.0095                       9                    0.0044
Sustainability 2021, 13, x FOR PEER REVIEW   −1                    0.0145                      10                    0.0143   10 of 17
                                              0                    0.0214

      Figure
      Figure 2.
             2. Daily
                Daily cumulative
                      cumulative abnormal
                                 abnormal returns  (CARs) around
                                           returns (CARs) around the
                                                                  the announcement
                                                                      announcement date
                                                                                      date [[−10,
                                                                                            −10, 10]
                                                                                                  10] for
                                                                                                      for the
                                                                                                          the companies
                                                                                                              companies added
                                                                                                                        added to
                                                                                                                              to
      the DJSI in the developed countries with Hofstede’s masculinity score of ≤42, 2010–2019.
      the DJSI in the developed countries with Hofstede’s masculinity score of ≤42, 2010–2019.
Sustainability 2021, 13, 12052                                                                                                10 of 17
      Figure 2. Daily cumulative abnormal returns (CARs) around the announcement date [−10, 10] for the companies added to
      the DJSI in the developed countries with Hofstede’s masculinity score of ≤42, 2010–2019.

      Figure 3.
      Figure 3. Daily
                Daily cumulative abnormal returns
                      cumulative abnormal  returns (CARs)
                                                   (CARs) around
                                                          around the
                                                                  the announcement
                                                                      announcementdatedate[[−10,
                                                                                           −10, 10]
                                                                                                 10] for
                                                                                                     for companies added to
                                                                                                         companies added to the
                                                                                                                            the
      DJSIs in the emerging countries with Hofstede’s masculinity score of ≤42, 2010–2019.
      DJSIs in the emerging countries with Hofstede’s masculinity score of ≤42, 2010–2019.

                                       As presented in Tables
                                                        Tables 8 and 9 and Figures 2 and 3, the event study using a symmetric
                                                                                                                           symmetric
                                 10-day event
                                         event window
                                                window[−10,[−10,10]
                                                                  10]shows
                                                                       showsthat addition
                                                                              that  additionto to
                                                                                               thethe
                                                                                                    DJSIs for for
                                                                                                       DJSIs   the the
                                                                                                                    companies
                                                                                                                       companiesin de-
                                                                                                                                    in
                                 veloped   countries with   the femininity  cultural  dimension     results in  a positive
                                 developed countries with the femininity cultural dimension results in a positive impact   impact   on
                                 cumulative
                                 on cumulativeabnormal
                                                  abnormalreturns  on day
                                                              returns      1 after
                                                                        on day     the announcement
                                                                                1 after  the announcement date.date.
                                                                                                                  However,   for com-
                                                                                                                        However,   for
                                 panies  added
                                 companies      to the
                                             added      DJSIs
                                                    to the     in emerging
                                                            DJSIs in emergingcountries
                                                                               countrieswith
                                                                                           withthe
                                                                                                 thefemininity
                                                                                                     femininitycultural
                                                                                                                  culturaldimension,
                                                                                                                           dimension,
                                 this impact
                                      impact was
                                              wasmore
                                                    morepronounced
                                                           pronounced   onon
                                                                          dayday   2 after
                                                                               2 after      the announcement
                                                                                       the announcement      date. date.  Ininstances,
                                                                                                                    In both  both in-
                                 stances, the positive
                                 the positive           impact continued
                                              impact continued     through through     daythe
                                                                             day 7 after    7 after the announcement
                                                                                              announcement       date.    date.
                                       To provide support for the results of the event study presented in Tables 8 and 9, a
                                 market model analysis was conducted. The results are presented in Tables     Tables 1010 and
                                                                                                                          and 11.
                                                                                                                               11.

                                 Table 10. Cumulative average
                                                       average abnormal
                                                               abnormal returns
                                                                          returns (CAARs)
                                                                                   (CAARs) around
                                                                                           aroundthe
                                                                                                   theannouncement
                                                                                                       announcementdate    −10, 10]
                                                                                                                     date[[−10,
                                 for companies  added (N = 24) to the DJSIs in developed countries with Hofstede masculinity  score
                                     companies added (N = 24) to the DJSIs in developed countries with Hofstede masculinity score of
                                 of ≤42, 2010–2019.
                                 ≤42, 2010–2019.
                                                                                                                   t-Test
                                                                                                                 t-Test
                                             Event
                                           Event   Window
                                                 Window                                  CAAR
                                                                                      CAAR                        p-Value
                                                                                                                p-Value
                                                 [−10,
                                              [−10, 10]10]                                 1.534%
                                                                                      1.534%                       0.1214
                                                                                                                 0.1214
                                               [−2, 2] 2]
                                                  [−2,                                    1.826%
                                                                                     1.826% **   **                0.0038
                                                                                                                 0.0038
                                               [−5, 5] 5]
                                                  [−5,                               1.978%  **
                                                                                          1.978% **              0.0217
                                                                                                                   0.0217
                                               [−1, 1] 1]
                                                  [−1,                                0.611%
                                                                                           0.611%                0.1095
                                                                                                                   0.1095
                                 Note: Significant differences have been bolded. **, p < 0.01.
                                 Note: Significant differences have been bolded. **, p < 0.01.

                                 Table 11. Cumulative average abnormal returns (CAARs) around the announcement date [−10, 10]
                                 Table 11. Cumulative average abnormal returns (CAARs) around the announcement date [−10, 10]
                                 for companies
                                 for companies added
                                                added (N
                                                       (N== 25)
                                                            25)to
                                                                tothe
                                                                   theDJSIs
                                                                      DJSIsininemerging
                                                                                emergingcountries
                                                                                         countrieswith
                                                                                                   withHofstede
                                                                                                        Hofstedemasculinity
                                                                                                                 masculinityscores of
                                                                                                                              scores
                                 ≤42,
                                 of ≤42,2010–2019.
                                         2010–2019.

                                                                                                                 t-Test
                                           Event Window                               CAAR
                                                                                                                p-Value
                                              [−10, 10]                               1.429%                     0.3270
                                               [−2, 2]                               2.959% **                   0.0330
                                               [−5, 5]                                2.346%                     0.1567
                                               [−1, 1]                                0.980%                     0.2091
                                 Note: Significant differences have been bolded. **, p < 0.01.

                                      As indicated in Table 10, the results of the model market study for companies added to
                                 the DJSIs in the developed countries support the event study results shown in Table 8. The
                                 announcement of addition to the DJSIs has a significant positive impact on the cumulative
                                 abnormal returns of companies (CAARs) in the developed countries with masculinity score
                                 of ≤42 for the windows [−2, 2] and [−5, 5] as indicated by (**) in Table 10. However, as
                                 presented in Table 11, the results of the market model analysis for the companies added
Sustainability 2021, 13, 12052                                                                                                    11 of 17

                                  to the DJSIs in emerging countries indicate that addition to the DJSIs creates a significant
                                  positive impact on the cumulative average abnormal return for a shorter period of time
                                  of up to 2 days after the announcement date as indicated by (**). Proposal 2 of this
                                  study investigated if the studied firms in European countries with the femininity cultural
                                  dimension would show a higher significant positive impact on their market values than
                                  the listed companies from corresponding emerging countries. The results of this part
                                  of the study indicate that the companies on the Dow Jones Sustainability Indices from
                                  the listed developed countries show a significant positive impact on their market values
                                  when they appear on the DJSIs. The companies on the DJSIs from the listed emerging
                                  countries also show a significant positive impact on their market values, but for a shorter
                                  period of time. Again, these results provide support for Hofstede’s concept regarding
                                  countries with the femininity cultural dimension appreciating quality of life. Based on the
                                  above results, stockholders in such countries appear to reward the adoption of socially
                                  responsible practices by their home companies that have the potential of enhancing quality
                                  of life, as indicated by higher stock prices when added to the DJSIs.
                                        The next part of the study concentrates on Proposal 3 to investigate if there is a mixed
                                  significant negative or positive relationship between the market value of publicly traded
                                  French companies and appearance on the DJSIs in France. France, with its Hofstede’s
                                  masculinity score of 43, is considered halfway between the femininity and masculinity
                                  cultural dimensions. Table 12 and Figure 4 present the daily cumulative abnormal returns
                                  (CARs) for French companies that were added to the Dow Jones Sustainability Indices
                                  during the years 2010–2019.

                                  Table 12. Results of the daily abnormal returns around the announcement date [−10, 10] for the
                                  French companies added to the Dow Jones Sustainability Indices, 2010–2019.

                                                        Additions to the DJSIs, 2010–2019—French Companies
                                                                                N = 14
                                               Day                    CAR                       Day                      CAR
                                               −10                  −0.0281                      1                      −0.0430
                                                −9                  −0.0094                      2                      −0.0272
                                                −8                   0.0089                       3                     −0.0309
                                                −7                   0.0248                       4                     −0.0010
                                                −6                   0.0348                       5                     −0.0193
                                                −5                   0.0284                       6                     −0.0372
                                                −4                   0.0054                       7                     −0.0385
   Sustainability 2021, 13, x FOR PEER REVIEW
                                                −3                  −0.0135                      8                      −0.033712 of 17
                                                −2                  −0.0078                      9                      −0.0900
                                                −1                  −0.0061                      10                     −0.0959
                                              0 0                   −0.0265
                                                                −0.0265

        Figure
      Figure 4. 4. Results
                Results ofof the
                           the   daily
                               daily   abnormal
                                     abnormal   returnsaround
                                              returns    aroundthe
                                                                 theannouncement
                                                                     announcementdate
                                                                                  date[−
                                                                                       [−10, 10] for
                                                                                         10, 10]  for the
                                                                                                       the French
                                                                                                           French companies
                                                                                                                  companies added
                                                                                                                            added to
        to the Dow Jones Sustainability Indices, 2010–2019.
      the Dow Jones Sustainability Indices, 2010–2019.

                                         As indicated in Table 12 and Figure 4, the daily cumulative abnormal returns (CARs)
                                    indicate that the French companies that are added to the Dow Jones Sustainability Indices
                                    experience negative impacts on their stock prices. In order to strengthen the above find-
Sustainability 2021, 13, 12052                                                                                               12 of 17

                                      As indicated in Table 12 and Figure 4, the daily cumulative abnormal returns (CARs)
                                 indicate that the French companies that are added to the Dow Jones Sustainability Indices
                                 experience negative impacts on their stock prices. In order to strengthen the above findings,
                                 market model analysis was also conducted on these data. Table 13 indicates the results of
                                 this part of the research.

                                 Table 13. Cumulative average abnormal returns (CAARs) around the announcement date [−10, 10]
                                 for the French companies added (N = 14) to the DJSIs, 2010–2019.

                                                                                                                 t-Test
                                           Event Window                                 CAAR
                                                                                                                p-Value
                                               [−10, 10]                            −9.589% ***                 0.0001
                                                [−2, 2]                             −1.367% *                   0.0818
                                                [−5, 5]                             −5.419% ***                 0.0008
                                                [−1, 1]                             −3.524% ***                 0.0001
                                 Note: Significant differences have been bolded. *, p < 0.05, ***, p < 0.001.

                                       As presented in Table 13, the results of the model market analysis for the French
                                 companies that were added to the Dow Jones Sustainability Indices during the years
                                 2010–2019 show a prolonged significant negative impact on their market value within the
                                 [−1, 1] to [−10, 10] windows indicated by (*, ***).
                                       Proposal 3 of this study was to explore the notion that France, being half-way between
                                 the femininity and masculinity cultural dimensions with a score of 43, shows a mixed
                                 reaction to companies that adopt the sustainability practices. However, the results of the
                                 statistical analyses do not support this proposal. The appearance of the French companies
                                 on the Dow Jones Sustainability Indices shows a significant negative and prolonged impact
                                 on the market value of such firms. These results are interesting, considering that France is
                                 a member of the European Union and it is where the Paris Accord was signed.
                                       The following part of the study concentrated on the Japanese companies and Proposal
                                 4 of this research. This proposal investigated whether there was a significant negative
                                 relationship between the market value of the publicly traded Japanese companies and
                                 appearance on the DJSIs in Japan, with the highest Hofstede’s masculinity score of 92.
                                 Table 14 shows the results of the event study for the daily cumulative abnormal returns
                                 (CARs) for the Japanese companies that were added to the Dow Jones Sustainability Indices
                                 from 2010 through 2019.

                                 Table 14. Results of the daily abnormal returns around the announcement date [−10, 10] for Japanese
                                 companies added to the Dow Jones Sustainability Indices, 2010–2019.

                                                         Additions to the DJSIs, 2010–2019—Japanese Companies
                                                                                  N = 49
                                             Day                         CAR                            Day          CAR
                                             −10                        −0.0116                           1         0.0241
                                             −9                         −0.0063                           2         0.0295
                                             −8                         0.0049                            3         0.0273
                                             −7                         0.0087                            4         0.0312
                                             −6                         0.0149                            5         0.0521
                                             −5                         0.0144                            6         0.0474
                                             −4                         0.0249                            7         0.0329
                                             −3                         0.0185                            8         0.0356
                                             −2                         0.0203                            9         0.0252
                                             −1                         0.0230                           10         0.0332
                                              0                         0.0264

                                      As indicated in Table 14 and Figure 5, Japanese companies show positive impacts
                                 on their market value when added to the Dow Jones Sustainability Indices. To further
−4                         0.0249                         7                       0.0329
                                        −3                         0.0185                         8                       0.0356
                                        −2                         0.0203                         9                       0.0252
                                        −1                         0.0230                        10                       0.0332
Sustainability 2021, 13, 12052          0                          0.0264                                                             13 of 17

                                      As indicated in Table 14 and Figure 5, Japanese companies show positive impacts on
                                 their market value when added to the Dow Jones Sustainability Indices. To further inves-
                                 investigate
                                 tigate these these  results,
                                               results,       a market
                                                        a market  modelmodel analysis
                                                                        analysis      was again
                                                                                 was again      conducted.
                                                                                           conducted.      The results
                                                                                                      The results      are
                                                                                                                  are pre-
                                 presented  in  Table
                                 sented in Table 15.  15.

      Figure 5.
      Figure 5. Results  of the
                 Results of     daily abnormal
                            the daily abnormal returns
                                                returns around
                                                        around the
                                                               the announcement
                                                                   announcement date
                                                                                date[[−10,
                                                                                     −10, 10]
                                                                                           10] for
                                                                                               for Japanese
                                                                                                   Japanese companies
                                                                                                            companies added to
                                                                                                                      added to
      the Dow   Jones Sustainability  Indices, 2010–2019.
      the Dow Jones Sustainability Indices, 2010–2019.

                                 Table 15. Cumulative average abnormal returns (CAARs) around the announcement date [−10, 10]
                                 Table 15. Cumulative average abnormal returns (CAARs) around the announcement date [−10, 10]
                                 for Japanese companies added (N = 49) to the DJSIs, 2010–2019.
                                 for Japanese companies added (N = 49) to the DJSIs, 2010–2019.
                                                                                                                             t-Test
                                              Event Window                                  CAAR                            t-Test
                                           Event Window                                 CAAR                                p-Value
                                                                                                                           p-Value
                                                 [−10, 10]                                3.322% ***                        0.0015
                                               [−10, 10]                            3.322% ***                             0.0015
                                                  [−2, 2]                                1.100% **                          0.0198
                                                [−2, 2]                             1.100% **                              0.0198
                                                  [−5,
                                                [−5, 5] 5]                          3.716% *** ***
                                                                                         3.716%                             0.0000
                                                                                                                           0.0000
                                                  [−1,
                                                [−1, 1] 1]                            0.376%0.376%                          0.1778
                                                                                                                           0.1778
                                 Note: Significant
                                 Note: Significant   differences
                                                   differences    have
                                                               have beenbeen bolded.
                                                                         bolded. **, p
2019 than any country with the femininity cultural dimension. In addition, the impact on
                                           the market value of the Japanese companies is significantly positive and more prolonged
                                           than in the other studied companies on the DJSI lists in the countries with the femininity
                                           cultural dimension.
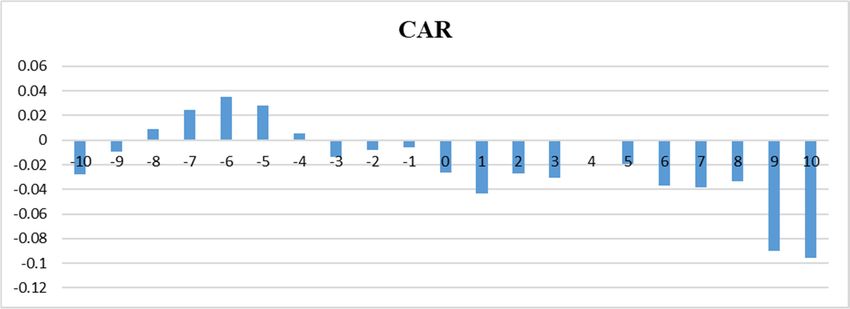
Sustainability 2021, 13, 12052                  To create a visualization of the findings of this study, we plotted the calculated CARs.
                                                                                                                                     14 of 17
                                           These calculated CARs depict companies in the sample data in the European, emerging
                                           countries, France, and Japan. Figure 6 shows the results.

                      0.06

                      0.04

                      0.02

                         0
                                 -5           -4       -3        -2         -1   Day 0            1          2          3         4          5
      CAR

                     -0.02

                     -0.04

                     -0.06

                     -0.08

                      -0.1            female countries Hofstede
Sustainability 2021, 13, 12052                                                                                                                             15 of 17
Sustainability 2021, 13, x FOR PEER REVIEW                                                                                                                 15 of 17

         0.060

         0.040

         0.020

         0.000
                     -5        -4            -3          -2          -1           0            1           2            3           4            5
        -0.020

        -0.040                                                                  Day
        -0.060

        -0.080

                                    France            South Korea                 Spain              Sweden                 Japan

     Figure 7.
     Figure   7. CARs
                  CARs representing
                          representing the
                                       the French,
                                           French, Swedish,
                                                   Swedish, South
                                                            South Korean, and Japanese
                                                                  Korean, and Japanese companies
                                                                                       companies on
                                                                                                 on the
                                                                                                    the DJSIs
                                                                                                        DJSIs in
                                                                                                              in the
                                                                                                                 the sample
                                                                                                                     sample data
                                                                                                                            data
     [−1, 1] to  [−5, 5], 2010–2019.
     [−1, 1] to [−5, 5], 2010–2019.

                                     5. Conclusions
                                          In Figure 7, the blue line, representing French companies’ CARs, shows a negative
                                    impact The onglobal
                                                   market    value when
                                                           attention     to theappearing
                                                                                  sustainabilityon the   DJSIs, while
                                                                                                       practices            companies
                                                                                                                    is evident              in Spain sustain-
                                                                                                                                   by UNESCO’s             (yellow
                                    line)  and    South    Korea      (green    line)   show    a  positive    impact
                                     ability goals [35] and also the Paris Accord, which has been signed by 197 countries on   their   market       value    when  to
                                    added     to  the   DJSIs.    The   same     is  true   for  Swedish      companies,
                                     date [23]. These goals emphasize enhancing the health and the welfare of living species,   with    Sweden       having      the
                                    lowest    masculinity
                                     the physical             score. Meanwhile,
                                                      environment,        reduction ofJapanese
                                                                                             greenhouse companies,
                                                                                                             gases (GHG),with Japan
                                                                                                                                  and the having     the highest
                                                                                                                                             implementation
                                    masculinity       score, indicate
                                     of socially responsible                a positive impact
                                                                     and sustainability               on their
                                                                                               strategies   acrossmarket       value cost
                                                                                                                      the activity      when     added
                                                                                                                                              chain          to the
                                                                                                                                                        of compa-
                                    DJSIs.
                                     nies. AsFigure    7 supports
                                                 a result,                   visualizationof
                                                            getting the involvement              presented     in Figure
                                                                                                   the companies             6.
                                                                                                                        in implementation            of CSR and
                                    •sustainability
                                          As mentioned  strategies
                                                               before, is essential     to enhancing
                                                                          the interesting       findingthe      quality
                                                                                                           of the  studyofislifethatacross
                                                                                                                                      Japanesethe globe.
                                                                                                                                                     companies,
                                           In indicated
                                          as   this study,by wethe  selected
                                                                       pinkish  Hofstede’s      femininity
                                                                                   line in Figure      6 and cultural
                                                                                                                Figure 7,dimension          and explored
                                                                                                                              show a positive          impactthe  on
                                     notion   thatmarket
                                          their     countriesvaluewith   a lowadded
                                                                       when       masculinity
                                                                                          to the cultural
                                                                                                   DJSIs. Thisdimension       care for quality
                                                                                                                   is an indication        that the  of Japanese
                                                                                                                                                         life more
                                     than cultural
                                           materialistic     wealth.has
                                                       dimension         Theshifted.
                                                                               results Based
                                                                                         of the onstatistical
                                                                                                      research  analyses    of this research
                                                                                                                  [34], investors       need toindicate
                                                                                                                                                     be morethat  in-
                                     countries
                                          volved and engaged in interactive relationships with firms in order to valueinvest
                                                  with    the femininity        cultural    dimension      do   reward     the   companies       that      and un- in
                                     socially   responsible     strategies     that  can
                                          derstand their CSR and sustainability strategies.enhance    the  quality    of life.  These    findings      support     of
                                     Hofstede’s concept regarding a positive relationship between countries with the femininity
                                     cultural
                                    5.           dimension and respect for quality of life.
                                        Conclusions
                                           An interesting finding is the impact on the market value of the French companies
                                          The global attention to the sustainability practices is evident by UNESCO’s sustaina-
                                     when they appear on the Dow Jones Sustainability Indices. France, with a Hofstede
                                    bility goals [35] and also the Paris Accord, which has been signed by 197 countries to date
                                     masculinity score of 43, is considered to be halfway between the masculinity and femininity
                                    [23]. These goals emphasize enhancing the health and the welfare of living species, the
                                     cultural dimensions. However, based on our findings, when French companies are added
                                    physical environment, reduction of greenhouse gases (GHG), and the implementation of
                                     to the DJSIs, their market value is significantly and negatively affected, indicative of
                                    socially    responsiblecultural
                                     a fully masculine           and sustainability
                                                                           dimension. strategies
                                                                                              As a result,across
                                                                                                               the the    activity
                                                                                                                     concern      forcost    chain of compa-
                                                                                                                                       materialistic        wealth
                                    nies.  As   a result,   getting    the  involvement        of  the  companies
                                     associated with Hofstede’s masculinity cultural dimension manifests itself stronglyin  implementation           of CSR and    in
                                    sustainability
                                     France. ConsideringstrategiesthatisFrance
                                                                          essentialis atomember
                                                                                           enhancing      theEuropean
                                                                                                     of the     quality ofUnion
                                                                                                                              life across
                                                                                                                                      and thatthe globe.
                                                                                                                                                    the net-zero
                                          In this
                                     carbon         study,economy
                                                emission     we selected    goalHofstede’s      femininity
                                                                                   is to be achieved        bycultural
                                                                                                                 the year  dimension
                                                                                                                               2050 [24],and  it isexplored
                                                                                                                                                     interesting the
                                    notion    that   countries      with   a  low    masculinity       cultural   dimension
                                     that, based on these findings, stockholders do not appreciate the adoption of sustainability   care   for  quality      of  life
                                    more    thanby
                                     strategies     materialistic
                                                       the Frenchwealth.
                                                                       companies. The results of the statistical analyses of this research indi-
                                    cate that
                                           Another interesting finding of thiscultural
                                                 countries    with     the  femininity        study isdimension
                                                                                                          the attitude  doof reward      the companies
                                                                                                                                stockholders        of Japanese that
                                    invest   in  socially   responsible       strategies     that  can  enhance      the  quality
                                     companies that appear on the DJSI lists. Based on Hofstede’s masculinity score, Japan,          of  life. These      findings
                                    support
                                     with the of    Hofstede’s
                                                 highest             concept
                                                            masculinity          regarding
                                                                              score,    shoulda demonstrate
                                                                                                   positive relationship          betweenfor
                                                                                                                     more preference           countries      with
                                                                                                                                                   materialistic
                                    the  femininity
                                     wealth              cultural
                                               than quality           dimension
                                                                of life.   However,   anditrespect
                                                                                             appearsfor    quality
                                                                                                        that          of life.
                                                                                                               Japanese      stockholders appreciate the
                                          An interesting
                                     adoption     of sociallyfinding
                                                                  responsibleis thestrategies
                                                                                       impact on   bythe   marketcompanies
                                                                                                       Japanese       value of the   as French
                                                                                                                                          manifested  companies
                                                                                                                                                            by the
                                    when     they   appear    on    the  Dow     Jones    Sustainability     Indices.    France,
                                     most significant, positive, and prolonged impact on their stock prices among all the studied    with    a Hofstede       mas-
                                    culinity    score   of  43,  is  considered
                                     companies and countries in this research.        to  be  halfway    between       the   masculinity       and    femininity
                                    cultural    dimensions.
                                           Future    research However,
                                                                   in this area  based     on our findings,
                                                                                    can include       exploring  when     French companies
                                                                                                                     the cultural      changes inare        added
                                                                                                                                                         different
                                    to  the DJSIs,
                                     countries,    thetheir
                                                        impactmarket       value
                                                                   of global        is significantly
                                                                                 agreements               and negatively
                                                                                                  on appreciation        of CSR  affected,     indicative
                                                                                                                                    and enhancing              of a
                                                                                                                                                            quality
Sustainability 2021, 13, 12052                                                                                                       16 of 17

                                  of life, and education of stakeholders and the populations of different countries concern-
                                  ing corporate social responsibility and the implementation of sustainability practices by
                                  different companies. In addition, we included the highest masculinity cultural dimension
                                  country, Japan, in our research and the results of the study indicated cultural change.
                                  Future research should include other countries with masculinity cultural dimension to
                                  examine any changes in the cultural aspects of such countries.

                                  Author Contributions: Conceptualization: M.T.; methodology: M.T., A.R., L.F., B.S.; software and
                                  formal analysis: A.R., M.T., B.S.; investigation: M.T.; resources: M.T., A.R., L.F., B.S.; writing—original
                                  draft preparation: M.T.; writing—review and editing: M.T., A.R., L.F., B.S.; visualization: M.T.,
                                  A.R.; supervision & project administration: M.T., A.R., L.F. All authors have read and agreed to the
                                  published version of the manuscript.
                                  Funding: This research received no external funding.
                                  Institutional Review Board Statement: Not applicable.
                                  Informed Consent Statement: Not applicable.
                                  Data Availability Statement: Not applicable.
                                  Conflicts of Interest: The authors declare no conflict of interest.

References
1.    Hofstede, G. Motivation, leadership, and organization: Do American theories apply abroad? Organ. Dyn. 1980, 9, 42–63.
      [CrossRef]
2.    Hofstede, G. What did GLOBE really measure? Researchers’ minds versus respondents’ minds. J. Int. Bus. Stud. 2006, 37, 882–896.
      [CrossRef]
3.    Beugelsdijk, S.; Kostova, T.; Roth, K. An overview of Hofstede-inspired country-level culture research in international business
      since 2006. J. Int. Bus. Stud. 2017, 48, 30–47. [CrossRef]
4.    Kim, K.I.; Park, H.-J.; Suzuki, N. Reward allocations in the United States, Japan, and Korea: A comparison of individualistic and
      collectivistic cultures. Acad. Manag. J. 1990, 33, 188–198.
5.    Nelson, M.R.; Brunel, F.F.; Supphellen, M.; Manchanda, R.V. Effects of Culture, Gender, and Moral Obligations on Responses to
      Charity Advertising Across Masculine and Feminine Cultures. J. Consum. Psychol. 2006, 16, 45–56. [CrossRef]
6.    Sørnes, J.-O.; Stephens, K.K.; Sætre, A.S.; Browning, L.D. The reflexivity between ICTs and business culture: Applying Hofstede’s
      theory to compare Norway and the United States. Inf. Sci. J. 2004, 7, 1–30.
7.    Venaik, S.; Brewer, P. Avoiding uncertainty in Hofstede and GLOBE. J. Int. Bus. Stud. 2010, 41, 1294–1315. [CrossRef]
8.    Brewer, P.; Venaik, S. Individualism–Collectivism in Hofstede and GLOBE. J. Int. Bus. Stud. 2011, 42, 436–445. [CrossRef]
9.    Shi, W.; Veenstra, K. The Moderating Effect of Cultural Values on the Relationship between Corporate Social Performance and
      Firm Performance. J. Bus. Ethics 2021, 174, 89–107. [CrossRef]
10.   Ates, S. Membership of sustainability index in an emerging market: Implications for sustainability. J. Clean. Prod. 2020, 250,
      119465. [CrossRef]
11.   Durand, R.; Paugam, L.; Stolowy, H. Do investors actually value sustainability indices? Replication, development, and new
      evidence on CSR visibility. Strat. Manag. J. 2019, 40, 1471–1490. [CrossRef]
12.   Hawn, O.; Chatterji, A.K.; Mitchell, W. Do investors actually value sustainability? New evidence from investor reactions to the
      Dow Jones Sustainability Index (DJSI). Strat. Manag. J. 2018, 39, 949–976. [CrossRef]
13.   De Santis, P.; Albuquerque, A.; Lizarelli, F. Do sustainable companies have a better financial performance? A study on Brazilian
      public companies. J. Clean. Prod. 2016, 133, 735–745. [CrossRef]
14.   Schmutz, B.; Tehrani, M.; Fulton, L.; Rathgeber, A. Dow Jones Sustainability Indices, Do They Make a Difference? The U.S. and
      the European Union Companies. Sustainability 2020, 12, 6785. [CrossRef]
15.   Zhao, X.; Murrell, A.J. Revisiting the corporate social performance-financial performance link: A replication of Waddock and
      Graves. Strat. Manag. J. 2016, 37, 2378–2388. [CrossRef]
16.   Cheung, A.W.K. Do Stock Investors Value Corporate Sustainability? Evidence from an Event Study. J. Bus. Ethics 2010, 99,
      145–165. [CrossRef]
17.   Cheung, A.; Wai, K.; Roca, E. The effect on price, liquidity and risk when stocks are added to and deleted from a sustainability
      index: Evidence from the Asia Pacific context. J. Asian Econ. 2013, 24, 51–65. [CrossRef]
18.   Lee, S.; Kim, I.; Hong, C.-H. Who Values Corporate Social Responsibility in the Korean Stock Market? Sustainability 2019, 11, 5924.
      [CrossRef]
19.   Searcy, C.; Elkhawas, D. Corporate sustainability ratings: An investigation into how corporations use the Dow Jones Sustainability
      Index. J. Clean. Prod. 2012, 35, 79–92. [CrossRef]
20.   Hofstede, G. Cultural differences in teaching and learning. Int. J. Intercult. Relat. 1986, 10, 301–320. [CrossRef]
Sustainability 2021, 13, 12052                                                                                                  17 of 17

21.   Yilmaz, M.K.; Aksoy, M.; Tatoglu, E. Does the Stock Market Value Inclusion in a Sustainability Index? Evidence from Borsa
      Istanbul. Sustainability 2020, 12, 483. [CrossRef]
22.   Hofstede, G.; Bond, M.H. Hofstede’s culture dimensions: An independent validation using Rokeach’s value survey. J. Cross-Cult.
      Psychol. 1984, 15, 417–433. [CrossRef]
23.   Climate Focus. The Paris Agreement Summary 2015. 2015. Available online: https://climatefocus.com/sites/default/files/20151
      228%20COP%2021%20briefing%20FIN.pdf (accessed on 1 September 2021).
24.   2050 Long-Term Strategy 2020. 2020. Available online: https://ec.europa.eu/clima/policies/strategies/2050_en (accessed on 1
      September 2021).
25.   Hostede Insights 2021. 2021. Available online: https://www.hofstede-insights.com/product/virtual-certification-in-organisatio
      nal-culture-2021-1/ (accessed on 1 September 2021).
26.   Brown, S.J.; Warner, J.B. Using daily stock returns: The case of event studies. J. Financ. Econ. 1985, 14, 3–31. [CrossRef]
27.   Kothari, S.; Warner, J.B. Econometrics of Event Studies**We thank Espen Eckbo, Jon Lewellen, Adam Kolasinski, and Jay Ritter
      for insightful comments, and Irfan Safdar and Alan Wancier for research assistance. In Handbook of Empirical Corporate Finance;
      Elsevier BV: Amsterdam, The Netherlands, 2007; pp. 3–36.
28.   Kothari, S.P.; Warner, J.B. The Econometrics of Event Studies. 2006. Available online: https://www.bu.edu/econ/files/2011/01
      /KothariWarner2.pdf (accessed on 1 September 2021).
29.   MacKinlay, A.C. Event studies in economics and finance. J. Econ. Lit. 1997, 35, 13–39.
30.   Chan, W.S. Stock price reaction to news and no-news: Drift and reversal after headlines. J. Financ. Econ. 2003, 70, 223–260.
      [CrossRef]
31.   Brown, S.; Warner, J.B. Measuring security price performance. J. Financ. Econ. 1980, 8, 205–258. [CrossRef]
32.   Campbell, J.Y.; Lo, A.W.; MacKinlay, A.C. Event-Study Analysis, The Econometrics of Financial Markets; Princeton University Press:
      Princeton, NJ, USA, 1997.
33.   Strand, R.; Freeman, R.E.; Hockerts, K. Corporate social responsibility and sustainability in Scandinavia: An overview. J. Bus.
      Ethics 2015, 127, 1–15. [CrossRef]
34.   Hockerts, K.; Moir, K. Communicating corporate responsibility to investors: The changing role of the investor relations function.
      J. Bus. Ethics 2004, 52, 85–98. [CrossRef]
35.   UNESCO. UNESCO and Sustainable Development Goals 2019. 2019. Available online: https://en.unesco.org/sustainabledevel
      opmentgoals (accessed on 1 September 2021).
You can also read