Sustained coral reef growth in the critical wave dissipation zone of a Maldivian atoll - Nature
←
→
Page content transcription
If your browser does not render page correctly, please read the page content below
ARTICLE
                  https://doi.org/10.1038/s43247-021-00338-w              OPEN

                  Sustained coral reef growth in the critical wave
                  dissipation zone of a Maldivian atoll
                  Paul S. Kench 1 ✉, Edward P. Beetham2, Tracey Turner3, Kyle M. Morgan                                    4,5,   Susan D. Owen6 &
                  Roger. F. McLean7

                  Sea-level rise is expected to outpace the capacity of coral reefs to grow and maintain their
                  wave protection function, exacerbating coastal flooding and erosion of adjacent shorelines
                  and threatening coastal communities. Here we present a new method that yields highly-
                  resolved direct measurements of contemporary reef accretion on a Maldivian atoll reef rim,
1234567890():,;

                  the critical zone that induces wave breaking. Results incorporate the suite of physical and
                  ecological processes that contribute to reef accumulation and show growth rates vary from
                  6.6 ± 12.5 mm.y−1 on the reef crest, and up to 3.1 ± 10.2 mm.y−1, and −0.5 ± 1.8 mm.yr−1 on
                  the outer and central reef flat respectively. If these short-term results are maintained over
                  decades, the reef crest could keep pace with current sea-level rise. Findings highlight the
                  need to resolve contemporary reef accretion at the critical wave dissipation zone to improve
                  predictions of future reef growth, and re-evaluate exposure of adjacent shorelines to coastal
                  hazards.

                  1 Department of Earth Sciences, Simon Fraser University, Burnaby, Canada. 2 Tonkin and Taylor International Ltd, Auckland, New Zealand. 3 School of

                  Environment, University of Auckland, Auckland, New Zealand. 4 Asian School of the Environment, Nanyang Technological University, Singapore 637459,
                  Singapore. 5 Earth Observatory of Singapore, Nanyang Technological University, Singapore, Singapore. 6 School of Resource and Environmental Management,
                  Simon Fraser University, Burnaby, Canada. 7 School of Science, University of New South Wales-Canberra, Canberra, ACT, Australia. ✉email: pkench@sfu.ca

                  COMMUNICATIONS EARTH & ENVIRONMENT | (2022)3:9 | https://doi.org/10.1038/s43247-021-00338-w | www.nature.com/commsenv                                1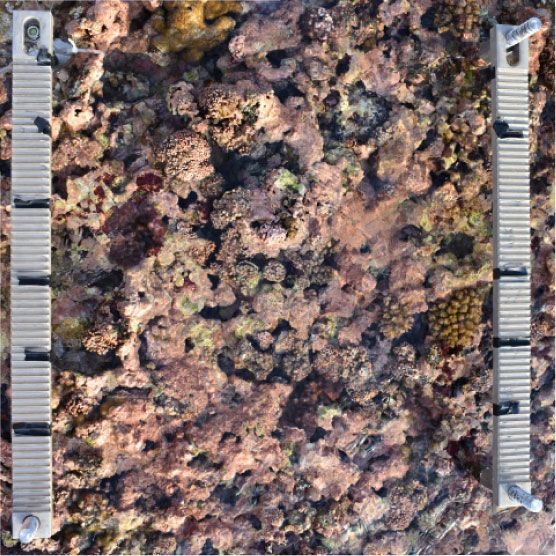
ARTICLE COMMUNICATIONS EARTH & ENVIRONMENT | https://doi.org/10.1038/s43247-021-00338-w
R
educed coral reef growth capacity, as a consequence of erosion and flooding of coastal communities3,7,10,11. Increases in
global climatic change and anthropogenic stressors, poses a relative water depth across reefs will occur where rates of vertical
major threat to reef-fronted coastal communities1–7. reef growth lag behind rates of sea-level rise, and where degra-
Modelling studies suggest that tropical coral reefs serve as natural dation of the reef surface through coral mortality, and physical
protective barriers to incident ocean wave energy, reducing and biological breakdown processes reduce the level of the reef
coastal hazard risks along reef-fringed coastlines1,3. In Indo- flat12,13. In these instances there may be increases in the mag-
Pacific reef settings this protective function is primarily depen- nitude of wave energy that reaches adjacent shorelines13.
dent on the elevation of the reef edge with respect to sea level, This relative reef submergence hypothesis, and increase in hazard
which induces breaking of incident ocean waves in shallow water risk to coastal communities, has assumed widespread
at the reef crest. Further dissipation and transformation of resi- acceptance3,5,14 given current scenarios of sea-level rise of 0.44 m
dual wave energy that impacts shorelines is also dependent on (RCP 2.6) to 0.75 m (RCP 8.5) by 210015,16, and declines in the
relative water depth and width of the reef flat (Fig. 1). The pre- global abundance and productivity of tropical reef-building corals
sence of the reef structure and the associated protective functions that drive vertical reef growth potential4,17–20. Here we present an
it provides shorelines, relies on the net accumulation of calcium important contribution to understanding contemporary and
carbonate material by living reef ecological communities, which future coral reef growth potential and the role of reefs in acting as
when consolidated in the reef framework, contributes to vertical wave protection structures as it: (1) introduces a method to
reef accretion. The potential for net accumulation at any point in directly quantify rates of reef growth; (2) presents new data of
time represents the balance of constructive (e.g. calcification by contemporary reef growth from the critical wave breaking zone of
living corals, coralline algae and other calcifiers) and erosive (e.g. an Indo-Pacific oceanic atoll, and; (3) uses these contemporary
bioerosion, chemical dissolution and physical) processes8. Con- measurements to consider future reef growth to maintain wave
sequently, the elevation of existing reef structures reflects the protective functions for coastal resilience. The findings challenge
culmination of cycles of growth, decay, and hiatus as the balance prevailing interpretations of reef growth that are largely derived
of these competing constructive and destructive forces shifted in from submerged fore-reef settings and provide both conceptual
response to changing environmental conditions across geological and methodological advances in the approach to future analyses
timescales. of reef growth potential.
During the Holocene (past 10,000 years), reef growth rates While projections of future rates of sea-level rise continue to be
have been shown to vary between 1 and 20 mm.yr−1 due to refined, the greenhouse commitment will ensure substantive
differences in both sea level histories and ecological legacies increases in sea level are locked into the climate-ocean system for
deriving from the productivity and composition of past reef several centuries21–23. In contrast, estimates of contemporary and
communities9. The ecological condition and capacity of con- future reef growth performance are less well constrained and can
temporary reefs to maintain existing, or support future, vertical be expected to exhibit marked geographic variation4,24. Studies of
growth is uncertain. Sea-level rise is expected to reduce the paleo-reef growth have typically been assessed using geological
protective function of reefs, as increased water depths across reef reconstructions from reef cores9,25–27. However, such paleo-
surfaces open the wave energy window, and excaerbate shoreline reconstructions are considered to have limited value in evaluating
a) b) Wave Propagation Shoaling Hb Dissipation Hb Overtopping
Wave energy (%)
100
Mean
water Infragravity Setup Island flooding
50 level wave profile water level
0
Island
Lagoon 0 Reef flat
2
Depth below reef crest (m)
Reef crest
4 50
5m - Induces wave breaking
Island 6 - Absence of growth studies
Number of budget studies
40
8
Forereef 10m
Reef flat 10 30
slope
12
14 20
Reef Crest
15m
16
10
18
20 0
Forereef
slope 4 219 0 3
100 m
Aggregate number of budget studies by reef zone
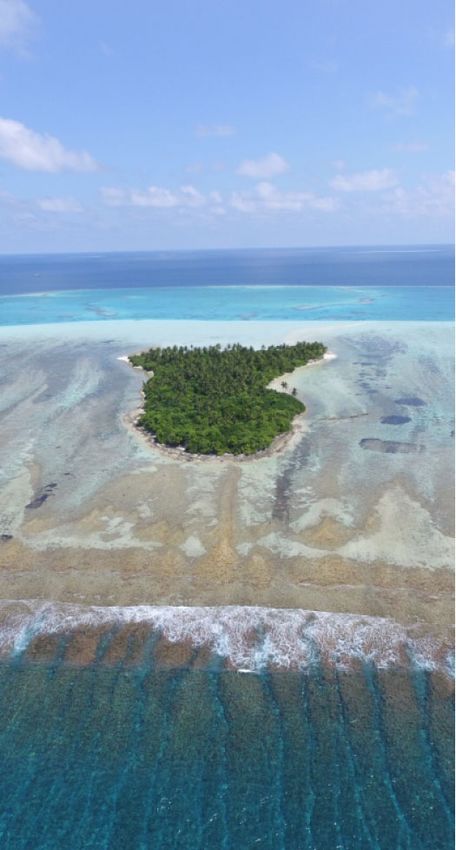
Fig. 1 Summary of wave interactions with Indo-Pacific coral reefs and reef flats. a Field location on the southwest rim of Huvadhoo atoll, Maldives,
central Indian Ocean, showing primary geomorphic components of reef structure (also see Methods and Supplementary Fig. 1). Dashed line represents
profile presented in b. Yellow triangles show the location of wave gauges used to document cross-reef reduction in wave energy of 90% presented in
Supplementary Fig. 2. b Summary of wave process interactions with a coral reef. The reef crest induces critical wave breaking (Hb) and cross-reef
reduction in energy with subsequent cross-reef flat wave transformations that can promote island flooding under higher wave energy conditions. Note the
spatial distribution of contemporary carbonate budget studies by depth and the concentration of budget studies on forereefs at depths of 7–10 m which are
used as proxies for potential vertical reef growth, and the paucity of reef growth estimates for the reef crest and reef flat (data sources for budget studies
presented in Supplementary Data 1).
2 COMMUNICATIONS EARTH & ENVIRONMENT | (2022)3:9 | https://doi.org/10.1038/s43247-021-00338-w | www.nature.com/commsenv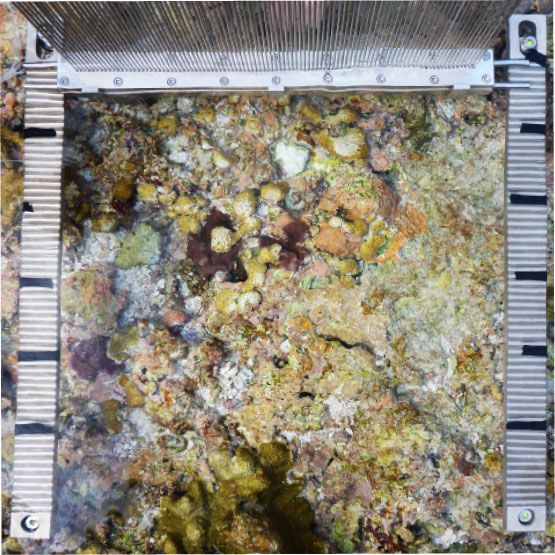
COMMUNICATIONS EARTH & ENVIRONMENT | https://doi.org/10.1038/s43247-021-00338-w                                                  ARTICLE

current and future reef growth capacity as the start-up and                 suggests the growth potential and response to external dis-
growth conditions (e.g., water quality, depth, chemistry) of reef           turbance events of these key geomorphic zones are also likely to
communities in the Holocene are thought to differ markedly to               differ33. Such differences are significant as reductions in growth
those of present-day reef systems24. Due to the slow growth rates           of the reef crest can influence whether waves break or propagate
of reef calcifying organisms, and the extended duration of                  onto the reef surface, whereas changes in accretion of the
investigations needed to detect changes in reef surface elevation,          forereef4,26 may only induce minor modification to wave shoaling
there have been few attempts to undertake direct measurements               processes (Fig. 1b). As has been shown by Roff26, where
of contemporary reef growth. To date, estimates of contemporary             accommodation space is available on reef slopes reefs can accrete
rates of reef growth have largely relied on indirect census-based           at rates equal to or exceeding that of the mid-Holocene climatic
observations of living cover and their subsequent conversion to             optimum. In contrast, few studies have examined the productive
growth rates. In particular, studies based on in-situ ecological            capacity of reef crest environments34–36, or generated con-
surveys have estimated the net carbonate budget state of                    temporary growth rate estimates of exposed reef crests and
reefs28–30. These datasets have also been used to derive first-order         adjacent ocean reef flats (Fig. 1b).
estimates of vertical reef growth potential, ranging from −0.84 to             Here we present a direct measurement approach that utilises
4.0 mm yr−1, 28, and subsequently to assess the possible magni-             coral reef accretion frames (CRAFs) to make highly-resolved and
tude of reef submergence with future sea-level rise4. Results of            repeatable measurements of changes in reef surface topography at
these studies have shown marked regional differences in potential           four locations across the reef crest and outer reef flat of Huvad-
reef growth, partly driven by the scale of recent mass coral                hoo atoll in the southern Maldives, central Indian Ocean (see
bleaching events within defined ecoregions, and have highlighted             Methods, Supplementary Fig. 1). Coral reef accretion monitoring
the susceptibility of reef growth rates to temporal shifts in eco-          (CRAM) sites spanned the first 65 m of the reef crest and outer
logical state4,20.                                                          reef flat, the zone critical to inducing wave breaking processes on
   While these studies have yielded valuable insights into the              coral reefs (Supplementary Fig. 1c,d). The CRAM sites were
carbonate budget state and budget dynamics of modern reefs,                 selected to ensure coverage of the different eco-geomorphic zones
their value in estimating vertical reef growth, possible reef sub-          including the crustose coralline algae (CCA) dominated reef crest,
mergence and, therefore, changes in coastal hazard risk is limited.         the mixed CCA and coral zone on the outer reef flat, and algal
First, the studies invoke assumptions in converting net calcium             pavement on the central reef flat (Supplementary Note 1, Sup-
carbonate deposition in Kg.m−2.yr−1(G) to linear reef accretion             plementary Fig. 3, Supplementary Tables 1 and 2). Notably, our
(mm.yr−1) that remain poorly validated. Second, the role of                 reef crest sites represent a modern analogue of the coralline algal
detrital sediment generation and its subsequent offreef export or           reef framework facies common to Indo-Pacific reef crest envir-
redeposition within the reef matrix is not directly assessed,               onments as determined through geological core analysis9. Our
potentially under-representing rates of reef accumulation31.                high-resolution measurements were repeated annually over a
Third, and most significantly for resolving the problem of reef flat          three-year timeframe (2018–2020) and integrate the suite of
submergence, data underpinning carbonate budget studies and                 physical and ecological processes that contribute to reef accretion
estimates of rates of contemporary reef growth are gathered from            and erosion at the CRAM sites. This study commenced
reef zones that are peripheral to the reef crest, which is the critical     approximately 18 months after the third global coral bleaching
area of wave breaking and dissipation that modulates shoreline              event affected the central Indian Ocean in 2016, with studies
hazards (Fig. 1). Constrained by field logistics, the majority of            reporting significant declines in live coral cover at nearby reef
budget studies have been undertaken on less energetic and deeper            sites in the southern Maldives, including Huvadhoo atoll37,38.
fore-reef slopes that are accessible by SCUBA (Fig. 1b). While              Monitoring results of reef surface topographic change are
driven by discrete research questions of broader reef ecosystem             examined in the context of processes governing reef flat accretion
health, studies from these deeper locations are of lesser impor-            and current and future scenarios of sea level change.
tance in understanding the role of the reef to modulate wave
energy in Indo-Pacific reef settings, compared to the shallow reef
crest and outer reef flats, the critical geomorphic zones of a reef          Results
that control the dissipation and transmission of wave energy to             Measurements indicate the CRAFs are able to detect micro-scale
adjacent shorelines. Fourth, reef crest zones, particularly in the          changes in surface elevation between consecutive years and show the
Indo-Pacific, are commonly comprised of distinct calcifying                  reef flat surface has a dynamic topography at the millimetre to sub-
communities (e.g. wave resistant coral morphotypes and crustose             metre scale (Fig. 2, Table 1, Supplementary Figs. 4–7 and Supple-
coralline algae) that drive reef growth in these critical wave stress       mentary Data 2). There was a statistically significant difference in
zones, and these communities may respond differently, compared              the measured changes in reef surface elevation (mm) for the two-
with deeper forereef counterparts, to major disturbance events              year observational period between CRAM sites (one way Kruskal-
because of the greater water exchange and wave stresses at shal-            Wallis test, H(3) = 521, p = 0.0001). Pairwise post-hoc tests (Dunn
low depths.                                                                 test with Bonferroni adjustments) indicate the measured differences
   Depth-limited wave breaking occurs in proximity of the reef              in reef surface elevation change (mm) were significant between all
crest in Indo-Pacific reef flat settings and it is this process,              four CRAM sites (Supplementary Table 3). At the CCA and
combined with subsequent transformations of residual energy                 encrusting coral-dominated reef crest zone, results identify a net
across reef flats, that is important in determining wave inunda-             increase in reef elevation of 13.2 mm across the two-year observa-
tion and erosion potential of coastlines (Fig. 1b, Supplementary            tional period at a mean annual rate of 6.6 ± 12.6 mm.y−1. The reef
Fig. 2). This relationship is evident in the inclusion of reef depth        crest site showed consistent annual net accretion with values of
as a primary variable when developing empirical relationships to            5.4 ± 20.4 mm.y−1 and 7.8 ± 15.8 mm.y−1 for 2019 and 2020
describe wave energy reduction on coral reefs7,32. Consequently,            respectively (Fig. 2a, Supplementary Fig. 4). These aggregated site
it is the growth performance of the reef crest and outer reef flat           values mask intra-plot variability in elevation change, between the 7
that are vital in evaluating changes in the role of reefs in trans-         measurement transects within the CRAM plot, that range
forming oceanic wave energy. Recognition that the ecological                from −10.6 ± 27.8 mm.y−1 (CS1-Transect A in 2019, Table 1) to
composition and morphological structure of the reef crest and               17. 0 ± 20.0 mm.y−1 (CS1-Transect N1 in 2020, Table 1). Notably
reef flat are markedly different to the forereef environment                 93% of transects displayed net accretion. Within the entire plot

COMMUNICATIONS EARTH & ENVIRONMENT | (2022)3:9 | https://doi.org/10.1038/s43247-021-00338-w | www.nature.com/commsenv                          3
ARTICLE COMMUNICATIONS EARTH & ENVIRONMENT | https://doi.org/10.1038/s43247-021-00338-w
a) Site 1: Reef crest, algal-coral zone e)
30
E
1-A
E A 20
A 1-J
1-T 10
Z (mm)
F
1-D1
F 0
1-N1
-10
B 1-X1 B
1-E2 -20
0.2 m
-30
b) Site 2: Outer reef flat, coral-algal zone f) 30
2-A
20
2-J
2-T 10
Z (mm)
2-D1
0
2-N1
-10
2-X1
C
C 2-E2 -20
0.2 m
-30
c) Site 3: Outer reef flat, coral-algal zone g) 30
3-A
20
3-J
3-T 10
Z (mm)
3-D1
0
3-N1
-10
D 3-X1
D
3-E2 -20
0.2 m
-30
d) Site 4: Outer reef flat, reef pavement h) 30
4-A
20
4-J
4-T 10
Z (mm)
4-D1 0
4-N1
-10
4-X1
4-E2 -20
0.2 m
-30
0.0 0.1 0.2 0.3 0.4 0.5
X (m)
Fig. 2 Summary results of reef topographic change at CRAM sites, Keleihutta reef flat, Maldives. a–d show images of each CRAM site. c–h Present
corresponding summaries of topographic change across the two year experiemntal period, along each of 7 transect lines (A, J, T, D1, N1, X1, and E2).
Individual transect lines presented in Supplementary Figs. 4–7. Inset boxes are areas highlighted in Fig. 3.
dataset (1,386 points) point-scale variation ranged from a maximum across the measurement period −0.07 ± 6.1 mm.y−1 and this
of 134.8 mm to −92.0 mm in a single year. value was consistent across both measurement years (Table 1).
CRAM sites 2 and 3 were both located on the outer reef flat in Despite the negligible net change individual transect results
the coral-algal zone. Site 2 showed minimal net surface change ranged from −6.5 ± 10.4 mm.y−1 to 6.0 ± 8.8 mm.y−1 with
4 COMMUNICATIONS EARTH & ENVIRONMENT | (2022)3:9 | https://doi.org/10.1038/s43247-021-00338-w | www.nature.com/commsenv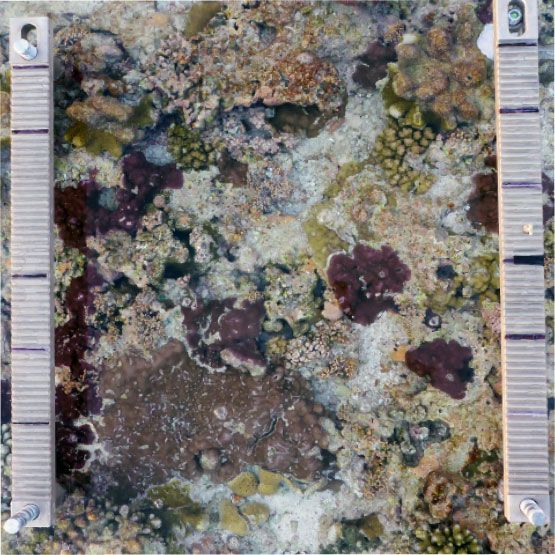
COMMUNICATIONS EARTH & ENVIRONMENT | https://doi.org/10.1038/s43247-021-00338-w ARTICLE
Table 1 Summary changes in reef surface elevation at Coral Reef Accretion Monitoring (CRAM) sites.
CRAM Site Transect 2018–19 2019–20 Tot. Change Tot. Change Max Min
(mm/yr) (mm/yr) 2018–20 (mm) 2018–20 (mm/y) (mm/yr) (mm/yr)
CS1. Reef crest A −10.6 ± 27.8 5.1 ± 22.5 −5.5 ± 35.9 −2.8 ± 18.0 128.5 −78.1
J 7.9 ± 21.2 11.2 ± 14.5 19.1 ± 27.5 9.54 ± 13.8 95.0 −55.5
T 9.4 ± 19.6 8.2 ± 7.9 17.2 ± 21.2 8.6 ± 10.6 134.8 31.8
D1 7.7 ± 25.7 3.9 ± 15.3 11.6 ± 27.4 5.8 ± 13.7 110.2 −92.0
N1 8.8 ± 18.9 17.0 ± 20.0 25.8 ± 22.9 12.9 ± 11.5 76.5 −49.3
X1 4.6 ± 7.5 7.3 ± 6.6 11.9 ± 9.3 6.0 ± 4.7 30.2 −20.2
E2 6.9 ± 9.7 1.0 ± 13.1 7.9 ± 14.2 4.0 ± 7.1 48.1 −85.1
Mean 5.4 ± 20.4 7.8 ± 15.8 13.2 ± 25.2 6.6 ± 12.6 134.8 −92.0
CS2. Outer reef flat: coral- A −0.9 ± 8.2 1.7 ± 13.3 0.8 ± 10.3 0.4 ± 5.2 49.9 −30.8
algal zone J 1.7 ± 11.8 −6.5 ± 10.4 −4.9 ± 7.7 −2.5 ± 4.0 30.6 −31.8
T 0.2 ± 14.7 −0.7 ± 12.2 −0.5 ± 16.9 −0.3 ± 8.5 38.5 −44.1
D1 −4.1 ± 13.3 1.1 ± 8.8 −2.9 ± 12.5 −2.5 ± 6.3 39.0 −46.7
N1 −0.3 ± 6.3 0.4 ± 5.8 0.2 ± 9.0 0.1 ± 4.5 22.0 −26.9
X1 1.5 ± 8.4 −2.5 ± 5.6 −1.0 ± 11.1 −0.5 ± 5.6 27.7 −25.3
E2 1.5 ± 12.2 6.0 ± 8.8 7.4 ± 12.1 3.7 ± 6.1 37.6 −42.8
Mean −0.06 ± 11.2 −0.07 ± 10.3 −0.14 ± 12.2 −0.07 ± 6.1 49.9 −66.5
CS3. Outer reef flat: coral- A 1.0 ± 27.8 1.5 ± 18.8 2.5 ± 34.3 1.3 ± 17.2 104.3 −96.0
algal zone J 15.3 ± 19.4 5.1 ± 19.6 20.3 ± 20.9 10.2 ± 10.5 59.9 −39.2
T 3.1 ± 9.1 −0.5 ± 6.9 2.5 ± 9.8 1.3 ± 4.8 42.4 −38.5
D1 −1.9 ± 17.4 0.6 ± 9.7 −1.2 ± 18.6 −0.6 ± 9.3 57.9 −53.6
N1 4.4 ± 14.5 1.8 ± 9.0 6.2 ± 16.7 3.1 ± 8.4 36.1 −52.3
X1 −1.1 ± 15.6 8.2 ± 14.0 7.1 ± 11.1 3.5 ± 5.6 61.1 57.7
E2 1.4 ± 7.6 3.9 ± 7.9 5.2 ± 12.2 2.6 ± 6.1 37.5 −31.4
Mean 3.2 ± 17.8 2.9 ± 13.4 6.1 ± 20.3 3.1 ± 10.2 104.3 −96.0
CS4. Reef flat A −1.4 ± 1.2 −0.2 ± 1.4 −1.6 ± 1.5 −0.8 ± 0.8 4.7 −4.2
pavement zone J −1.5 ± 1.1 0.1 ± 1.3 −1.4 ± 1.3 −0.7 ± 1.2 3.7 −4.5
T 0.4 ± 8.0 0.8 ± 1.3 1.2 ± 7.5 0.6 ± 3.8 16.8 −13.1
D1 −1.4 ± 0.8 0.2 ± 1.6 −1.2 ± 2.0 −0.6 ± 1.0 4.6 −4.3
N1 −2.3 ± 1.0 0.2 ± 1.3 −2.1 ± 1.8 −1.1 ± 0.9 4.0 −4.3
X1 −1.9 ± 0.7 −0.6 ± 1.0 −2.6 ± 1.2 −1.3 ± 0.6 1.8 −3.7
E2 −3.9 ± 1.1 4.6 ± 2.2 0.7 ± 2.2 0.35 ± 1.1 9.6 −6.0
Mean −1.7 ± 3.4 0.7 ± 2.2 −1.0 ± 3.5 −0.5 ± 1.8 16.8 −13.1
± values denote the standard deviation of measurements either in each transect (n = 99) or for all values in the plot (n = 693).
maximum and mimimum point-scale changes of 49.9 and is expected to have significant implications, show the reef crest
−66.5 mm (Table 1, Fig. 2b, Supplementary Fig. 5). Site 3 showed and outer reef flat surface is currently accreting, though there is
a net reef surface accretion rate of 6.1 ± 20.3 mm across the study considerable variability in net changes between CRAM sites that
period at an annual rate of 3.1 ± 10.2 mm.y−1. Annual net reflect ecological differences and, in particular, the proportion of
changes were 3.2 ± 17.8 mm.y−1 and 2.9 ± 13.4 mm.y−1 in 2019 living calcifiers. Notably our data show that the reef crest zone,
and 2020 respectively (Table 1, Fig. 2c, Supplementary Fig. 6). At dominated by coralline algae and encrusting corals, has accreted
the transect scale, net change ranged from 15.3 ± 19.4 mm.y−1 to at a mean rate of 6.6 ± 12.6 mm.y−1 over a two-year period.
−1.9 ± 17.4 mm.y−1 with 78% of transects showing accretion. Landward of this zone, the two measurement sites located in the
Point-scale variations ranged from 104.3 mm to −96.0 mm. coral algal zone showed differing responses, with negligible
Results at the reef pavement location (CRAM Site 4) showed change at Site 2 and net accretion at Site 3 at ~3.1 ± 10.2 mm.y−1,
minor topographic change. Aggregated measurements at the plot which is half the rate of growth recorded at the adjacent reef crest.
scale suggest net change was −0.5 ± 1.8 mm.y−1, within the Our most landward location (65 m from the reef crest) showed
margin of error of CRAF detection (Table 1, Fig. 2d, Supple- negligible change of the reef flat pavement surface, which is lar-
mentary Fig. 7). Annual net changes were −1.7 ± 3.4 mm.y−1 and gely devoid of calcifiers and supports an epilithic algal matrix
0.7 ± 2.2 mm.y−1 for 2019 and 2020 respectively. Within plot which encourages grazing and carbonate removal by reef herbi-
transect scale values of net surface, change ranged from vores. Measurements recorded at this location indicated that the
4.6 ± 2.2 mm.y−1 to −3.8 ± 1.1 mm.y−1, with 57% of transects reef surface under most transects exhibited minor surface low-
indicating minor surface lowering. Point-scale changes varied ering (mean net change of −0.5 ± 1.8 mm.y−1) though within the
between 16.8 mm and −13.1 mm. measurement error. In general, our accretion rates are similar to
those determined on experimental surfaces on reef crest and reef
flat environments on St Croix, West Indies, with values up to
Discussion 5.2 mm.y−1 and 0.5–1.0 mm.y−1 respectively39. Furthermore, the
We present direct quantitative measurements of contemporary accretion rates for the reef crest (up to 6.6 mm.y−1) and outer reef
changes in topography and net vertical accretion/growth of a flat (up to 3.1 mm.y−1) fall within the range reported for wind-
coral reef crest and reef flat surface, the critical zone that induces ward coralline algal-dominated framework facies during the
wave breaking and dissipation in Indo-Pacific reef systems, and Holocene, as derived from Indo-Pacific core records9.
which afford protection to coastlines. Significantly our data, from Aggregated CRAM plot results yield values of net vertical change
a site in the Maldives where climate change induced sea-level rise in the reef surface that integrates the complex combination of
COMMUNICATIONS EARTH & ENVIRONMENT | (2022)3:9 | https://doi.org/10.1038/s43247-021-00338-w | www.nature.com/commsenv 5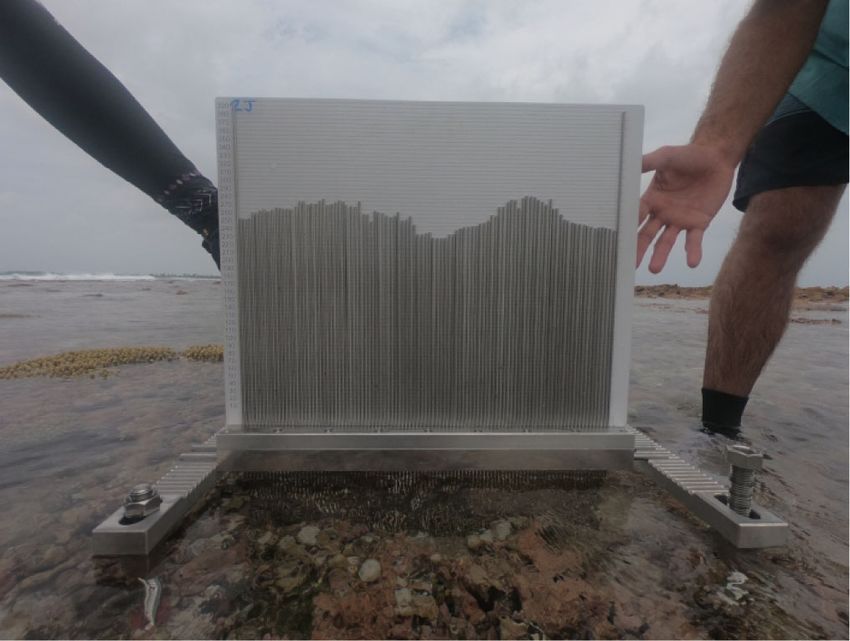
ARTICLE                                                                 COMMUNICATIONS EARTH & ENVIRONMENT | https://doi.org/10.1038/s43247-021-00338-w

                       a) 400                                                                   b) 400
                                                         19.3 mm.yr-1           Site 1-J                                   Site 1-X1
                                                                                                                 350

                        Elevation (mm)
                                         350

                                                                                                Elevation (mm)
                                                                                                                                        6.0 mm.yr-1
                                         300                                                                     300

                                         250                                                                     250

                                         200              Nodular                                                200         Encrusting red coralline algae
                                                      calcareous algae
                                         150                                                                     150
                       c) 350                                                                   d) 350
                                                   Site 2-E2                                                               Site 3-X1
                                                                         -1
                                                            10.4 mm.yr

                                                                                                Elevation (mm)
                        Elevation (mm)

                                         300                                                                     300               4.6 mm.yr-1

                                         250                                                                     250

                                         200                                                                     200
                                                            Pocillopora sp.                                            Encrusting Porites sp.

                                         150                                                                     150
                       e) 400                                                                   f) 400
                                                   Site 1-A                                                                Site 1-D1
                        Elevation (mm)

                                         350                                                                     350

                                                                                                Elevation (mm)
                                                                              -56.9 mm
                                                                                                                                                  121 mm
                                         300                                                                     300

                                         250                                                                     250

                                         200                                                                     200

                                         150                                                                     150
                                               0       10         20    30        40       50                          0       10       20    30       40         50
                                                                   X (cm)                                                                X (cm)
                                                     2018            2019          2020                                     2018           2019            2020

Fig. 3 Summary reef surface topographic change processes observed in coral reef accretion frame transects. a Nodular calcareous algae growth. b
Incremental growth of encrusting red coralline algae-dominated transect. c Growth of Pocillopora sp. d Growth of encrusting Porites sp. e Structural loss of
substrate. f Overgrowth of fissure in reef surface by calcareous algae. Location of transects noted in each panel, and Fig. 2. Grey shading highlights zones of
analysis. Values in a–d are the mean changes across both years of measurement. Arrows highlight zones of marked change in reef elevation. Results for all
transects are contained in Supplementary Figs. 4–7.

eco-geomorphic processes that contribute to reef growth (con-                                   promote near instantaneous change in surface elevation. Lower
structive and destructive). Examination of the point (millimetre-                               magnitude rates of surface lowering identified at more landward
scale) measurements along each CRAF transect provide insights on                                sites may be caused by bioerosion actions of echinoderms49 and
a number of these key processes. Rates of growth of key calcifying                              parrot fish50,51. Second, marked increases in reef level of up to
organisms can be determined where point-measurements are co-                                    120 mm are detected, focused around smaller (cm-scale) fissures
located with known living cover. For example, nodular calcareous                                in the reef surface (e.g., Figs. 2a, 3f). Such marked increases are
algae achieved growth rates of up to 17 mm.y−1 and 21.7 mm.y−1                                  attributed to either detrital fill of fissures and/or their closure by
in each year (mean = 19.3 mm.yr−1, Transect 1-J, Figs. 2a and 3a).                              lateral expansion of CCA or corals. These mechanisms of reef
Transects dominated by encrusting red coralline algae also show                                 development have previously been widely recognised in paleo-
incremental increase of ~4.0–6.0 mm.y−1 (e.g., Site 1-X1, Figs. 2a,                             reconstructions of reef growth, based on the amount of detrital
3b). Growth rates of encrusting corals, as expressed as mean net                                material comprising the reef matrix9,52, however, our observa-
vertical accretion rates, ranged from up to 11.0 mm.y−1 for Pocil-                              tions reveal the rapid temporal scale that these mechanisms can
lopora sp. (Site 2-E2, Figs. 2b, 3c) and ~6.0 mm.y−1 for encrusting                             influence reef development in a contemporary setting.
Porites sp. (Site 3-X1, Figs. 2c, 3d). The high rates of growth of                                 Functionally, it is the absolute change in reef crest/flat elevation
CCA and corals in this high energy, shallow water (high light) zone                             that is most important with respect to the wave dissipation and
are consistent with previous estimates of calcification within the                               the wave buffering role of coral reefs, rather than the specific
archipelago40–42 and they also sit within the range of values                                   mechanism of change. Our site-specific observations of reef sur-
reported from other reef-building provinces43–48.                                               face development underscore the importance of a suite of reef
   Changes in reef surface topography reveal a highly dynamic                                   growth mechanisms that contribute to reef development. In
surface, with maximum and minimum vertical differences of                                       particular, while linear vertical growth of calcifying organisms is a
138.4 mm y−1 and −92.0 mm y−1 (Table 1). Of note, variability                                   critical factor, other biological and physical processes also con-
in surface topography was greatest at sites with higher living                                  tribute to reef development (e.g., detrital infill, rubble sheets,
calcifier cover and rugosity. Close examination of such high-                                    storm deposits)53. This entire suite of processes must be con-
magnitude changes between years also highlights other process                                   sidered in assessing future changes in elevation of reefs and their
dynamics that affect reef accretion patterns. First, significant                                 capacity to persist as important wave buffering structures1.
losses in vertical structure are identified within years (e.g., up to                               Results also provide estimates of net calcium carbonate budgets
57.0 mm, Figs. 2 and 3e) that are likely attributable to physical                               at our reef sites, and which are reef zones that are seldom studied
impact damage in the turbulent wave breaking zone that can                                      (Fig. 1b), for comparison with studies based on census-based

6            COMMUNICATIONS EARTH & ENVIRONMENT | (2022)3:9 | https://doi.org/10.1038/s43247-021-00338-w | www.nature.com/commsenv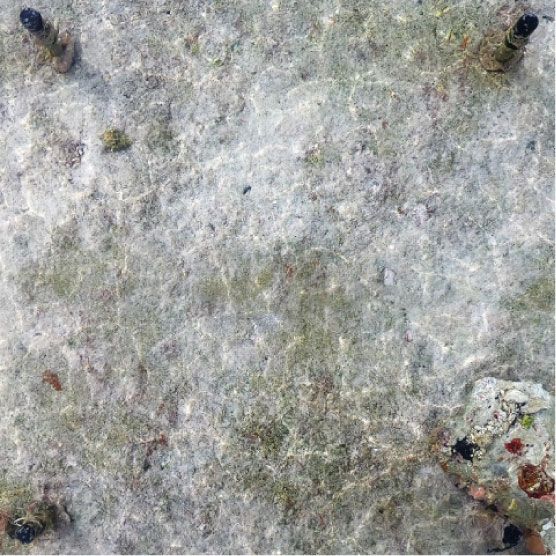
COMMUNICATIONS EARTH & ENVIRONMENT | https://doi.org/10.1038/s43247-021-00338-w                                                  ARTICLE

approaches (G, where G = CaCO3 Kg m−2 yr−1). Production                     landward reef flat zones are below the anticipated future rates of sea
rates at the outer reef crest range from 8.51 and 12.51 G (mean             level change, and the recorded spatial variability in accretion rates
10.39 G). Values are comparable to the upper range of reef pro-             suggests broader structural transformations and relative submergence
duction values reported in the Caribbean54,55; Indian Ocean56               of the central reef flat surface may occur. The implications of such
and western Pacific29,30, though these studies focus on forereef             structural change must be considered in revised wave modelling
environments. Significantly, the high rate measured at the reef              studies to examine island erosion, flooding and vulnerability7,60–63.
crest is also comparable to early estimates of production on outer          These findings highlight the pressing need for continued measure-
reef flat surfaces34,36,57. Further landward, in the narrow coral-           ment of reef flat accretion rates, and expansion of measurements to
algal zone, carbonate production values range from −1.11 to                 other representative reef sites.
4.98 G (across Sites 2 and 3) with a mean value of 2.35 G, also                It is important to recognise a number of spatial and temporal
consistent with the values reported from reef flat surfaces35,57,58.         limitations of our data. First, our dataset comprises a small
The algal pavement zone had lower production values ranging                 number of sample sites, though ecological surveys indicate they
between −2.69 and 1.15 G (mean −0.77).                                      are representative of actively calcifying eco-geomorphic zones on
   Our results also highlight local-scale variability in reef growth        the reef flat at the field site (Methods, Supplementary Note 1).
rates specific to eco-geomorphic zones, which can be masked in               Consequently, extrapolation of findings from this small dataset is
aggregated reef system analyses. The reef rim at the study location         constrained. Additional measurement sites within the eco-
has maintained a positive accretion state. Notably, recent studies          geomorphic zones in Huvadhoo atoll, and between different
from the same atoll have indicated a recent collapse in reef                reef sites in the Maldives is necessary to support broader extra-
accretion state (to −0.4 mm.yr−1) at depths of 5 m on the forereef          polation and robust predictions of future reef growth at the
of lagoonal systems following a major bleaching event in 201637.            archipelagic scale. Second, our accretion estimates do not incor-
This evidence has subsequently been used to infer broader col-              porate a range of other processes that may also affect reef
lapse of carbonate budget states in the Maldives and to predict a           accretion performance over medium timescales. For example, the
prolonged period of suppressed budget and reef growth that                  dataset was generated across a timeframe of normal wave energy
would promote reef submergence and island instability4,37. Our              conditions, during which there was an absence of significant
data indicate that in contrast to the fore-reef of lagoonal plat-           storm events (Supplementary Fig. 8). Due to its proximity to the
forms, the outer algal rim of the ocean reef flat has maintained a           equator storms are infrequent at the field site59. However, when
productive state within two years of this major bleaching event             such events do occur, they could promote reef damage64 causing
(~6.6 mm.yr−1), and is consistent with both pre-bleaching                   reef development to follow the intermediate disturbance
estimates4,20 and with a study showing a positive carbonate                 hypothesis of reef accretion punctuated by degradation65. In this
production state of a lagoonal reef platform surface shortly after          circumstance, our results may be skewed to higher accretion
the bleaching event33. Collectively these studies highlight the             values than if the negative impact of infrequent storms had
spatial heterogeneity in growth rates that depend on the reef               influenced our measurement period. However, storms may also
sector and zonal depth under investigation. They also demon-                generate rubble from the forereef, which if deposited on the reef
strate that habitat-related responses to climate disturbance vary,          flat, could promote a step change in reef flat level53. Of note, a
and are dependent on ecological community composition of each               storm rubble tract is present on the outer reef (Supplementary
eco-geomorphic zone. Such findings suggest inferences on mor-                Fig. 1d) and if this situation were to recur our results may be
phological and hazard consequences for islands, based on ana-               skewed to lower accretion values due to the absence of storms
lyses of reef-slope sectors that are of secondary importance to the         during the study period. Ongoing monitoring that incorporates
critical reef crest zone that induces wave breaking, should be              such events will be essential to understand how storms impact
made with caution acknowledging the unevenness in reef growth               reef accretion rates; and improve confidence in the extrapolation
rates between different reef habitat zones.                                 of our reef accretion rates over the medium-term. Furthermore,
   Here we compare our measured rates of contemporary reef                  as the central reef flat undergoes submergence due to sea-level
accretion against current and future projections of sea level over          rise, expansion of productive cover from the CCA/coral zone may
the next century (Fig. 4). Significantly the CCA-dominated reef              enable the broader reef flat, which is currently intertidal, to
crest accreted at a rate of 6.6 mm.yr−1 in each 12-month period             recolonize and resume vertical growth. The rate of such recolo-
(2018–19; 2019–2020). Such growth, exceeds the current rate of              nization and growth will determine the absolute degree of reef flat
sea level change in the archipelago (3.46 ± 0.25 mm.yr−1)59, and            submergence. Additional environmental stressors are also likely
is comparable to the RCP 4.5 scenario (6.9 mm.yr−1) but is less             to impact calcification at the reef rim including, ocean acidifica-
than the RCP 8.5 projection (9.6 mm.yr−1), although the varia-              tion, ocean warming, and the magnitude and frequency of
bility in accretion rates does span this higher rate of sea level           bleaching events. As projected by Cornwall20 such stressors are
change. Although variable, mean accretion rates at the outer reef           likely to negatively impact the accretion rates of contemporary
flat sites (sites 2 and 3) match current rates of sea level change           reefs and influence the structure and topography of reefs. How-
where there is productive cover, though are less than both the              ever, contrary to this view, our data show high rates of growth at
RCP4.5 and RCP8.5 scenarios. Site 4, with low coral-algal and               the atoll reef algal rim two years after a major bleaching episode
coral cover, currently has no functional accretion capacity and             in 201637. These measured growth rates are comparable to
falls below current and future rates of sea level change.                   reported pre-bleaching growth rates4,20, suggesting that CCA may
   If the observed rates of reef accretion persist, our results suggest     be an important calcifier that can maintain active vertical growth
that accretion of the reef crest may continue under moderate rates of       in the wave-breaking zone following periods of elevated sea
sea level change. Consequently, the short-term measurements                 surface temperatures. As the CRAF method integrates the suite of
reported here indicate that the reef crest may retain the potential to      processes that result in net changes in reef elevation, we suggest
develop its structure and maintain its function as an effective barrier     that ongoing monitoring of reef accretion rates will provide a
to incident wave energy. The ability of the algal-dominated reef crest      ground-truthed quantitative basis to assess the impact of these
to ‘keep pace’ with sea level is consistent with geological interpreta-     additional stressors on medium-term reef growth.
tions of the growth performance of windward reef crests in the Indo-           This study demonstrates the value of detailed, site-specific,
Pacific, that yielded thick algal crusts and dense reef framework            direct measurements of reef surface topographic change for the
(coralline algal facies)9. However, observed rates of accretion of the      study of contemporary and future reef trajectories. The CRAF

COMMUNICATIONS EARTH & ENVIRONMENT | (2022)3:9 | https://doi.org/10.1038/s43247-021-00338-w | www.nature.com/commsenv                          7
ARTICLE                                                               COMMUNICATIONS EARTH & ENVIRONMENT | https://doi.org/10.1038/s43247-021-00338-w

                                                      30
                                                                     +6.59

                                  Accretion (mm/yr)
                                                      20                                                            +3.04

                                                                                         -0.07
                                                      10                                                                                         RCP8.5
                                                                                                                                                 RCP4.5
                                                                                                                                            -0.77 Current
                                  Erosion (mm/yr)      0

                                                      -10

                                                      -20   Site 1              Site 2                     Site 3                  Site 4

                                                               2018-19            2019-20                  2018-20             mean change 2018-20
                                                      -30

Fig. 4 Comparison of reef accretion rates at outer reef flat sites in Huvadhoo atoll with current and future projections of sea-level rise. Results for each
site are presented for each year and the aggregated annual mean across the experimental period. Sea-level rise scenarios presented are the contemporary
rate of change in the southern Maldives of 3.46 ± 0.25 mm.y−1, and the global scenarios of RCP 4.5 = 6.9 mm.y−1 and RCP 8.5 = 9.6 mm.y−1. Note, rates
of change at site four sit within the margin of error of CRAF measurements and indicate no net change. Boxes represent the interquartile range from the
25th to 75th percentiles, horizontal black line is the median, whiskers represent the minimum and maximum values.

method provides valuable and repeatable quantitative measure-                                    11.4 km long section of the reef rim on the southern and western side of Huvadhoo
ments of contemporary net reef accretion at a finer temporal and                                  (Supplementary Fig. 1b, c). This sector of the reef structure varies in width between
                                                                                                 0.85 and 1.4 km and the platform provides the basement for 11 vegetated reef
spatial resolution than has previously been reported. The fine-                                   islands.
scale resolution of data affords opportunities to examine in detail                                  The experimental site is the outer reef flat seaward of the vegetated island
the process of contemporary reef development and can be used to                                  Keleihutta (Supplementary Fig. 1c). The topography of the reef and reef flat at this
validate reef budget estimates. Establishment of additional mon-                                 location is typical of the ocean reef morphology around the atoll, and is also similar
itoring sites will provide the basis for robust extrapolations of                                to other sea level constrained atoll rim reefs throughout the Indo-Pacific. The
                                                                                                 upper forereef, between depths of 0–15 m is characterized by a well-defined spur
future reef growth and enable issues of scale in future projections                              and groove structure (Supplementary Fig. 1c, d). The forereef has a steep gradient
to be better resolved. Furthermore, establishment of new sites                                   that terminates in a sharp break in slope at the reef crest at an elevation of −0.52 m
across different reef regions, and reef types, will provide essential                            below mean sea level (MSL). The reef flat surface is near horizontal ranging in
comparative data on contemporary reef growth performance.                                        elevation from −0.46 to −0.41 m below MSL on the outer reef flat (100 m section
                                                                                                 landward of the reef crest) and between −0.41 and −0.25 m MSL on the central to
Ongoing monitoring will also provide verification of projections                                  inner reef flat. Of note, a coral cobble/boulder tract comprising clasts up 0.5 m in
of physical reef response to a suite of environmental changes20                                  diameter is located on the outer reef flat. Its seaward edge begins approximately
and can inform ongoing refinement of models that predict reef                                     45 m landward of the reef crest, reaching an elevation of −0.09 m MSL
growth trajectories, as well as models that resolve the effectiveness                            (Supplementary Fig. 1c–e). This boulder tract extends approximately 30–35 m
                                                                                                 across the reef flat as a contiguous unit, beyond which cobble tongues extend
of reefs as wave dissipating structures. Thus, the changing char-                                further across the reef surface and overly the coral-algal pavement
acter of wave-induced flood and erosion hazard impacts on reef-                                   (Supplementary Fig. 1d). The intertidal reef flat acts as an effective buffer to
adjacent island coastlines can be more robustly assessed.                                        incident ocean wave energy, reducing energy by 90% across the reef crest
   Our method and data provide direct contemporary measures of                                   (Supplementary Fig. 2).
reef accretion capacity at the shallow reef crest, the zone critical to
wave breaking. The results show that the contemporary accretion
                                                                                                 Oceanographic processes. The ocean wave climate of southern Huvadhoo is
rate observed during the two-year study period can keep pace                                     influenced by local wave processes generated by seasonal monsoon winds, periodic
with current rates of sea-level rise. While additional measure-                                  storms and long period swell waves generated by large low-pressure systems that
ments and analysis from representative reef regions are necessary                                originate in the Southern Ocean59,67. A seasonal distinction can be made in the
to establish a robust global understanding of contemporary and                                   wave climate, with lower swell and offshore winds at the study site typically per-
                                                                                                 sisting during the dry season (between December and February), and a mixture of
future reef accretion rates, the findings provide the first step in                                onshore wind-driven waves and larger long period swell during the wet season
underscoring the importance of focused climate mitigation stra-                                  (between April and September) (Supplementary Fig. 8). Significant wave height
tegies to minimize rates of sea-level rise to enable coral reefs to                              offshore of Huvadhoo is typically just over 1 m during the dry season and ~1.95 m
maintain relative elevation and therefore continue to afford                                     during the wet season. However, there can be significant variability in Hs values
adjacent shorelines protection from ocean wave energy.                                           about the mean with maximum monthly Hs values ranging from ~2 m in the dry
                                                                                                 season to ~3.8 m in the wet season respectively. Daily average Hs values throughout
                                                                                                 the experimental period indicates the wave climate was consistent with long-term
                                                                                                 trends with maximum average daily Hs values peaking at ~3.2 m (Supplementary
Methods                                                                                          Fig. 8). The field site is located close to the equator and consequently, is not affected
Field location. This study develops and implements a direct and repeatable                       by frequent extreme wave events. However, larger storms do infrequently occur59,
approach to measure changes in reef surface topography in the critical reef crest                that can flood nearby islands, though no extreme events impacted the site during
zone that induces wave breaking. Detailed changes in the topography of the reef                  the experimental period.
surface were measured on the southern exposed atoll reef rim of Huvadhoo atoll                       Monthly mean sea surface temperatures in the Maldives range from 28.0 to
(0o32’ N, 73o17’ E), in the southern Maldives archipelago (Supplementary Fig. 1).                29.7 °C68. However, the archipelago has been subject to a number of coral
Huvadhoo is the largest discrete atoll in the archipelago with a reef rim perimeter              bleaching events associated with sustained elevated SSTs in excess of 30.9 oC in
of 261.4 km and a reef area of 3,279 km2 66. The atoll rim structure rises steeply               1987/88, 1998 and most recently in 201637. Peak SSTs during these events exceed
from oceanic depths >2000 m, terminating at the reef crest near modern sea level                 32.5 oC which has been reported to have had a major impact on the living cover of
(Supplementary Fig. 1c–e). The study examined reef flat growth midway along an                    corals across the archipelago37,38.

8             COMMUNICATIONS EARTH & ENVIRONMENT | (2022)3:9 | https://doi.org/10.1038/s43247-021-00338-w | www.nature.com/commsenv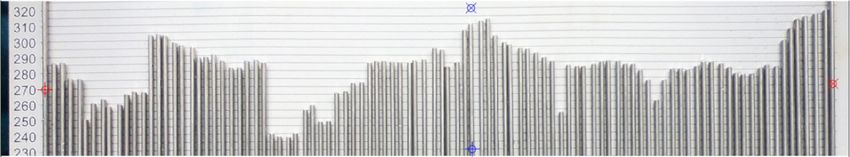
COMMUNICATIONS EARTH & ENVIRONMENT | https://doi.org/10.1038/s43247-021-00338-w ARTICLE
Analysis of sea level records since 1987 from Gan in the southern Maldives59
indicates that sea level in the southern archipelago has increased at a mean rate of a)
3.46 ± 0.25 mm.y−1. Interannual oscillations in mean sea level (MSL), influenced
by climate phenomenon such as ENSO and the Indian Ocean Dipole (IOD) are
also present in tide gauge measurements with an amplitude in the order of 0.2 m.
The atoll is subject to a semi-diurnal tidal regime with a spring tide range of 0.96 m
Level
with a pronounced diurnal inequality59. Of relevance to this study, sea-level records 99 measurement
from Gan show a pronounced sea-level fluctuation between 2018 and 2020 measuring platform
(Supplementary Fig. 9). During the study sea-level in the southern Maldives was rods Bolt
typically 20–50 mm above MSL but fluctuated by 200 mm, peaking at 150 mm
above MSL in July 2019 (150 mm above MSL; Supplementary Fig. 9). This peak in
sea level was associated with a strong positive IOD index.
Experimental sites. Four experimental sites were established across the first 65 m
of reef surface from the reef crest (Fig. Supplementary 1c–e) to capture transitions
in the eco-morphological characteristics of the outer reef flat. Eco-geomorphic Level
characteristics were determined through a combination of topographic surveys bars
(Supplementary Fig. 1e), field observations, and ecological surveys (Supplementary
Note 1 and Supplementary Tables 1 and 2). Four distinctive zones were differ-
entiated. The high energy reef crest (outer 20 m) where the cover of calcifying
organisms is dominated by CCA (30.8% cover) with encrusting corals (14% cover);
the outer reef flat which has CCA (32.9%) and a higher prevalence of corals b)
(27.9%); a distinctive and narrow boulder tract (Supplementary Fig. 1d, e) with less
than 5% cover of calcifying organisms; and, the coral pavement zone that char-
acterises the central reef flat where the cover of calcifying organisms is low (CCA
~3.1% and corals ~8.5%). Experimental sites were established at random on the
outer reef crest, the outer reef flat (two sites), and reef pavement zones. Due to
gross rugosity characteristics a site was not established in the boulder tract.
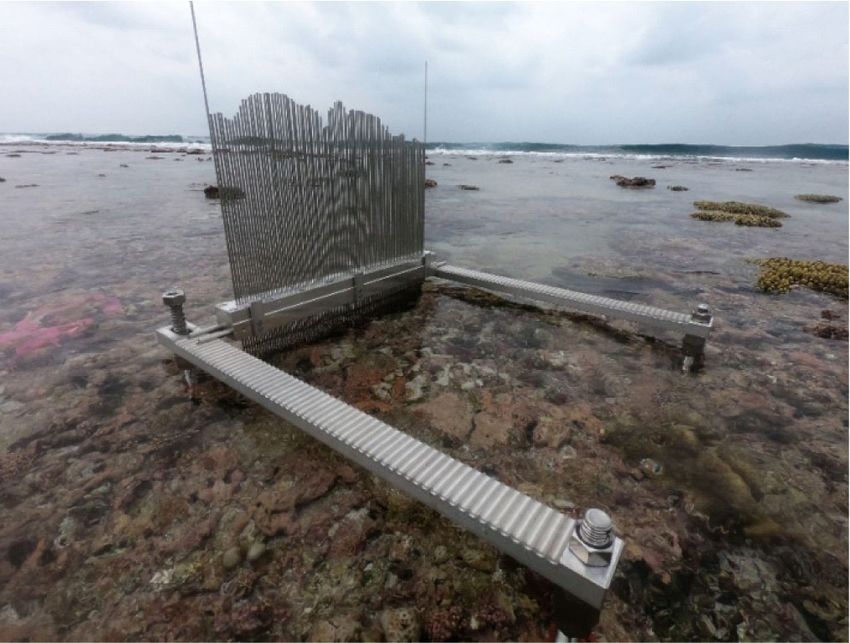
Coral reef accretion frame measurements. At each site measurements were
obtained using a purpose-built coral reef accretion frame (CRAF) designed to
enable repeatable millimetre-scale measurements of reef surface elevation from a c)
fixed and relocatable horizontal reference plane across 0.25 m2 plots (Fig. 5). At
each measurement site a plot was established comprising four bolts, fixed vertically
into the reef substrate in a 600 × 600 mm square. Bolts were positioned and fixed to
ensure a level platform for measurements across each plot. Two bars are placed, in
parallel, on top of nuts fixed on bolts, to form a horizontal reference plane. Each
bar has 57 grooves at 10 mm spacings. A measuring platform, positioned per-
pendicular to the horizontal bars, locks into the grooves in each bar. An array of 99
vertical measuring rods (500 m long by 1.5 mm in width), are spaced at 5 mm
intervals along the measuring platform.
In this study seven transects were measured from the horizontal frame at each
site. Once a transect position is established, each rod is lowered through holes in
the measuring platform until contact is made with the reef surface. To capture the
data, a graduated scale was placed behind the measurement rods (protruding above
the measuring bar) and photographed to record the height of rods above the reef
surface along each line (Fig. 5c). Photographs were taken with known control
points to allow rectification of images. Images were analysed digitally in a
georeferenced framework to measure pin elevation and reconstruct the topography
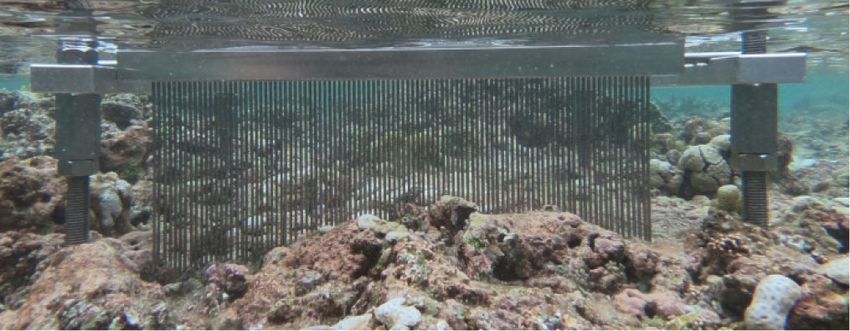
of the reef surface underneath each set of pin measurements (Fig. 6). Photographs
were rectified and imported into the Matlab function grabit.m.69. Within the
grabit.m function the image was calibrated to a known x-y scale (Fig. 6a). Fig. 5 Coral Reef Accretion Frame (CRAF) setup and measurement
Individual points were subsequently digitized (Fig. 6b). Digitising precision is
estimated at 0.5 mm and error is estimated at ± 0.3 mm, calculated as the mean system. a Components of the CRAF at Site 2 on the Keleihutta outer reef
absolute error between repeat digitising of an individual line. Digitised points were flat. b Below waterline view of measurement rods defining the reef flat
saved for each measurement and transformed to a common datum in relation to topography. c Image of graduated back board used to take in situ images of
the top of the measurement platform to reconstruct the topography of the reef the reef surface topography beneath the horizontal reference datum.
surface. In each plot, measurements were made along 7 equidistant lines, totalling
693 measurements per site.
CRAFs were installed in February 2018 and measured to provide the baseline
topography of each measurement line. Measurements were repeated in February Statistical analysis. Statistical analyses were performed using the software pack-
2019 and 2020 providing two complete annual cycles of reef surface change. age PAST, Version 4.0270. Assumptions for the tests applied were assessed by
Reduction of data to the same horizontal datum provides a basis to detect elevation examining the data for normality, and if the assumptions were not met, a non-
changes of the reef surface at each location (mm.y−1). Point specific changes were parametric test was substituted. Data were not transformed.
aggregated to yield the mean and range of topographic changes on each transect. Inter-site differences in total reef elevation change (mm) for the two-year
Values were also aggregated to the plot scale to generate mean values of surface observational period (2018–2020) were analysed by site using a one-way Kruskal-
change at each site (mm.y−1). Wallis test because the assumptions of parametric ANOVA were not met (the data
were not normally distributed). When differences between site were significant, a
post hoc Dunn test with Bonferroni adjustment method were used.
Measurement replication and error. To test the error associated with the mea-
surement technique 10 repeat measurements were made along one transect line
involving re-establishment of the measurement frame on each occasion (Fig. 7). Estimates of reef productivity. The CRAF method yields net changes in reef
This approach incorporated errors including the repositioning of the reference surface elevation (growth) that integrates the suite of reef growth and destruction
frame between measurement periods, and errors associated with rectification of processes. The study compares net productivity rates with previous studies based
images. Based on the square root of the sum of squares of each individual mea- on census-based reef budget approaches that yield net values of G (Kg.m−2.yr−1)28.
surement error the data indicates that the CRAF measurement error is ± 1.07 mm. To produce comparable G values, net reef growth values from CRAF measure-
Consequently, measurements that sit within this margin of error are considered to ments (mm−2.yr−1) were converted to a known volume of growth (m−3.m−2.yr−1)
reflect no detectable change in the reef flat surface. and converted to a weight of production using a density value of cacifiers using the
COMMUNICATIONS EARTH & ENVIRONMENT | (2022)3:9 | https://doi.org/10.1038/s43247-021-00338-w | www.nature.com/commsenv 9ARTICLE COMMUNICATIONS EARTH & ENVIRONMENT | https://doi.org/10.1038/s43247-021-00338-w
Load Image E:\KRAF Feb 2018\KRAF3\Analyse\D1.jpg
a) Re-Calibrate Xo: 1 Xm: 99 Yo: 230 Ym: 320 Grab Points
Reset View
320
Elevation (mm)
300
280
260
240
b) 320
320
310
Elevation (mm)
300
300
290
280
280
270
260
260
250
240
240
230
1 20 40 60 80 99
Rod number
Fig. 6 Overview of steps in capturing the digital data from the CRAF. a Images are rectified and placed in a X-Y scale using the Matlab application
grabit.m. b Each rod is digitized to create X-Y points and reconstruct the topography of the reef surface.
90 3. Beck, M. W. et al. The global flood protection savings provided by coral reefs.
Nat. Commun. 9, 2186 (2018).
4. Perry, C. T. et al. Loss of coral reef growth capacity to track future increases in
Elevation (mm)
80 sea level. Nature. 558, 396–400 (2018).
5. Reguero, B. G. et al. The value of US coral reefs for flood risk reduction. Nat.
70 R1 R6 Sustain. 4, 688–698 (2021).
R2 R7 6. Tuck, M., Kench, P. S., Ford, M. R. & Masselink, G. Wave overwash processes
R3 R8 provide mechanism for reef island to keep up with sea level rise. Geology. 47,
60 803–806 (2019).
R4 R9
7. Beetham, E. & Kench, P. S. A global tool for predicting future wave-driven
R5 R10
50 flood trajectories on atoll islands. Nat. Commun. 9, 3997 (2018).
1 20 40 60 80 100 8. Perry, C. T., Spencer, T. & Kench, P. Carbonate budgets and reef production
CRAF pin number states: A geomorphic perspective on the ecological phase-shift concept. Coral
Reefs. 27, 853–866 (2008).
Fig. 7 Results of repeat measurements along transect line D4 at CRAM 9. Montaggioni, L. F. History of Indo-Pacifc coral reef systems since the last
glaciation: Development patterns and controlling factors. Earth Sci. Rev. 71,
site 4 to evaluate instrument repositioning errors. Location of site shown
1–75 (2005).
in Supplementary Fig. 1d. 10. Storlazzi, C. D., Elias, E., Field, M. E. & Presto, M. K. Numerical modelling of
the impact of sea-level rise on fringing coral reef hydrodynamics and sediment
following equation: transport. Coral Reefs 30, 83–96 (2011).
11. Quataert, E. et al. The influence of coral reefs and climate change on wave-
Net production rate G ¼ ðVACF =1000Þ ´ Di driven flooding of tropical coastlines. Geophys. Res. Lett. 42, 6407–6415
Where G is production in kg CaCO3 m−2.y−1, VACF is net vertical reef accretion in (2015).
mm.m2.y−1, and Di is density of calcifiers (kg.m3). This analysis adopted a mean 12. Alvarez-Filip, L., Dulvy, N. K., Gill, J. A., Côte, I. M. & Watkinson, A. R. 2009.
density value of 1,576 kg.m3 as the mid-range of values of the ReefBudget method28 Flattening of Caribbean coral reefs: Region-wide declines in architectural
and those established from the Maldives40. complexity. Proc. R. Soc. B 276, 3019–3025 (2009).
13. Sheppard, C., Dixon, D. J., Gourlay, M., Sheppard, A. & Payet, R. Coral
mortality increases wave energy reaching shores protected by reef flats:
Comparison of measured rates of reef accretion with rates of sea-level rise. Examples for the Seychelles. Estuar. Coast Shelf Sci. 64, 223–234 (2005).
We compare the measured rates of reef accretion at the reef crest and outer reef flat
14. Perry, C. T. & Alvarez-Filip, L. Changing geo‐ecological functions of coral
zones against recently observed and future projected changes in sea level. Speci-
reefs in the Anthropocene. Funct. Ecol. https://doi.org/10.1111/1365-
fically, we compare rates of reef accretion against the current local rate of sea level
2435.13247 (2018).
change (3.46 ± 0.25 mm.y−1)59 and against the projected rates of sea-level rise to
15. Moss, R. H. et al. The next generation of scenarios for climate change research
2100 using the RCP4.5 and RCP8.5 scenarios71,72.
and assessment. Nature 463, 747–756 (2010).
16. Church, J. A. et al. in Climate Change 2013: The Physical Science Basis (ed.
Data availability Stocker, T. F. et al.) Ch. 13 Cambridge Univ. Press (2013).
Data generated from coral reef monitoring sites in this study are available at https:// 17. Perry, C. T. et al. Caribbean-wide decline in carbonate production threatens
doi.org/10.5281/zenodo.4321416. coral reef growth. Nat. Commun. 4, 1402–1409 (2013).
18. Hughes, T. P. et al. Spatial and temporal patterns of mass bleaching of corals
in the Anthropocene. Science 359, 80–83 (2018).
Received: 19 August 2021; Accepted: 20 December 2021; 19. Hughes, T. P. et al. Global warming impairs stock–recruitment dynamics of
corals. Nature 568, 387–390 (2019).
20. Cornwall, C. E. et al. Global declines in coral reef calcium carbonate
production under ocean acidification and warming. Proc. Nat, Acad. Sci. 118,
20e2015265118 (2021).
21. Levermann, A. et al. The multimillennial sea-level commitment of global
References warming. Proc. Nat. Acad Sci. 110, 13745–13750 (2013).
1. Ferrario, F. et al. The effectiveness of coral reefs for coastal hazard risk 22. Kopp, R. E. et al. Probabilistic 21st and 22nd century sea-level projections at a
reduction and adaptation. Nat. Commun. 5, 3794 (2014). global network of tide gauge sites. Earths Future 2, 383–406 (2014).
2. Graham, N. A. J., Jennings, S., MacNeil, M. A., Mouillet, D. & Wilson, S. K. 23. Rasmussen, D. J. et al. Extreme sea level implications of 1.5oC, 2oC and 2.5oC
Predicting climate-driven regime shifts versus rebound potential in coral reefs. temperature stabilization targets in the 21st and 22nd century. Environ. Res.
Nature. 518, 94–97 (2015). Lett. 13, 034040 (2018).
10 COMMUNICATIONS EARTH & ENVIRONMENT | (2022)3:9 | https://doi.org/10.1038/s43247-021-00338-w | www.nature.com/commsenvYou can also read