Technical Cleanliness in Electrical Engineering - Dirt is simply matter in the wrong place
←
→
Page content transcription
If your browser does not render page correctly, please read the page content below
Guideline

    Technical Cleanliness
in Electrical Engineering
      Dirt is simply matter in the wrong place
                                  2nd extended edition

                     PCB and Electronic Systems Division
             Electronic Components and Systems Division
Technical Cleanliness in Electrical Engineering
Published by:
ZVEI - Zentralverband Elektrotechnik-
und Elektronikindustrie e. V.
ZVEI - German Electrical and Electronic
Manufacturers’ Association
PCB and Electronic Systems Division
Electronic Components and Systems Division
Lyoner Strasse 9
60528 Frankfurt am Main, Germany
Phone: +49 69 6302-437
Fax: +49 69 6302-317
E-mail: pcb-es@zvei.org
www.zvei.org
Responsible:
Peter Trunz
PCB and Electronic Systems Division
In collaboration with:
Peter Fischer, BaTiLoy GmbH
Jennifer Kordel, BaTiLoy GmbH
Thomas Zeike, Continental AG
Ralf Kuballa, Hella GmbH & Co. KG a.A.
Dr. Petrik Lange, Hella GmbH & Co. KG a.A.
Dr. Oliver Fastje, Kolb Cleaning Technology GmbH
Christian Smits, Kolb Cleaning Technology GmbH
Christian Daum, Kostal Kontakt Systeme GmbH
Frank Petri, Kostal Kontakt Systeme GmbH
Dr. Marc Nikolussi, Robert Bosch GmbH
Jürgen Frey, TDK Electronics AG
Volker Seipel, TE Connectivity Germany GmbH
Andreas Zitz, TE Connectivity Germany GmbH
Harald Hundt, Vacuumschmelze GmbH & Co.KG
Dr. Helmut Schweigart, Zestron
Christian Sonnleitner, Zollner Elektronik AG
Michael Zimmerer, Zollner Elektronik AG
April 2019, 2nd extended edition
www.zvei.org
März 2018
        BY     NC   SA

This work is licensed under the Creative Commons
Attribution-Non-Commercial-Share Alike 4.0 Germany.
Despite utmost care for the content no
liability will be accepted.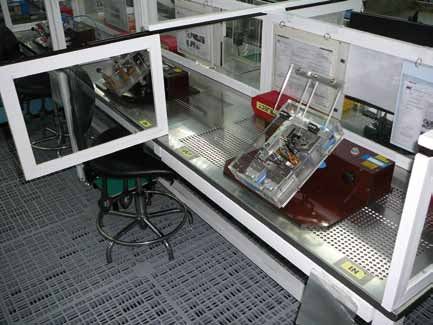
Contents   Foreword			                                                                6

            1    Introduction                                                         7

            2    Technical Cleanliness                                                8
           		2.1       What is technical cleanliness?                                 8
           		 2.2      History – standardisation of technical cleanliness             8
           		 2.3      Technical cleanliness in the electronics industry              9
           		 2.4      Scope of this guideline                                        9

           3		 Technical Cleanliness as a Challenge for Suppliers                    10
           		 3.1 Contamination                                                      10
           			         3.1.1 Definition of particles                                 10
                       3.1.2 Definition of fibres                                    11
           		 3.2 Inspection procedure to determine
           			    technical cleanliness                                              12
           			 3.2.1 Fundamentals                                                    12
               3.2.2 Clarification form                                              13
               3.2.3 System technology                                               13
               3.2.3 Process parameters for pressure rinsing extraction              14
               3.2.4 Process parameters for pressure rinsing extraction
               3.2.5 Pressure rinsing process                                        15
               3.2.6 Preparing membrane filters for technical measurement analysis   15
           		    3.3 Measurement analysis                                            16
           		    3.4 Evaluating the results of cleanliness analyses                  17
           			 3.4.1 “Introduction”                                                  17
               3.4.2 Particle count relative to component surface                    17
               3.4.3 Procedure for violation of action control limits                19
           		3.5 Extended risk assessment                                            19
                       3.5.1 Example                                                 20
           		3.6 Component cleanliness: Data management
           			   and visualisation                                                   21

           4		 State of the Art: Technical Cleanliness
           		 in the Electronics Industry                                            28
                 4.1 Process flow (per cluster)                                      28
           			 4.1.1         Electronics manufacturing cluster                       28
               4.1.2         Passive components cluster                              29
               4.1.3         Electromechanical components cluster                    30
           			 4.1.4         PCB cluster                                             31
           		 4.2 Technical cleanliness in the
           			    electronics industry – actual situation                            31
           			 4.2.1         Electronics manufacturing                               32
               4.2.2         Electronic components                                   32
               4.2.3         Electromechanical components                            36
           			 4.2.4         Metal housing                                           40
           			 4.2.5         Packaging                                               40
               4.2.6         Printed circuit boards (PCBs)                           41
           		 4.3 Determining potential particle sources
           			    in production                                                      43
           			 4.3.1         Particle generation                                     43
               4.3.2         Electronics manufacturing cluster                       43
               4.3.3         Passive components cluster                              44
               4.3.4         Electromechanical components cluster                    47
           			 4.3.5         PCB cluster                                             49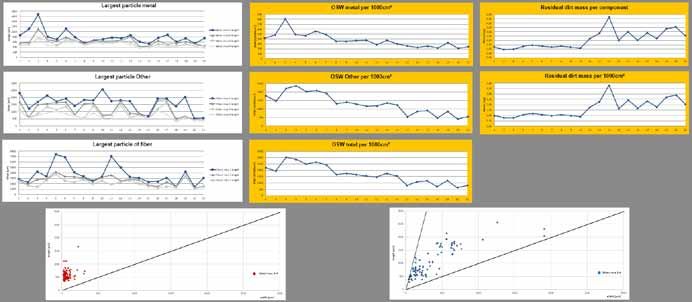
4.4 Cleanliness-controlled design and process selection 53
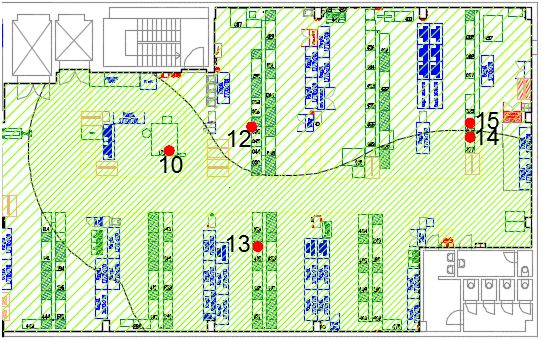
4.5 Environmental cleanliness and visualisation 56
4.6 Cleaning tips 60
4.6.1 Washing 60
4.6.2 Brushing 61
4.6.3 Suction-cleaning 61
4.6.4 Blowing 61
4.6.5 Reducing carry-over and controlling cleanliness
in workplace design 62
4.6.6 Adhesive methods 62
4.7 Packaging and logistics requirements 63
5 Why do metallic particles in assemblies so
rarely cause short circuits? 64
5.1 Probability of contact 65
5.1.1 Introduction and theory 65
5.1.2 Testing the probability of contact 67
5.1.3 Results 69
5.2 Rinsing extraction versus actual mobility 70
5.3 Particle sinks 70
5.4 Effect of short circuits on ICs 71
5.5 Tool for estimating the risk of short circuit 71
5.5.1 Introduction 71
5.5.2 Model hypotheses 72
5.5.3 Calculation methods 73
5.5.4 Orientation factor 73
5.5.5 Critical area 74
5.5.6 Number of particles per size class 75
5.5.7 Weighting factors 75
5.6 Example use of the risk assessment tool 77
5.6.1 Example use of the risk assessment tool for calculating failure rate 77
5.6.2 Example use of the risk assessment tool for design changes 78
5.6.3 Example use of the risk assessment tool for specification violations 79
6 Summary 80
7 Outlook 81
8 Related Topics 83
8.1 Ionic contamination 83
8.1.1 Filmic contamination 85
8.1.2 Biological films 85
8.1.3 Chemical films 85
8.2 Whiskers 85
9 Further Reading 87
10 Participating Companies 88
11 Appendix 90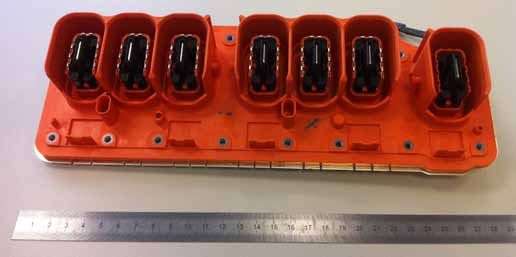
Foreword

           Component cleanliness refers to the absence        Foreword to the second extended and
           of particles on components which might             revised edition:
           otherwise impair downstream production             The first edition of the guideline on com-
           processes and/or adversely affect the perfor-      ponent cleanliness was published in 2013.
           mance of a component or assembly.                  Our understanding of technical cleanliness
                                                              has significantly increased in the meantime.
           A great number of different company stan-          In addition, VDA 19 has also been updated.
           dards have been created and developed              These developments have now been addressed
           based on national and international com-           in the second edition of the guideline on com-
           ponent cleanliness standards. This has lead        ponent cleanliness and on our online plat-
           to an accumulation of varying requirements         form at https://bauteilsauberkeit.zvei.org. As
           along the value chain, generating specifica-       well as several changes which ensure continu-
           tions that cannot be fulfilled.                    ing compliance with VDA 19, some chapters
                                                              have been extended. For example, the empiri-
           The approaches and methods detailed in VDA         cal values for components have been updated
           19 Part 1 and Part 2 are so generic that they      and expanded and a ‘clarification form’ for
           can be applied to the complete range of auto-      the cleanliness analysis has been proposed
           motive parts. Consequently, component and          (see: https://bauteilsauberkeit.zvei.org).
           product specialists should be consulted to
           solve specific questions concerning cleanli-       New content has also been added. For in-
           ness inspections and production issues.            stance, the guideline now includes a calcula-
                                                              tion tool (see: https://bauteilsauberkeit.zvei.
           This is where these ZVEI guideline comes in.       org) based on a scientific approach to assess-
           Cleanliness inspections according to VDA           ing the risk of an electrical short circuit
           19 Part 1 and the design and optimisation          caused by conductive particles. Furthermore,
           of cleanliness-controlled production areas         it covers topics such as environmental clean-
           according to VDA 19 Part 2 are examined and        liness, data management, and cleanliness-
           further defined specifically with regard to the    controlled design as well as examining other
           production of electric, electronic and electro-    related topics such as whiskers, film residues,
           mechanical components, circuit boards and          ionic and biological contamination
           electronic assemblies. The guideline aims to
           significantly improve the hitherto inadequate      We would like to thank all companies actively
           comparability of analysis results by adapt-        involved in the development of this guide-
           ing and specifying cleanliness inspection          line. Although this guideline is not binding, it
           processes specifically for the manufacture of      has already proved of benefit to practitioners
           electronic components and parts. It also sug-      during the past five years.
           gests a system for analysing the results statis-
           tically and presenting them in a comprehensi-
           ble manner. Furthermore, it provides targeted
           information for users about manufacturing
           steps     and     potential      contamination
           risks. In addition to covering measur-
           ing and optimisation issues related to a
           company’s level of technical cleanliness,
           this guideline also provides a joint basis for
           customer-supplier discussions. General lim-
           iting values – based on performance – were
           intentionally not specified in this guideline
           since levels of particulate contamination in
           the parts analysed varied considerably.

                                           6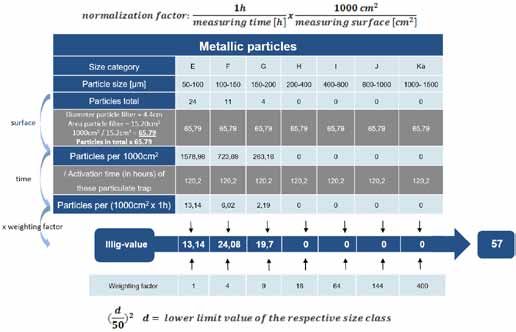
1   Introduction

             What is a clean component? How can I assess        The question of when a component is consid-
             a component’s cleanliness level? When is a         ered sufficiently clean can only be answered
             component considered heavily contaminated?         in the context of the relevant application. This
             These questions have long been an issue in         is the only basis for defining maximum parti-
             the manufacture of mechanical parts and            cle size and particle materials, when the per-
             must now be addressed by the electronics           formance of an assembly to be manufactured
             industry too as components become smaller          may be impaired, and how to ensure an unin-
             and component density correspondingly              terrupted production process. The limiting
             greater. Metallic particles, for example, may      values to be specified for particles ensure that
             cause short circuits and non-metallic particles    no particles outside the designated ranges
             may impair the correct assembly of circuit         are found on any component at the end of the
             boards.                                            manufacturing chain. Hence, a decision has
                                                                to be made as to whether
             To prevent these difficulties, suppliers and       • particles produced can be tolerated
             customers have in the past agreed on speci-        • process optimisations to avoid particle
             fications such as: “All components supplied           generation are necessary
             must be clean”, without specifying the clean-      • particles are directly scrapped at their
             liness level. Today, increasingly detailed spec-      source
             ifications deal with this subject.                 • all unwanted particles are specifically
                                                                   removed at the end of the manufacturing
             VDA 19 Part 1, for instance, describes the            line.
             conditions for applying and document-
             ing methods for determining the par-               Irrespective of the selected approach, one
             ticulate contamination of components.              difficulty remains: troublesome particles are
             It provides a basis for developing clean-          produced inadvertently rather than delib-
             liness inspections that are comparable             erately. They are a (sometimes undesirable)
             in terms of design and execution e.g.              by-product and can neither be controlled nor
             between customer and supplier. VDA 19 Part         prevented by (standard) statistical process
             2 serves as an additional aid in identifying       controls.
             and evaluating particle sources along the pro-
             duction chain.

                                             7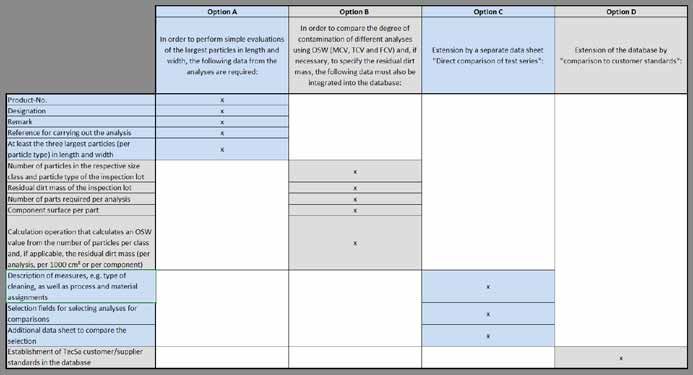
2 Technical Cleanliness
2.1 What is technical the retained particles) have been increasingly
cleanliness? adopted by other industries such as medical
technology, the optical industry, hydraulic
The term ‘technical cleanliness’ was coined by and mechanical engineering. Since there is
the automotive industry to address particle- no such thing as total cleanliness or purity,
related system interruptions in the automo- the focus should be on the most practically
tive industry. In contrast to ‘optical cleanli- feasible and economically viable solution
ness’, which relates to the cosmetic or visual for the designated location and purpose.
appearance, e.g. vehicle coating, technical
cleanliness always refers to the performance
of components, assemblies and systems. 2.2 History – standardisation of
technical cleanliness
Particulate contamination in the automotive
industry is often not limited to a certain area Contamination had been a growing prob-
but may migrate from a previously non-critical lem for the automotive industry since the
to a sensitive location and hence impair per- early 1990s as systems became increas-
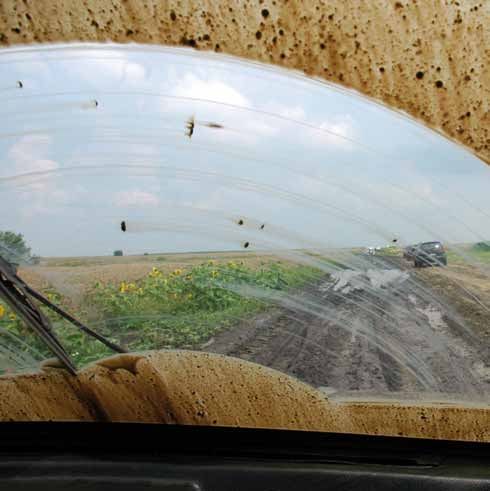
formance. For instance, a particle on the lens ingly complex and installation spaces
of a traffic sign detection camera may cause it ever smaller. The anti-lock braking
to malfunction. Similarly, a conductive parti- systems in general or direct fuel injection
cle from the aluminum cover of an electronic systems for diesel engines were particularly
control unit may cause a short circuit on the prone.
circuit board and undermine its performance.
This is why the cleanliness requirements of In some cases, customers and suppliers con-
the automotive industry often apply to com- cluded individual agreements about techni-
plete systems, whereby the most particle-sen- cal cleanliness to address the risk of potential
sitive component (weakest link in the chain) damage.
determines the cleanliness level and admis-
sible limiting values for the entire system and As a result, the automotive industry called
all components within it. With regard to com- for the introduction of general standards
ponents, technical cleanliness refers to the regulating the technical cleanliness of
specification, observance and verification of components. In summer 2001, TecSa was
limiting values, e.g. according to weight founded, an industrial alliance for techni-
of residual contamination, particle count, cal cleanliness. This panel published VDA 19
type and size. At the same time, the auto- “Inspection of Technical Cleanliness – Particu-
motive industry tolerates failures only in late Contamination of Functionally-Relevant
the ppm range. New stipulations are con- Automotive Components” in 2004, which was
tinuously being added to the existing speci- revised in 2015 and republished as VDA 19
fications. These are often tailored to suit Part 1. This guideline makes recommenda-
the specific requirements of a company or tions for inspecting the technical cleanliness
component and its performance. Their of automotive products.
scope of application is limited, i.e. they
are valid in-house and/or for suppliers. Its international counterpart is standard ISO
16232, which was published in 2007.
Although the term ‘technical cleanliness’ was
coined by the automotive industry, the pro- In 2010, VDA 19 Part 2 “Technical Cleanli-
cedures relating to cleanliness inspections ness in Assembly” was published, detailing
according to VDA 19 (liquid extraction, mem- cleanliness-related design aspects for assem-
brane filtration and subsequent analysis of bly areas.
8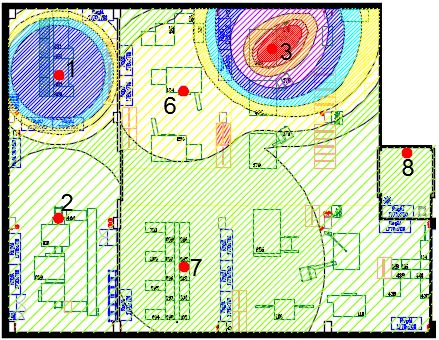
2.3 Technical cleanliness                          •   reduced wettability/solderability
in the electronics industry                        •   mechanical obstruction
                                                   •   increased or reduced friction
The industry increasingly uses the generally       •   increased or reduced power
valid VDA 19 guideline in addition to com-         •   leaks
pany-specific standards.                           •   …

This guideline proposes a system for design-       If the remaining particulate contamination –
ing and implementing component cleanliness         also called residual contamination – is suffi-
analyses to enable quantifiable comparisons        ciently low in a technical system to cause no
of component cleanliness levels. However,          short or long-term performance impairment or
VDA 19 does not specify any limiting values        system damage, the system is considered
for component cleanliness. These must be           adequately clean in the context of technical
defined according to component function,           cleanliness.
producibility and verifiability.

The aim of the ZVEI working group on compo-        2.4 Scope of this guideline
nent cleanliness was to produce a guideline
that supplements VDA 19 and ISO 16232 by           This guideline applies to the manufacture
addressing outstanding questions and provid-       of electric, electronic and electromechanical
ing practical solutions.                           components, circuit boards and electronic
                                                   assemblies that are produced with state-of-
The producibility of a component as well as its    the-art standard production methods and
performance must be considered in this con-        describes the resulting level of technical
text, as is the case when defining dimensional     cleanliness that can be expected from the
tolerances. Production processes, production       product and processes.
environment and final packaging also influ-
ence component cleanliness. This often calls       This guideline is a reference document
for agreements concerning compliance with          which serves to illustrate the technically fea-
limiting values between customer and supplier      sible options and provide a basis for customer
or product development and production. This        and supplier agreements. It is not intended
is particularly relevant in instances where lim-   to be regarded as a specification or standard,
iting values are exceeded without necessarily      nor does it cover the production of electric
impairing performance. A careful review must       motors, batteries, cable harnesses and relays.
be carried out to ensure that efforts to comply
with these values do not outweigh the poten-       Its primary focus is on component cleanliness
tial risk, thereby avoiding excessive cleanli-     with regard to loose or easily detachable par-
ness requirements.                                 ticles (labile particles). Film residues, ionic
                                                   and biological contamination are also cov-
Potential particle-related malfunctions            ered. It does not deal with the cleanliness of
Limiting values for component cleanliness          functional fluids and/or gases.
ensure component performance and should
be defined as early as possible during the         This guideline uses case studies to elabo-
component development stage. The following         rate on VDA 19, provides information about
possible malfunctions should be considered:        particle generation subject to processes and
                                                   materials, illustrates their impact on perfor-
•   electrical short circuit                       mance and reliability and describes suitable
•   shorter creepage and clearance distance        countermeasures.
•   electrical insulation of contacts
•   impairment of optical systems such as
    cameras

                                9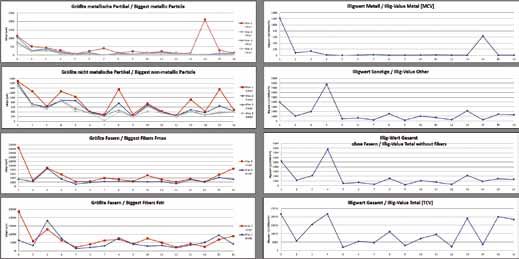
3   Technical Cleanliness as a Challenge for Suppliers

              In the past, drawings usually contained rather    In practice, cleanliness analyses according to
              general information on component cleanli-         VDA 19 are used for production releases or
              ness, which was not systematically verified.      requalification, during production and when
              Example:                                          there are reasonable grounds for suspicion.
                                                                Limiting non-metallic particle contamina-
              Parts must be free from contamination             tion (e.g. dust, lint, abrasion, etc.) poses a
              e.g. swarf, release agents, grease, oil,          further challenge to the supplier. If these
              dust, silicone…                                   particles are classified as functionally critical
                                                                and hence limited, account must also be taken
              With the publication of VDA 19/ISO 16232,         of the manufacturing environment, suitabil-
              standardised cross-company procedures were        ity for subsequent cleaning, packaging (to
              defined to record, analyse and document           maintain cleanliness) and logistical consider-
              component cleanliness information.                ations when determining the limit. Detailed
                                                                information is provided in VDA 19 Part 2. The
              General attributive provisions that had previ-    controlled production conditions (clean zone
              ously been customary and checked via visual       grades) necessitated by this require more
              inspection were replaced, e.g. by specifying      effort and expenditure. For this reason, it is
              particle size classes with maximum particle       advisable to determine limiting values only
              count, which can be verified by means of lab-     where functionally relevant.
              oratory analysis.

              The procedures to determine component             3.1 Contamination
              cleanliness according to VDA 19 are stan-
              dardised, reproducible and also more objec-       3.1.1 Definition of particles
              tive than previously applied methods. How-        VDA 19 Part 1 defines a particle as a solid
              ever, the following points should be observed     body composed of metal, plastic, minerals,
              when applying these procedures:                   rubber or a salt. Paste-like fractions are not
                                                                considered to be particles.
              • Particle generation may vary significantly,
                even from the same production glass.            The following terms and definitions for metal-
              • Particle detection depends on the method        lic and non-metallic particles apply to the ter-
                and quality of analysis.                        minology used in this guideline.
              • Inspections are costly and require a labora-
                tory.                                           3.1.1.1 Metallic particles
              • Measurement system analyses (MSA) are not       Metallic particles are particles that are primar-
                possible for the entire inspection process of   ily characterised by a shiny metallic, reflective
                technical cleanliness.                          surface. They can be detected through a com-
              • In-process inspections with associated regu-    bination of normal and polarised light imag-
                latory measures can be implemented only         ing. An optical microscope with the relevant
                after lengthy delays.                           features normally suffices for identifying
                                                                metallic particles.

                                            10
However, using optical microscopy for metal- 3.1.2 Definition of fibres
lic particle detection bears the following Component cleanliness analyses invariably
potential risks: detect textile fibres from clothing, which are
• Extremely small metallic particles or sin- ubiquitous in any production or laboratory
tered metals cannot be identified as metal- environment where people are present. Fibres
lic particles. are non-metallic particles, which, although
• Strongly oxidised metallic particles cannot usually mentioned in the test reports, are not
be identified as metallic particles. considered in the evaluation. To be classed as
• Reflective non-metals, such as glass, may a fibre, they must meet the following specific
be wrongly classified as metallic particles geometric boundary conditions in accordance
due to their reflective behaviour. with VDA 19 Part 1:
• stretched length / maximum incircle > 20
Since it would be too costly and time-consum- and
ing to differentiate between electrically con- • width measured across maximum incircle
ductive and non-conductive particles when ≤ 50 µm
assessing the technical cleanliness of the
production process, or indeed impossible, the In simple terms, this means that:
analysis concentrates on detecting metallic • the length-to-width ratio is 1:20 and
and shiny metallic particles. • the width of a fibre is ≤ 50 µm
Shiny metallic particles are generally assumed Notes on the definition:
to be both metallic and conductive. • Implementing this theoretical approach
with customary two-dimensional optical
It must be stressed that differentiating bet- test systems often lacks a certain amount of
ween metallic and non-metallic particles by precision.
their metallic lustre does not permit a reliable • Compared with previous definitions, a shift
distinction to be made regarding their electri- in the number of non-metallic particles
cal conductivity. and fibres must be envisaged with this
approach.
The following steps can be taken to avoid • Based on the current definition, a human
these pitfalls: Manually re-examine the big- hair with a thickness of approx. 60 – 80
gest metallic and biggest non-metallic par- µm would be classed as a non-metallic par-
ticles detected using an optical microscope. ticle rather than a fibre.
Subsequently reclassify these particles if nec- • In contrast, a glass or carbon fibre with a
essary. thickness of 40 µm would be classed as
a fibre rather than a particle, although it
Other systems such as EDX, Raman or laser- clearly has the potential to cause damage.
induced breakdown spectroscopy provide
more detailed and conclusive results. How- The following potential errors may occur
ever, this entails greater expenditure. when identifying fibres:
• Fibres with a strong curl cannot be detected.
3.1.1.2 Non-metallic particles • Particles may be wrongly identified as
Non-metallic particles are particles that are fibres if the width and height are very small
not primarily characterised by a shiny metal- in relation to the length (e.g. plastic burr).
lic, reflective surface. They contain no fibres. • Fibres positioned vertically to the mem-
brane (in the z-axis) may be analysed incor-
rectly or not at all.
• Fibres may be visually chopped” and not
detected as one fibre.
113.2 Test procedure to determine • pressure rinsing
technical cleanliness • ultrasonic techniques
• internal rinsing
3.2.1 Fundamentals • agitation
The technical cleanliness of components • air extraction
refers to the level of particulate contamina-
tion on the relevant surfaces of test objects. According to the ZVEI working group on
component cleanliness, ‘pressure rinsing’ as
The aim of cleanliness inspections is to deter- defined in VDA 19 has proved to be a reliable
mine and measure the particle count as accu- extraction method for a number of applica-
rately as possible. tions. Components are rinsed with liquid
pressure jets during this process. The liquid
VDA 19 describes the application methods is then filtered to separate the released par-
and conditions to determine and document ticles for further analysis.
particulate contamination. It also specifies
the different extraction and analysis methods.
The following extraction methods are sug-
gested for removing particles on electric,
electronic and electromechanical compo-
nents, circuit boards and electronic assem-
blies (hereafter referred to as ‘components’):
Fig. 1: Test method as per VDA 19 Part 1
Liquid extraction Air extraction
Extraction Pressure rinsing Ultrasonic techniques Blowing
Internal rinsing Agitation Perfusion
Filtration Analytical filtration
Standard analysis Detailed analysis Reduced analysis
Light Liquid particle
microscopy counter
length, width, other optical
fibre shape characteristics, Optical filter
Analysis optimal particle height (residue) analysis
metallic lustre
Gravimetric analysis REM/EDX
CT
LIBS
IR
Raman
12To properly evaluate the cleanliness level of How else can we ensure that comparable
the component, the pressure rinsing extrac- measurements have been analysed under
tion process must be qualified. This is done the same conditions, e.g. with the same filter
by repeating the process several times and types and the same mesh width?
reevaluating the results each time. The count
of extracted particles must continuously It is always advisable to design a clarification
decrease. By the sixth analysis at the lat- form that clearly defines those parameters
est, the particle count must be ≤ 10 percent which ensure comparability of analyses.
of the sum of all previous analyses (all rel-
evant particles in total). This is referred to as All options for performing an analysis must
an extraction curve. The extraction curve is a be specified (see Fig. 1).
prerequisite for series analyses and must be
determined once for each component type. This revised guideline now includes sample
clarification form templates for ‘environmen-
The cleanliness of an extraction system and tal cleanliness’ and ‘component cleanliness’
hence its suitability is determined without (see appendix). Not everyone who requires an
components. The same parameters are used analysis has the specialist knowledge required
for this component-free pressure rinsing pro- to complete a clarification form in full.
cess as for an analysis with components. The
particle count obtained provides the basis for For this reason the clarification form is
the release of the system for the next test and divided into two sections:
is referred to as the blank value. The first section covers the following points
and must be completed by the requester:
The extraction method described in Chap- • information about the test component
ter 3.2.4 is based on VDA 19 and details the • sampling conditions
use of pressure rinsing to separate particles • cleanliness requirements
from components and collect them on a filter • etc.
membrane for subsequent measurement and
analysis. The second section should be completed by
the specialist:
Particles that cannot be separated from the • details of particle count
components by extraction are classified as • type of filtration and filter
“tightly adhering” and are not considered in • presentation of results
the context of component cleanliness. • how packaging is dealt with
• etc.
3.2.2 Clarification form
The clarification form defines all the specific The use of a clarification form greatly sim-
test parameters required for an analysis. It is plifies the internal management of analy-
required not only for performing an analysis, ses which are intended to be compared with
e.g. in an analytical laboratory, but also for another. Furthermore, it also simplifies the
the internal review of different analyses and commissioning process by reducing follow-
for submission to the customer for approval up inquiries from the analytical laboratory
based on the test parameters from the regarding unclear or missing parameters.
requirements specification.
13Fig. 2: Examples of extraction systems
3.2.3 System technology Membrane holder
The following criteria must be considered Membrane filters must be easily removed
when designing a pressure rinsing system: from storage containers and loaded into the
equipment, if necessary using tweezers. To
Component holder ensure that no liquid remains between con-
Containers or funnels which discharge directly tainer and membrane filter, which would pre-
to the filter membrane. If necessary, a suit- vent the detection of particles, it is advisable
able sieve can be placed in the container to to extract the test liquid from the container
hold the component. If particles are simulta- holding the components (if necessary by vac-
neously extracted from several components, uum suction).
the components must not be placed on top of
each other but next to each other. It is impor- Number of components per test
tant to avoid generating new particles during The surface of the test components must be
the extraction process. sufficiently large to provide statistical data
on component cleanliness. It is advisable to
Pressure rinsing equipment select the number of components per test
An easily maneuverable pressure rinsing tool which ensures the smallest possible extrapo-
(lance) with a round nozzle of e.g. 4 mm lation factor based on a 1000 cm² reference
diameter is suitable for pressure rinsing com- surface area. However, no more than 50 com-
ponents manually at stable flow rates. ponents should be tested for practical reasons
(see Chapter 3.4.2).
143.2.4 Process parameters for pressure rinsing extraction
1. Extraction method: Pressure rinsing according to VDA 19
2. Test liquid : 1)
Solvent cleaners based on non-aromatic aliphatic
or alicyclic hydrocarbons with a terpene content of
< 30 percent, e.g.: Haku 1025-921, De-SOLV-IT 1000, G60
3. Flow volume: 1000 ml/min ± 200 ml/min
4. Nozzle: Lance with 4 mm round nozzle
5. Filter type (membrane): 5 µm pore size, approx. 47 mm membrane diameter
Material e.g. cellulose nitrate, PET mesh
6. Pressure rinse volume: Result of extraction curve (approx. value: 2 – 6 l)
7. Final rinse volume2): Approx. value ≥ 2000 ml
8. Number of components: 1 to 50 units or ideally ≥ 200 cm² surface area
3.2.5 Pressure rinsing process 3.2.6 Preparing membrane filters
Care must be taken to ensure that the spray for measurement analysis
reaches the target surface of all components On completion of the extraction process, the
during the pressure rinsing process. To achieve membrane filters must be dried at room tem-
this, the pressure rinsing device (lance) is perature or using a drying oven. To prevent
directed along the entire surface of all com- additional contamination or loss of particles
ponents at a distance of approx. 1 to 10 cm on membranes, the oven should be operated
until the rinse volume has been reached. The without air recirculation. A desiccator may
test components must be handled in a man- also be used for drying the membrane fil-
ner which ensures that no further particles ters at room temperature (approx. 12-24 h)
are generated during the extraction process to protect them from contamination. Petri
(e.g. due to abrasion). dishes can be used to facilitate the handling
of moist membrane filters.
Fig. 3: Component holder during
manual pressure rinsing This process must take place in a clean envi-
ronment which will not adversely effect the
results.
The components are then removed and the
empty component holder with container is
rinsed as part of the extraction process.
1)
The compatibility of solvent, components and assemblies should be verified at least once during testing.
2)
The final rinse volume is not determined by the decay test, but by the extraction chamber used.
15Fig. 4: Examples of different options Fig. 5: Slide frame with membrane
for drying membrane filters filter
Note:
The qualification test (extraction curve) and
blank value determination must be performed
in line with VDA 19 Part 1.
For the first decay test to determine the
extraction curve, 1 litre of pressure rinsing
liquid per extraction process may be used for
reference.
In the event that no decay takes place and
the decay criterion is not reached, the process
must be repeated with a higher volume of liq-
uid and new components.
Once dried, the components used for analy-
sis purposes may be re-fed to the production
process.
3.3 Measurement analysis
The dried membranes can be mounted in Light microscopy is normally used to evalu-
standard slide frames (60 x 60 mm) for the ate the particles on the membrane filters.
measurement analysis. The microscope and camera automatically
scan the membrane filters and determine
the shape and dimensions of the individual
particles. Software then classifies the par-
ticles according to the size classes defined in
VDA 19, differentiating between metallic and
non-metallic particles according to Chapter
3.1.1. Fibres (see 3.1.2) are not usually con-
sidered in the evaluation.
16Heavily contaminated membrane filters may The aim of the cleanliness analysis is not to
result in analytical errors due to overlapping find random errors arising from the large
particles. In this case, the number of test spread of cleanliness values, but to find sys-
components per analysis should be reduced tematic errors such as worn tools, errors in
to minimise the risk. Alternatively, cascade the cleaning process, incorrect storage condi-
filters can be used. tions and incorrect process parameters.
In addition to extremely contaminated mem- Particle numbers and dimensions are difficult,
brane filters, other parameters such as: if not impossible, to predict during the plan-
• filters (pore size, material, mesh structure) ning phase. They are influenced by numerous
• filter handling (positioning in measure- process and environmental parameters which
ment system, transport) are difficult to control. Measuring particles on
• microscopes existing components (samples if necessary) or
• image processing (software) using comparable components for reference
• analysis methods (cross-polarisation, EDX, (creating groups) is the most reliable method
Raman spectroscopy) of obtaining information on particulate con-
• illumination systems (incidental light, tamination for (future) series production.
light/dark field, transmission light)
may skew the results of the particle count. Of the different procedures available to mea-
sure particles, the two variants below are the
most common:
3.4 Evaluating the results of a) Determining particle count per
cleanliness analyses particle class
b) Determining maximum particle length
3.4.1 “Introduction” The appropriate variant is selected on the
Particles on components are not generated basis of the parameters, specifications or
deliberately using defined methods, but arise requirements.
as incidental waste products. For this reason,
the particle generation process is neither 3.4.2 Particle count relative to
stable nor actionable, and therefore particles component surface
have a wider spread compared with charac- The option mentioned in VDA 19 Part 1 is
teristics that have been specifically produced. most widely chosen in practice, in which the
Although component cleaning effectively number of particles detected is expressed rel-
reduces the number of particles, it does not ative to a 1000 cm2 component surface area.
significantly alter their spread. This is useful when comparing the contami-
nation level of different sized components.
VDA 19 Part 1 (Ch. 2.1) defines cleanliness If during the extraction process fewer com-
limits as action control limits rather than tol- ponents are rinsed than would be necessary
erance limits. When a limit is exceeded, it to achieve 1000 cm2, the number of particles
does not necessarily mean that an error has detected per class must be extrapolated to
occurred; it increases its likelihood of occur- 1000 cm2.
rence. An error occurs only when a critical
particle is found at the right time in the right
location on a sensitive position within the sys-
tem.
17When measuring technical cleanliness, it is A method is proposed below to reduce the
important to aim for the largest possible com- influence of the blank value on the mea-
ponent surface area (at least 200 cm2, ideally surement results during the extrapolation
1000 cm2. However, a tiny chip component, process. After the measurement, the (theo-
e.g. EIA0603, would have to be extrapolated retical) blank value is initially deducted, the
by a factor of 300 or more to avoid having to measurement result is extrapolated to 1000
use several thousand parts for a cleanliness cm2 and then the blank value is added to the
analysis. Clearly it would not make economic extrapolated result. In this case, the blank
sense to use such a large number of compo- value is estimated to be x percent of the total
nents. contamination.
This extrapolation process may result in a This procedure is expressed in the following
very high particle count for a specific par- extrapolation formula:
ticle class, when in reality only a single par-
ticle may have been found in this class on
N = n x (1000+B) / (A+B)
one occasion. In such cases it is not normally N = number of particles extrapolated to
possible to comply with the permitted blank 1000 cm2 component surface
value (10% rule as per the VDA 19 Part 1) n = number of particles on all
because small components carry too few par- components measured
ticles. The smaller the total surface area of A = surface area of components measured
the components being analysed, the greater in cm2
the disproportionate rise in the ratio of par- B = blank value equivalent in cm2
ticles originating from the analytical equip- corresponds to x % of 1000 cm2)
ment with no products.
Table 1: Influence of the blank value on the measurement results for different
material surfaces (examples for a blank value fraction of 2.2% and above)
Surface of components
measured in cm2 1000 500 200 29 10 1
Blank value equivalent in
cm2 (corresponds to 2.2% 22 22 22 22 22 22
of 1000 cm2)
Blank value fraction in % 2.2% 4.2% 10% 43.1% 68.8% 95.7%
Pie chart showing blank
value fraction (light blue)
Example (see blue column in the table):
One Class H metallic particle (200 – 400µm) was found during a cleanliness inspection of 50 components with a total surface
area of 29 cm2.
A ‘normal’ extrapolation to 100 cm2 (multiply 1000/29) gives a value of 35 Class I particles on 1000 cm2.
Extrapolation using the abovementioned formula gives a value of 20 metallic particles on 1000 cm2.
183.4.3 Procedure for violation of • Review and optimise the manufacturing
action control limits process and perform further follow-up
Due to the large spread of particle occurrence, tests. It is useful at this point to perform
a single analysis has only limited meaningful materials tests on the particles found to
value. In order to distinguish between sys- help pinpoint their source
tematic and random discrepancies, several • Re-clean
cleanliness analyses must be performed. • Exceptional release in individual cases fol-
lowing an appropriate risk assessment
The following course of action is recom- • Increase the confidence interval by testing
mended: further components from the same produc-
If a particle count is exceeded in one class, a tion batch
further analysis must be performed. •…
If only part of a component surface was
analysed due its very large size, when the 3.5 Extended risk assessment
test is repeated at least three parts per analy-
sis must be tested to increase the reliability The cleanliness risk can be estimated
of the information obtained from the new more accurately by applying the following
analyses. approaches; the likelihood of occurrence of
particles above a certain size can be inferred
Fig. 6: Example procedure if from the data obtained from a single cleanli-
specifications are exceeded ness analysis.
Process review/
optimisation; if 1. Use one or several analyses to determine
necessary, imple-
raw data by particle measurements accord-
Level of technical cleanliness
mentation
Re-examination of measure, …
ing to VDA 19 Part 1 or the chapter in this
guideline entitled “Definition of a suitable
Specification limit
test procedure incl. parameters”. The greater
the number of analyses, the more accurate
the estimation. The data should contain the
No measures No measures,
cleanliness analysis true sizes of the relevant particles. The num-
has been passed
ber of relevant particles should be sufficient
1. Cleanliness analysis 2. Re-examination, if necessary to enable statistical evaluation.
If the cleanliness values obtained from these 2. Experience shows that particle size and
additional analyses lie within the agreed lim- count create a function similar to exponential
its, it is fair to assume that the discrepancy distribution. The data must be transformed
was a random event and the entire cleanliness into a natural distribution using a suitable
test is deemed to have been passed success- program to allow statistical evaluation.
fully.
3. It is also possible to obtain information
However, if one value from these additional on the likelihood of occurrence of particles
analyses again lies outside the agreed values, above a certain size even if these were not
it may be a systematic discrepancy. Different found in the analysis by taking into account
follow-up measures can then be taken: the test samples used for the analysis.
193.5.1 Example
A total of 428 particles (≥ 200 µm) has been Assuming an even particle distribution, i.e.
extracted from 1510 contacts and analysed in max. 1 particle per contact, one metallic par-
terms of size in this example. ticle ≥ 900 µm can be found on 114 out of 1
million contacts, which corresponds to a fail-
• When extrapolated, this corresponds to ure rate of 114 ppm.
283,443 particles (≥ 200 µm) on one mil-
lion contacts.
• Statistically, 404.25 ppm or 114 particles
of these are ≥ 900 µm.
Fig. 7: Particle size distribution
Histogram of Metallic Particle Length
Normal
Mean 300.3
StDev 117.2
N 428
Frequency
Metallic Particle Length
Process Capability of Metallic Particle Length
Johnson Transformation with SB Distributtion Type
1.700 + 0.663* Ln ( ( X - 198.919) / (952.036 - X) )
USL*
Process Data Transformed Data Overall Capability
LSL * Pp *
Target * PPL *
USL 900 PPU 1.12
Sample Mean 300.273 Ppk 1.12
Sample N 428 Cpm *
StDev (Overall) 117.213
Overall Performance
After Transformation
PPM < LSL *
LSL* * PPM > USL 2336.45
Target* * PPM Total 2336.45
USL* 3.42435
Sample Mean* 0.0124134
StDev (Overall)* 1.01853 Exp. Overall
Performance
PPM < LSL* *
PPM > USL* 404.25
PPM Total 404.25
203.6 Component cleanliness: Data management and visualisation
Fig. 9: Flow diagram for component cleanliness analysis
Test filter
Pressure rinsing extraction Gravimetric analysis
(as per clarification form) (Mass analysis)
•Pressure
rinsing
• Ultrasonic
techniques
• Internal rinsing
• Agitation
• Classification of • Light microscopy
particle • Scanning electron
types by size microscopy with
classes as elemental analysis
per VDA 19
Documentation Analysis method
(Analysis results) (Particle analysis)
All test and analysis parameters must be under which the laboratory is to perform the
defined before conducting component clean- analysis in question (regulation of analytical
liness analyses. The clarification form or a values/parameters).
company specification sets out the conditions
Clearly defined performance standards, i.e.
Fig. 10: Scope of analytical report the same framework conditions, are the
only way to ensure comparability with other
analyses (see Chapter 3.2.2).
The analytical laboratory must provide the
following information:
• analysis report in compliance with e.g. VDA
19 Part 1 incl. indication of blank value
• test specification incl. decay test
Optional:
• video showing the performance of the
decay measurement
• filter
21Explanation of SCI This need to provide evidence applies not
(Surface Cleanliness Index): only to environmental cleanliness, but also in
The Illig value can be used to compare the particular to the products: For example, does
environmental cleanliness of production an additional cleaning process achieve the
areas and assess measures that have been desired effect?
introduced: For example, does a new ventila-
tion system achieve the desired effect? This can be verified using the SCI (surface
cleanliness index), which is a variation of the
Illig value. It indicates the significant sum of
particles. Like the Illig value, the SCI is a sin-
gle numerical value which reflects the results
of analysis for the relevant particle type.
Fig. 11: Derivation of Illig value
(scaling factor; see VDA 19 Part 2)
Fig. 12: Derivation of SCI
22The SCI differs from the Illig value only in the The SCI is suitable for comparing measures
absence of scaling over time. such as cleaned / not cleaned. The maximum
particle lengths, which are normally defined
It is obtained by calculating the combined in the specifications, give an indication of the
surface area of all test components in an extent to which the outlier rules and escala-
analysis and then scaling up the number tion strategy should be characterised.
of particles per size class and type to 1000
cm². Like the Illig value, the SCI uses the It is advisable to use diagrams or a database
same weighting factors for each size class. as a visualisation tool to provide a quick over-
These are derived from the lower limit d view of the results of a measure.
of the size class divided by 50 and squared.
The number of particles in each size class per The informative value of a review of mea-
1000 cm² is multiplied by this weighting fac- sures is directly related to the number of
tor to obtain the SCI per size class. The SCIs representative analyses. If one analytical
for each class are then added up to give the value is worse after a measure (e.g. clean-
SCI for the complete analysis. ing) than before, this is most likely due to the
large standard deviation (see VDA 19 Part 1
Note that in graphic representations the SCI, Ch. 10.1).
like the Illig value, should always be shown in
relation to the largest particles so that a com-
prehensive statement can be made about the
effect of the measure. Individual “outliers” in
particular tend to get lost with a high SCI.
23Fig. 13: Evaluation of 7-pin HV strip connector
Fig. 14: Graph showing cleaning effect based on SCIs
SCI for metallic particles per 1000 cm²
Cleaning effect: 67%
Fig. 15: Comparison of the three largest particles
24Creating a database If these parameters from the analyses are
Analytical reports can be transferred to a stored digitally in a database, they can be
database manually or automatically. used for other purposes in the future.
Before a database can be set up, its scope Certain parameters from the analyses must
must be defined. Experience shows that the be present in the database, depending on the
spectrum of information increases over time; requirements for the database. Ideally, a soft-
however, if every value from an analysis were ware program capable of performing evalua-
to be transferred, the size of the database tions of technical cleanliness is required.
would increase very substantially.
Alternatively, an Excel database can be used.
Analyses are performed on the basis of indi- This can be compiled at low cost and with lit-
vidual cleanliness specifications. In most tle programming expertise
cases, analyses provide information specific
to the given application only. For this rea-
son, it is advisable to clarify (e.g. clarification
form) which parameters should generally be
stored.
Fig. 16: Structural levels of a database
25Fig. 17: Option A: Evaluation of the largest particles by length and width:
Fig. 18: Option B: Extension to include the degree of contamination: SCI
Fig. 19: Option C: Extension to include a separate data sheet “direct comparison of test series”
26Option D: Extension of the database “to include ‚comparison with customer standards‘”
Fig. 20: Example: LK3223 (Kostal Kontakt Systeme GmbH)
Factory standards on technical cleanliness are view can easily be obtained by selecting the
based on mathematical operations, so it is three “largest particles” / analysing them
possible to integrate these into the database. (per particle type) and calculating the cor-
Analyses can be automatically compared with responding SCI. This is all the more impor-
standard specifications: e.g. particle type/s tant when comparing the status quo with
that is/are part of the specification, number two different cleaning methods, for example.
of, the number of particles per size class, out- In this case, it is advisable to use at least five
lier rule, escalation strategy etc. analyses per test series.
Summary: Then at the “press of a button” measures or
The integration of an SCI enables statements cleanliness levels can be evaluated and com-
to be made about the degree of contamina- pared with customer standards as required.
tion on the products themselves and compari-
sons with other test series if necessary. It is
advisable to view this in the context of the
“largest particles’”.
When the particle type/s of interest has/
have been defined, a database is indispens-
able for providing retrospective/prospec-
tive statements. The greater the number of
representative analyses available, the more
accurate and informative the statements.
Each analysis yields a substantial volume of
data, but with the aid of a database an over-
274 State of the art:
Technical cleanliness in the electronics industry
4.1 Process flow (per cluster)
4.1.1 Electronics manufacturing
cluster
Table 2: Electronics manufacturing cluster process flow
Process flow
SMT double-sided
SMT double-sided
SMT double-sided
+THT (automatic)
SMT single-sided
SMT+THT single-
Process steps
+THT (manual)
sided
X X X X X Goods receipt
X X X X X PCB marking
X X X X X Paste application (stencil printing, dispensing, jetting)1)
(X) (X) (X) (X) (X) SPI
[X] [X] [X] [X] Dispensing (SMT glue)
X X X X X SMD assembly
X X X X X Soldering (reflow/vapour phase)1)
(X) (X) (X) (X) (X) Inspection (MOI/AOI/AXI)2)
[X] [X] [X] [X] [X] Rework
X THT assembly (automatic)
X X Paste application (stencil printing, dispensing, jetting)1)
(X) (X) SPI
[X] [X] [X] Dispensing (SMT glue)
X X X SMD assembly
[X] Curing glue
X X Soldering (reflow/vapour phase)1)
(X) (X) (X) Inspection (MOI/AOI/AXI)2)
[X] [X] Rework
X X THT assembly (manual)
X X X THT soldering (wave/selective/stamp soldering)
(X) (X) (X) Inspection (MOI/AOI)2)
[X] [X] [X] Rework
[X] [X] [X] [X] [X] Press-fit process
(X) (X) (X) (X) (X) ICT
Depaneling (hand break, circular cutter, punching, routing,
[X] [X] [X] [X] [X] laser cutting)1)
[X] [X] [X] [X] [X] Cleaning
[X] [X] [X] [X] [X] Coating (dip, spray, tumbling)
(X) (X) (X) (X) (X) Final inspection
[X] [X] [X] [X] [X] Final assembly
X X X X X Packaging
The table shows an example of five typical process flows in PCB assembly.
( ) requirement-specific measurement and test steps
[ ] product-specific process steps
1)
only one procedure possible in each process step
2)
several procedures possible in each process step
Process reduces particle count
Process is the main source of non-metallic particles
Process is the main source of metallic particles
284.1.2 Passive components cluster
(e.g. for inductors and aluminium electrolytic
capacitors)
Table 3: Inductors Table 4: Aluminium electrolytic capacitors
1 Provide material 1. Goods receipt
2 Attach contacts to core 2. Production preparation
Wind core Slit foil
Wind bobbin Cut paper
3
Wind air coil 3. Provide material
Selectively remove core coating 4. Tack and wind
4 Strip wire ends Connect lead wires to foil (tacking)
5 Tin wire ends Wind foil and paper into a cylinder and secure
with adhesive tape (winding)
6 Bend wire ends
5. Assembly
Mount coil in housing
Impregnate element with electrolyte
7 Mount air-core coil on core
Push end seal on lead wires
Mount bobbin on core Assemble capacitor element with end seal in case
and close
Connect (twisting) wire ends and contacts
8 Push printed sleeving over case and shrink-wrap
Clip wire ends into taps
6. Reform and measure
Connect wire ends and contacts
9 (solder, weld)
Repair damage to the oxide layer of the anode foil
10 Clean component caused by preceding processes (ageing)
Bond, pot or impregnate coil Determine (measure) electrical capacity of
capacitor
11 Embed component by injection or press-moulding
Printing (for capacitors without sleeving)
Coat component
12 Assemble and glue second core 7. Prepare capacitors according to specification
13 Cut wire ends to final length Taping
14 Final inspection Lead cutting
15 Marking Forming
16 Packaging Reverse polarity protection
SMD
8. Final inspection
Process reduces particle count 9. Packaging
Process is the main source of non-metallic particles
Process is the main source of metallic particles
Process is the main source of metallic particles
Process is the main source of non-metallic particles
294.1.3 Electromechanical
components cluster
Electromechanical engineering comprises connectors should be analysed for the
many technological areas. As representative electronics industry and in particular for
electromechanical components, electrical PCB assemblies in this context.
Tab. 5a, b: Stamped contact production/plastic production (housing) process flow
Component part process flow
Sequence Stamped contact production
1 Goods receipt
2 Supply raw material as coiled strips or wires to stamping press
Stamp contacts and wind as strips interleaved with paper
3 on reels or pallets
Electroplate blank contacts and wind interleaved with paper on reels or pallets.
4 This step can be omitted for contacts made of pre-plated material.
Package in different types of outer packaging
5 (e.g. wire mesh containers, boxes, PE bags)
6 Storage
Component part process flow
Sequence Plastic production (e.g. housing)
1 Goods receipt
2 Supply raw material as plastic granules to injection moulding machine
3 Inject molten plastic into mould tool and allow to cool
4 Eject/remove plastic housing from mould tool
Package as bulk goods or in layers in different types of outer packaging
5 (e.g. with PE bags, lined)
6 Storage
Table 6: Housing assembly process flow
Finished part process flow
Sequence Housing assembly
1 Supply contacts on reel and housings in outer packaging to assembly line
2 Feed aligned housings into system
3 Feed contacts on reel to cutting station for separation
4 Insert individual contact element in plastic housing with positioning finger
5 Bend contact elements (if necessary)
Package finished connectors in layers interleaved with paper into cardboard/
6 plastic boxes with trays and PE bags
7 Shipping
304.1.4 PCB cluster
Table 7: PCB cluster process flow
Process low
Sequence Rigid circuit board Flexible circuit board Sequence
1 Goods receipt Goods receipt 1
Inner layer production for multi-
2 layer boards
3 Drilling Drilling/punching 2
4 Through-hole plating [Trough-hole plating] 3
5 Photo imaging Photo imaging 4
6 Electroplating
7 Pickling Pickling 5
8 AOI Visual inspection 6
Solder mask Cover layer tacking/lamination 7
9
Bake process 8
Cleaning 9
10 Surface finish Surface finish 10
11 [V-scoring] Depaneling 11
12 Milling Punching/separating 12
13 Internal rinsing
14 E-test E-test 13
Stiffener tacking/laminating 14
Bake process 15
15 Final inspection Final inspection 16
[Cleaning] 17
Packaging/shipping Packaging/shipping
16 18
(parts trays) (blister, parts trays)
[ ] product-specific process step
Process reduces particle count
Process is the main source of metallic and non-metallic particles
4.2 Technical cleanliness in special cleaning processes (unless otherwise
the electronics industry – stated). Most values are determined from sev-
actual situation eral cleanliness analyses – in some cases 20
or more.
Different electronic and electromechanical
components, circuit boards and assemblies The values have to be assessed as empiri-
have been grouped in families based on simi- cal values (best practice for the companies
lar designs and comparable manufacturing involved).
processes. To illustrate the particle count per
size class, several analyses have been con- In the tables below, the particle count is indi-
ducted for each component type. cated in relation to a surface area of 1000
cm². The metallic particle count and the sum
The values in the tables indicate the level of all particles (without fibres) are indicated.
of cleanliness that can be achieved without
31You can also read