TENNESSEE'S ECONOMY 2019-2020 Reference Guide - Workforce Insights, Research, and Reporting Engine Division - TN.gov
←
→
Page content transcription
If your browser does not render page correctly, please read the page content below

2019-2020 Reference Guide
TENNESSEE’S ECONOMY

Workforce Insights, Research,
and Reporting Engine Division

Workforce Insights, Research, and
Reporting Engine Division

Labor Market Information
220 French Landing Drive, 4B
Nashville, TN 37243

Phone: (615) 741-2284
Fax: (615) 532-9434
Email: wired.info@tn.gov

This workforce product was funded by a grant awarded by the U.S. Department of Labor’s Employment and Train-
ing Administration. The product was created by the recipient and does not necessarily reflect the official position
of the U.S. Department of Labor. The U.S. Department of Labor makes no guarantees, warranties, or assurances of
any kind, express or implied, with respect to such information, including any information on linked sites and includ-
ing, but not limited to, accuracy of the information or its completeness, timeliness, usefulness, adequacy, continued
availability, or ownership. This product is copyrighted by the institution that created it. Internal use by an organi-
zation and/or personal use by an individual for non-commercial purposes is permissible. All other uses require the
prior authorization of the copyright owner.

Table of Contents
                                                                     Tennessee’s Economy 2019-20

Executive Summary ..................................................................................................................................................................... 1
Tennessee’s Economy 2019 (graphic) ....................................................................................................................................... 3
Short Term Trends in the Tennessee Economy ....................................................................................................................... 4
Tennessee Employment 2019 .................................................................................................................................................. 13
Tennessee Labor Force and Demographics ........................................................................................................................... 16
Tennessee Wages 2019 ............................................................................................................................................................ 17
Tennessee Occupational Injuries, Illnesses, and Fatalities 2018 .......................................................................................... 19
Tennessee Long Term Job Outlook to 2028 ............................................................................................................................ 23
Detailed Regional Analysis - West Region ............................................................................................................................... 29
Detailed Regional Analysis - Middle Region ............................................................................................................................ 42
Detailed Regional Analysis - East Region ................................................................................................................................. 55
Workforce Strategies ................................................................................................................................................................ 68
  Workforce Strategies ............................................................................................................................................................ 68
  Apprenticeship ...................................................................................................................................................................... 71
  Licensed Occupations .......................................................................................................................................................... 76
Conclusion ................................................................................................................................................................................. 77

    Table 1: TN Industries Losing the Most Employment May 2019-May 2020 .......................................................................................... 4
    Table 2: Highest Number of Claims Filed by Occupation, Week Including June 27, 2020 (Estimated 2020 Employment > 100) ... 5
    Table 3: Highest Percent of Claims Filed to 2020 Employment (Estimated 2020 Employment > 100) .............................................. 8
    Table 4: Detailed Industries with Increased Employment Over the Month and Year, May 2020 .................................................... 11
    Table 5: Tennessee Industry Employment, 2014-2019 ......................................................................................................................... 14
    Table 6: U.S. & TN Annual Not Seasonally Adjusted Unemployment Rates, 2010-2019 ................................................................... 16
    Table 7: NonfatalOccupational Injuries and Illnesses, Tennessee 2018 ............................................................................................ 20
    Table 8: Fatal Work Related Injuries by Event or Exposure, Tennessee, 2015-2018 ......................................................................... 22
    Table 9: Occupational Projections (long-term) by Major Occupational Group in Tennessee in 2018-2028 ................................... 25
    Table 10: West Region Labor Force Data ................................................................................................................................................ 31
    Table 11: West Region Educational Attainment by Race, 2018 ............................................................................................................ 31
    Table 12: West Region Disability Status of Those in the Labor Force, 2018 ....................................................................................... 32
    Table 13: West Region Disability States of Those Not in the Labor Force, 2018 ................................................................................ 32
    Table 14: West Region Youth Unemployment, Ages 16-24 in 2018 ..................................................................................................... 33
    Table 15: West Region Average Unemployment Rates, 2018 to 2019 ................................................................................................. 33
    Table 16: West Region - Significant Barriers to Employment .............................................................................................................. 35
    Table 17: West Region Distressed Counties ........................................................................................................................................... 37
    Table 18: Occupational Employment and Wage Rates (OES) for All Major Groups in the West Region in 2019 ........................... 38
    Table 19: West Region LWDA Rapidly Growing Occupations ............................................................................................................... 40
    Table 20: Middle Region Labor Force ...................................................................................................................................................... 44
    Table 21: Middle Region Educational Attainment by Race, 2018 ......................................................................................................... 44
    Table 22: Middle Region Disability Status of Those in the Labor Force, 2018 .................................................................................... 45
    Table 23: Middle Region Disability Status of Those Not in the Labor Force, 2018 ............................................................................ 45
    Table 24: Middle Region Youth Unemployment, Ages 16-24 in 2018 .................................................................................................. 45
    Table 25: Middle Region Annual Average Unemployment Rates, 2018 to 2019 ................................................................................ 46
    Table 26: Middle Region - Significant Barriers to Employment ............................................................................................................ 48
    Table 27: Middle Region Distressed Counties ........................................................................................................................................ 50
Table 28: Occupational Employment and Wage Rates (OES) for All Major Groups in the Middle Region In 2019 .......................... 51
Table 29: Middle Region LWDA Rapidly Growing Occupations ............................................................................................................ 53
Table 30: East Region Labor Force Data .................................................................................................................................................. 57
Table 31: East Region Educational Attainment by Race, 2018 .............................................................................................................. 57
Table 32: East Region Disability Status of Those in the Labor Force, 2018 ......................................................................................... 58
Table 33: East Region Disability Status of Those Not in the Labor Force, 2018 ................................................................................. 58
Table 34: East Region Youth Unemployment, Ages 16-24 in 2018 ...................................................................................................... 58
Table 35: East Region Annual Average Unemployment Rates, 2018 to 2019 ..................................................................................... 59
Table 36: East Region - Significant Barriers to Employment ................................................................................................................. 61
Table 37: East Region Distressed Counties ............................................................................................................................................. 63
Table 38: Occupational Employment and Wage Rates (OES) for All Major Groups in the East Region in 2019 ............................. 64
Table 39: East Region LWDA Rapidly Growing Occupations ................................................................................................................. 66
Table 40: Registered Apprenticeship Sponsors with Completers 2019 East Region ......................................................................... 72
Table 41: Registered Apprenticeship Sponsors with Completers 2019 Middle Region ...................................................................... 73
Table 42: Registered Apprenticeship Sponsors with Completers 2019 West Region ........................................................................ 74
Table 43: Apprentice Completers 2019 by Job Title and Workforce Develompent Area .................................................................. 75

Figure 1: East Region Top Number of Claims by LWDA and Occupation .............................................................................................. 6
Figure 2: Middle Region Top Number of Claims by LWDA and Occupation ......................................................................................... 6
Figure 3: West Region Top Number of Claims by LWDA and Occupation ............................................................................................ 7
Figure 4: TN Demand Occupations by Total Claims 2020 ....................................................................................................................... 9
Figure 5: TN Demand Occupations by Claims Filed as Percent of 2020 Employment ...................................................................... 10
Figure 6: 2019 Private Sector Employment ............................................................................................................................................. 13
Figure 7: Tennessee Job Growth 2018-2019 ........................................................................................................................................... 15
Figure 8: Unemployment Rates - Tennessee Seasonally Adjusted - 2018 to 2020 ............................................................................ 16
Figure 9: Unemployment Rates - US & Tennessee Seasonally Adjusted - January 2013 to June 2020 ............................................ 16
Figure 10: 2019 Median Hourly Wages, State and Sub-State Area ...................................................................................................... 17
Figure 11: Median Hourly Wages, Major Occupational Groups ........................................................................................................... 18
Figure 12: Incidence Rates of Nonfatal Occupational Injuries and Illnesses, 2016-2018 .................................................................. 21
Figure 13: Major Industry Sector Employment, 2018-2018 .................................................................................................................. 23
Figure 14: Tennessee Major Industry Sector Employment, Annual Percent Change 2018-2028 ..................................................... 24
Figure 15: TN Occupational Groups by Annual Total Openings, 2018-2028 ...................................................................................... 28
Figure 16: West TN Unemployment Rates by MSA, 2018 and 2019 .................................................................................................... 34
Figure 17: West TN MSA Job Growth, 2018 and 2019 ............................................................................................................................ 36
Figure 18: Middle TN Unemployment Rates by MSA, 2018 and 2019 ................................................................................................. 47
Figure 19: Middle TN MSA Job Growth 2018-2019 ................................................................................................................................. 49
Figure 20: East TN Unemployment Rates by MSA, 2018 and 2019 ...................................................................................................... 60
Figure 21: East TN MSA Job Growth 2018 and 2019 .............................................................................................................................. 62
Figure 22: Number of Licenses by Occupation, 2018 and 2020 ............................................................................................................ 76

Executive Summary

Tennessee’s economy experienced an historic increase in unemployment from 109,312 in March 2020 to 482,906
and an unemployment rate of 15 percent in April as the response to the coronavirus pandemic caused business clo-
sures throughout the state. By June 2020, the unemployment rate had dropped to 10.1 percent; however, 324,508
individuals were still unemployed. Due to the unprecedented challenges to the workforce system this is creating,
this year’s Tennessee’s Economy report contains real-time data on the effects of the pandemic through June 2020,
as well as analyzing economic trends through 2019.

The Tennessee Economy in 2019 Nonfarm employment in Tennessee increased by nearly two percent from 2018
to 2019 to 3,063,300, creating 58, 800 jobs over the year (see Summary, p. 3). Metropolitan growth was strongest
in the Nashville MSA, which grew by 3.3 percent, twice as fast as Tennessee’s other metropolitan areas. Employ-
ment increased in 61 of 95 counties, as the number of establishments grew by 3.2 percent and nominal total payroll
increased by 4.4 percent to 156.8 billion dollars. The average annual median wage (not adjusted for inflation) also
increased by nearly three percent to $35,909, 0.9 percent of the U.S. average of $39,810, and average hourly wages
for production workers increased to $19.76.

The unemployment rate for 2019 was 3.4 percent, lower than the U.S. rate of 3.7 percent, and the labor force had
increased by nearly three percent. The state job bank, jobs4t.gov, listed an average of one job for each unemployed
person. Although unemployment rate for veterans was below the state average, rates for youth, those with disabil-
ities, and in poverty were still in the double digits. Due primarily to demographic changes, as the workforce ages,
the projected growth rate for all occupations through 2028 was 0.7 percent annually compared to previous projec-
tions of 1.2 percent through 2026.

Short Term Trends Tennessee’s economy experienced significant changes in employment and unemployment
during the period March 2020 to June 2020 due to the coronavirus pandemic and subsequent contraction.

From May 2019 to May 2020, more than 250,000 jobs were lost, although May employment rebounded by nearly
97,000 jobs from April 2020. Over the year, nearly four times as many jobs were lost in service-providing industries
(208,800) as in the goods producing sector (48,400). Nearly all jobs lost in the goods producing sector were in trans-
portation equipment manufacturing and its related industries plastics and rubber manufacturing.

The largest losses in the service-providing sector were in leisure and hospitality, comprising nearly one out of every
two jobs lost. Other large job losses occurred in administrative support and waste management services, education
and health services, retail trade, and local government, in both the education and general government sectors. Both
school closings and budget shortfalls affected local government employment.

Other industries increased in employment over the year from May 2019 to May 2020 in both the goods produc-
ing and services-providing industries. These essential industries, needed for survival while individuals sheltered at
home or began working from home and students were no longer in school, included food and beverage stores and
other stores which sell food.

Transportation and warehousing increased as more goods were ordered from home rather than purchased in
stores, intensifying e-commerce and its supporting industries. Computer manufacturing employment growth was
supported by the need for technology for increased online presence in education, work, and leisure environments.
Construction of buildings continued its growth as projects in the pipeline were being completed, buoying some du-
rable goods manufacturing industries.

                                                                                                                         1
According to current research, several trends are likely. If work at home at increases, with the potential for new jobs
closer to where people live, there may be more job growth outside of metropolitan areas. This could cause negative
effects on business support services such as restaurants, hotels, cleaning, and maintenance services, hurting low-
er-wage workers. Lower-wage workers could also lose employment if more routine, lower-skilled jobs are displaced
with the faster adoption of technology. But lack of funds for investment could slow this trend.

A third potential trend could be re-shoring of manufacturing. Manufacturing Industries identified as more likely to
re-shore include several which are prominent in Tennessee, including transportation equipment manufacturing and
related industries, chemicals, and medical equipment and supplies.

Statewide Employment Tennessee’s average annual nonfarm employment increased 1.9 percent from 2018 to
2019, adding 58,800 jobs. Goods producing jobs grew at a rate of 2.1 percent compared to 2.2 percent for private
service-providing jobs. Jobs in the government sector grew by 0.3 percent. In the goods producing sector, mining,
logging, and construction grew by 5,400 jobs while manufacturing increased by 4,600 jobs.

Labor Force and Demographics The annual average unemployment rate for the U.S. in 2010 was 9.6 percent and
dropped to 3.7 percent in 2019, a decrease of 5.9 percent. Tennessee’s annual average in 2010 was 9.7 percent and
declined to 3.4 percent in 2019, a decrease of 6.3 percent, which was more significant than the United States. Ten-
nessee’s June 2020 seasonally adjusted unemployment rate was 9.6 percent, a decrease from the revised May 2020
rate of 11.0 percent.

Tennessee Wages and Income 2019 Among the 22 major occupational groups, median wages increased for 19 of
the groups. The highest percentage changes were for personal care and service occupations (7.38 percent), office
and administrative support occupations (6.11 percent), and for sales and related occupations (3.65 percent).

Tennessee Safety 2018 The total recordable incidence rate for all industries in Tennessee per 100 full-time equiv-
alent workers during 2018 was estimated to be 3.0. The total recordable rate for private industry was 2.8 and the
total recordable rate for public sector industries was 4.0.

Tennessee Long Term Outlook to 2028 From a base of 3.3 million jobs in 2018, total employment for Tennessee,
including agricultural, self-employed, and private household workers, is expected to grow to 3.5 million by 2028.
With employment expected to increase by 0.7 percent annually, continued expansion in nine of twelve major indus-
try sectors is projected.

Detailed Regional Analysis Summaries of key labor force and economic trends for the West, Middle, and East
Regions are included in this section. Key labor force data presented for each region includes population, labor
force participation rates, educational attainment by race/ethnicity, the labor force status of youth and those with
disabilities, poverty and unemployment rates, and numbers of those with significant barriers to employment. Also
displayed are regional employment growth from 2018 to 2019, the distribution of occupational employment, and
industries and occupations expected to increase employment based on long term projections through 2026.

Workforce Strategies Six areas of skill development- social engagement, earnings and income, avoiding crime and
delinquency, physical and mental health, reflective decision making, and educational attainment- and workforce
strategies which encompass these across the regions are listed. Included are data on apprenticeship completers in
2019 and licensed occupations.

                                                                                                                          2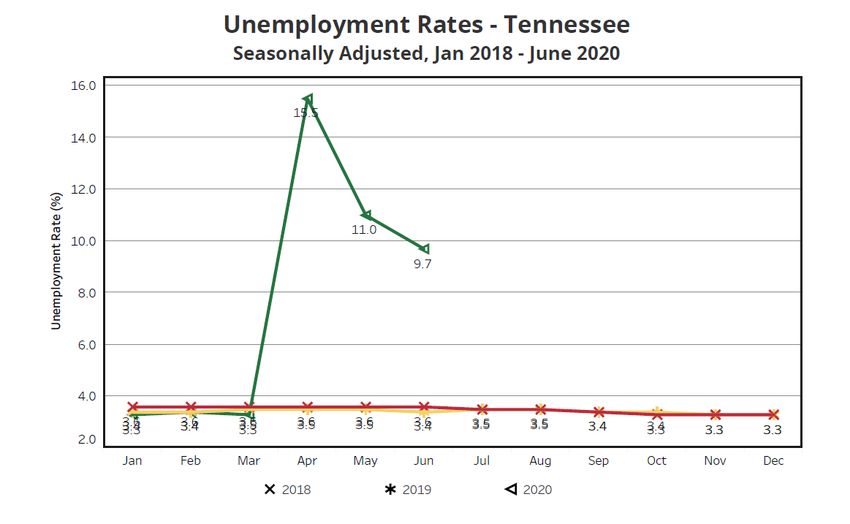
Tennessee’s Economy | 2019
                  Total Nonfarm               New Jobs              MSA Employment
                   Employment                                          2018-2019
                   2019: 3,122,100           2019: 58,800            Nashville - 3.27%
                                                                      Jackson - 1.02%
                        1.9%
                                             2018: 50,900           Chattanooga - 1.64%
                   2018: 3,063,300
Employment           Stronger                 Stronger
                                                                     Knoxville - 1.38%
                                                                         Stronger

                Average Number of           Total Payroll             Counties That
                  Establishments                                        Increased
                    2019: 166,863        2019: $156.8 Billion         Employment
                        3.2%                    4.39%                     2019: 61
                    2018: 161,696        2018: $150.2 Billion
 Employers           Stronger                 Stronger
                                                                          2018: 64
                                                                        Challenge

                  Average Annual         State Median Wage         Average Hourly
                      Wage                                        Wages - Production
                   2019: $51,687            2019: $35,909             Workers
                       2.5%                     2.9%                2019: $19.76
  Wages &          2018: $50,450            2018: $34,890           2018: $19.51
  Income            Stronger                 Stronger                    Stronger

                Unemployment Rate            Labor Force            Unemployment
                                                                       Rates
                    2019: 3.4%                                       Veterans, 2019: 2.6%
                                           2019: 3,344,849            Youth 2018: 12.8%
                      -0.1%                     2.8%              With Disablity, 2018: 11.3%
Labor Force &       2018: 3.5%             2018: 3,254,261        % In Poverty, 2018: 16.1%

Demographics        Stronger                 Stronger                   Stronger

                Ratio of Unemployed        Projected Annual           Projected Job
                  to Job Openings          Growth Rate, All             Openings
                    June 2019: 0.72          Occupations
                       -0.06%              2018-2028: 0.70%       2018-2028: 4,148,740
                    June 2018: 0.78        2016-2026: 1.18%
 Job Outlook         Stronger                Challenge                  Stronger

                   Total Nonfatal           Total Nonfatal        Fatal Occupational
                Occupational Illnesses   Occupational Illnesses         Injuries
                   and Injuries, All      and Injuries, Public
                                                Sector                   2018: 122
    Safety       2018: 3.0 per 100 FTE
                 2017: 3.0 per 100 FTE
                                          2018: 4.0 per 100 FTE
                                          2017: 3.7 per 100 FTE
                                                                         2017: 128
  on the Job          Strong                 Challenge                  Stronger
                                                                                                3
Short Term Trends in the Tennessee Economy: March 2020 to June 2020
Tennessee’s economy has experienced significant changes in employment and unemployment during the period
March 2020 to June 2020. The National Bureau of Economic Research (NBER) declared the United States began a
recession in February 2020 due to the coronavirus pandemic and the subsequent economic contraction. Tennes-
see’s unemployment rate increased from 3.2 percent in March, 2020 with 109,312 people unemployed to 15 percent
in April with 482,906 unemployed. By June the unemployment rate had dropped to 10.1 percent; however 324,508
individuals were still unemployed.
The Tennessee industries losing the most employment from May 2019 to May 2020 are shown in Table 1 below.
From May 2019 to May 2020, more than 250,000 jobs were lost in Tennessee, although May employment rebound-
ed by nearly 97,000 jobs from April 2020. Over the year, nearly four times as many jobs were lost in service-provid-
ing industries (208,800) than in the goods producing sector (48,400). Nearly all jobs lost in the goods producing sec-
tor were in transportation equipment manufacturing and its related industries plastics and rubber manufacturing.
The largest losses in the service-providing sector were in leisure and hospitality, comprising nearly one out of every
two jobs lost. As measures to fight the spread of the pandemic were put in place, hotels and other accommodations
lost more than 19,000 jobs and food services and drinking places 67,300, although a significant recovery of those
food service jobs occurred from April to May. Other large job losses occurred in administrative support and waste
management services (32,800), education and health services (both in ambulatory care settings and hospitals), retail
trade (12,000), and local government, in both the education and general government sectors. Both school closings
and budget shortfalls affected local government employment.
Table 1: TN Industries Losing the Most Employment May 2019-May 2020
May 2020 - May 2020
Industry Title May 2020 April 2020 May 2019 April 2020 - May 2019
Emply. Chg. Emply. Chg.
Total Nonfarm 2,855,400 2,758,700 3,112,600 96,700 -257,200
Goods Producing 439,500 417,000 487,900 22,500 -48,400
Manufacturing 309,400 288,500 356,500 20,900 -47,100
Transportation Equipment Manufacturing 40,800 31,400 75,300 9,400 -34,500
Plastics and Rubber Products Manufacturing 19,400 18,200 25,100 1,200 -5,700
Service-Providing 2,415,900 2,341,700 2,624,700 74,200 -208,800
Wholesale Trade 115,100 116,100 120,600 -1,000 -5,500
Retail Trade 321,600 312,200 339,700 9,400 -18,100
Motor Vehicle and Parts Dealers 43,900 45,000 47,300 -1,100 -3,400
Clothing and Clothing Accessories Store 10,600 9,700 22,600 900 -12,000
Professional and Business Services 384,900 381,800 417,600 3,100 -32,700
Administrative and Support and Waste Management 192,000 188,300 224,800 3,700 -32,800
Educational and Health Services 417,300 411,300 435,100 6,000 -17,800
Ambulatory Health Care Services 145,300 137,700 152,300 7,600 -7,000
Hospitals 106,600 106,700 110,700 -100 -4,100
Leisure and Hospitality 256,500 197,100 359,400 59,400 -102,900
Accommodation 21,700 22,700 40,800 -1,000 -19,100
Food Services and Drinking Places 207,700 154,000 275,000 53,700 -67,300
Government 423,700 435,000 444,800 11,300 -21,100
Local Government Educational Services 138,800 143,300 148,800 -4,500 -10,000
Local Government, Excluding Education 142,900 142,900 148,200 0 -5,300
Source: TN Dept of Labor and Workforce Development, WIR2ED Division, Current Employment Statistics May 2020
Seasonally Adjusted Data, Current Employment Statistics May 2020 Seasonally Adjusted Data, Preliminary.
4Unemployment Claims by Occupation: Data on unemployment claims for the week ending June 27, 2020 showed
the jobs of those most affected by the pandemic. Table 2 below lists the 20 occupations for which individuals filed
the most claims. Closing of food services and drinking places caused large numbers of claims for waiters and wait-
resses, cooks, bartenders, and food preparation and serving workers, with waiters and waitresses filing the most
claims of any occupation. Claims in accommodation were filed by maids and housekeeping cleaners and janitors.
Retail salespersons, cashiers, and stock clerks were laid off in retail trade. Production workers and inspectors lost
jobs in manufacturing. As schools closed and parents were home with children, child care workers lost jobs. Seven
out of 10 jobs required only short term (less than 30 days training). With the highest number of claims being filed
by those holding low-skilled jobs, placement in other job opportunities would not happen quickly.
Table 2: Highest Number of Claims Filed by Occupation, Week Including June 27, 2020
(Estimated 2020 Employment > 100)
SOC 2020 Level Training Total
Occupation Title
Code Employment Education Needed Claims
35-3031 Waiters and Waitresses 56,630 None ST OJT 13,659
41-2031 Retail Salespersons 88,580 None ST OJT 8,617
Laborers and Freight, Stock, and
53-7062 Material Movers, Hand 99,080 None ST OJT 8,331
41-2011 Cashiers 76,660 None ST OJT 8,293
43-4051 Customer Service Representatives 65,420 HS ST OJT 6,056
51-9199 Production Workers, All Other 14,080 HS MT OJT 5,351
35-2014 Cooks, Restaurant 24,340 None MT OJT 5,256
37-2012 Maids and Housekeeping Cleaners 26,820 None ST OJT 5,069
53-3031 Driver/Sales Workers 8,810 HS ST OJT 4,931
35-3011 Bartenders 7,7740 None ST OJT 4,679
Janitors and Cleaners, Except
37-2011 Maids and Housekeeping Cleaners 45,400 None ST OJT 3,720
39-9011 Childcare Workers 19,780 HS ST OJT 3,714
Hairdressers, Hairstylists, and
39-5012 Cosmetologists 12,900 PS None 3,607
43-5081 Stock Clerks and Order Fillers 58,420 HS ST OJT 3,483
Combined Food Preparation and
Serving Workers, Including Fast
35-3021 Food 76,710 None ST OJT 3,320
53-7064 Packers and Packagers, Hand 18,520 None ST OJT 3,301
11-9199 Managers, All Other 34,670 BA None 3,233
Heavy and Tractor-Trailer Truck
53-3032 Drivers 72,800 PS ST OJT 2,929
25-9041 Teacher Assistants 24,240 SC None 2,806
Inspectors, Testers, Sorters,
51-9061 Samplers, and Weighers 14,650 HS MT OJT 2,659
Legend Entry Level Education:
None=No formal education; HS=High School; PS=Postsecondary non-degree award; SC=Some college; BA=
Bachelor’s degree
Job Training Needed: None=None; ST OJT=Short-term on-the-job; MT OJT=Moderate term on-the-job
Total Claims=Total initial and continued claims on June 27, 2020
Source: TN Dept of Labor and Workforce Development, WIRED Division,
PROMIS Data, 6-27-2020 and TN Short Term Projections, 2019-2021
5East Region Top Number of Claims by LWDA and Occupation
Cooks, Restaurant 260 867 462
Bartenders 679 369
Combined Food Preparation and Serving Workers, Including Fast
232 323
Food
Waiters and Waitresses 780 2801 1218
Maids and Housekeeping Cleaners 244 1114 376
Hairdressers, Hairstylists, and Cosmetologists 205
Cashiers 401 1326 689
Northeast LWDA
Retail Salespersons 505 1820 710 East LWDA
Southeast LWDA
Customer Service Representatives 351 877 521
Production Workers, All Other 290 629 613
Driver/Sales Workers 571
Laborers and Freight, Stock, and Material Movers, Hand 219 697 589
0 1000 2000 3000 4000 5000 6000
Number of Claims
Includes the top ten occupations by number of initial and continued claims by LWDA.
Source: TN Dept of Labor and Workforce Development WIR2ED Division PROMIS data, week ending June 27, 2020
Figure 1
Middle Region Top Number of Claims by LWDA and Occupation
Engineering Technicians, Except Drafters,
Musicians and AllSingers
Other 400
Musicians
Cooks, and Singers
Restaurant 1,805
Cooks, Bartenders
Restaurant 1,930
Waiters and Bartenders
Waitresses 2,524
Waiters and Waitresses
Maids and Housekeeping Cleaners 361 550 5,374
Maids and Housekeeping Cleaners
Cashiers 0
199 1,701
Cashiers
Retail Salespersons 266 402 2,358
Retail
Customer Service Salespersons 230 361
Representatives 2,903
Customer ServiceTeam
Representatives
Assemblers 151 326 2,306
Upper Cumberland LWDA
Team Assemblers
Assemblers and Fabricators, All Other 209 422 Southern Middle LWDA
Assemblers
Inspectors, Testers, and
Sorters, Fabricators,
Samplers, All Other 174
and Weighers 440 Northern Middle LWDA
Inspectors, Testers, Sorters, Samplers,
Production and Weighers
Workers, All Other 364
Production Workers, All
Driver/Sales Other 346
Workers 879
Driver/Sales
Heavy and Tractor-Trailer TruckWorkers
Drivers 2,467
HeavyStock,
Laborers and Freight, and Tractor-Trailer Truck Drivers
and Material Movers, Hand 219
Laborers and Freight, Stock, and Material Movers, Hand 273 413 2,531
0 1,000 2,000 3,000 4,000 5,000 6,000 7,000
Number of Claims
Includes the top ten occupations by number of initial and continued claims by LWDA.
Source: TN Dept of Labor and Workforce Development WIR2ED Division PROMIS data, week ending June 27, 2020
Figure 2
6West Region Top Number of Claims by LWDA and Occupation
Cooks, Restaurant 129 1,186
Combined Food Preparation and Serving Workers, Including… 112
Waiters and Waitresses 284 270 2,021
Janitors and Cleaners, Except Maids and Housekeeping…165 121 1,131
Maids and Housekeeping Cleaners 134
Hairdressers, Hairstylists, and Cosmetologists 115
Cashiers 305 246 2,300
Retail Salespersons 260 188 1,640
Customer Service Representatives 1,306
Assemblers and Fabricators, All Others 168 Southwest LWDA
Helpers--Production Workers 182 106 Northwest LWDA
Production Workers, All Other 368 237 Greater Memphis LWDA
Heavy and Tractor-Trailer Truck Drivers 142
Industrial Truck and Tractor Operators 1,116
Laborers and Freight, Stock, and Material Movers, Hand 190 135 3,284
Packers and Packagers, Hand 1,925
Stock Clerks and Order Fillers 1,267
0 500 1,000 1,500 2,000 2,500 3,000 3,500 4,000
Number of Claims
Includes the top ten occupations by number of initial and continued claims by LWDA.
Source: TN Dept of Labor and Workforce Development WIR2ED Division PROMIS data, week ending June 27, 2020
Figure 3
The Department of Labor and Workforce Development, WIR2ED Division, produced short-term industry and projec-
tions for 2019-2021 in February, 2020, before the pandemic had a major effect on Tennessee employment. From
these, expected occupational employment for 2020 was estimated (Table 3) and was compared to claims in the last
week of June, 2020. The 20 occupations with the highest number of claims compared to occupational employment
are listed in Table 3.
Virtually all manicurists and barbers filed claims; in fact, their numbers were underrepresented in the estimates.
All entertainers and performers and engineering technicians filed claims, as did high percentages of others in the
entertainment industry including sound engineering technicians and dancers. High percentages of chefs, bartend-
ers, and food preparation and serving workers also filed, as did certain manufacturing and transportation-related
workers including travel agents. When in-person court hearings closed, many court reporters were also out of work.
7Table 3: Highest Percent of Claims Filed to 2020 Employment
(Estimated 2020 Employment > 100)
Estimated
SOC Claims Filed as % of
Occupation Title 2020
Code 2020 Employment1
Employment
39-5092 Manicurists and Pedicurists 730 244.32%
39-5011 Barbers 510 187.45%
Entertainers and Performers, Sports and Related
27-2099 Workers, All Other 370 123.39%
17-3029 Engineering Technicians, Except Drafters, All Other 1,550 116.53%
27-4014 Sound Engineering Technicians 480 89.29%
Aircraft Structure, Surfaces, Rigging, and Systems
51-2011 Assemblers 230 83.44%
35-1011 Chefs and Head Cooks 2,250 82.50%
51-3093 Food Cooking Machine Operators and Tenders 330 63.86%
Door-to-Door Sales Workers, News and Street
41-9091 Vendors, and Related Workers 320 63.41%
47-2042 Floor Layers, Except Carpet, Wood, and Hard Tiles 220 61.74%
35-3011 Bartenders 7,740 60.42%
53-3031 Driver/Sales Workers 8,180 60.27%
53-6051 Transportation Inspectors 280 59.93%
Life, Physical, and Social Science Technicians, All
19-4099 Other 1,220 54.58%
41-3041 Travel Agents 930 48.09%
53-7121 Tank Car, Truck, and Ship Loaders 210 47.66%
41-9099 Sales and Related Workers, All Other 2,600 45.87%
23-2091 Court Reporters 240 45.70%
Food Preparation and Serving Related Workers, All
35-9099 Other 1,410 45.49%
1
Employment >100% indicates employment may have been underestimated.
Source: TN Dept of Labor and Workforce Development, WIRED Division,
PROMIS Data, 6-27-2020; and TN Short Term Projections, 2019-2021
Figures 4 and 5 compare occupations identified by the department as occupations in demand in the long term with
the number of initial and continued claims filed. The largest number of claims for those considered demand occu-
pations were filed by heavy and tractor-trailer truck drivers; however, those 2,929 claimants were only four percent
of the total workforce, numbering nearly 73,000 workers. Sales managers and general and operations managers, as
well as production supervisors and production planning clerks also had larger numbers of claims. Healthcare work-
ers who were claimants included registered nurses, licensed practical nurses, physical therapist assistants, health
services managers, medical records technicians, and office supervisors, although claimants made up a small propor-
tion of total employment. Elementary and secondary local government teachers also were among the claimants.
8TN Demand Occupations by Total Claims 2020
TN Demand Occupations by Total Claims 2020
Heavy and Tractor-Trailer Truck Drivers 2,929
Heavy and Tractor-Trailer Truck Drivers 2,929
Sales Managers 2,386
Sales Managers 2,386
General and Operations Managers 2,176
General and Operations Managers 2,176
First-Line Supervisors of Production and Operating Workers 1,445
First-Line Supervisors of Production and Operating Workers 1,445
Accountants and Auditors 1,366
Accountants and Auditors 1,366
Registered Nurses 1,065
Registered Nurses 1,065
Producers and Directors 771
Producers and Directors 771
Elementary School Teachers, Except Special Education 728
Elementary School Teachers, Except Special Education 728
Production, Planning, and Expediting Clerks 628
Production, Planning, and Expediting Clerks 628
Licensed Practical and Licensed Vocational Nurses 623
Licensed Practical and Licensed Vocational Nurses 623
Computer User Support Specialists 570
Computer User Support Specialists 570
Sales
Sales Representatives,
Representatives, Wholesale
Wholesale and
and Manufacturing, Technical and…
Manufacturing, Technical and… 486
486
Property,
Property, Real
Real Estate,
Estate, and
and Community
Community Association
Association Managers
Managers 477
477
Market Research Analysts and Marketing Specialists
Market Research Analysts and Marketing Specialists 472
472
Heating,
Heating, Air
Air Conditioning,
Conditioning, and
and Refrigeration
Refrigeration Mechanics
Mechanics and
and Installers
Installers 454
454
First-Line
First-Line Supervisors
Supervisors of
of Office
Office and
and Administrative
Administrative Support
Support Workers
Workers 443
443
Physical Therapist Assistants 435
Financial Managers 398
Medical Records and Health Information Technicians 398
Secondary School Teachers, Except Special and Career/Technical…
Secondary 298
0 500 1,000 1,500 2,000 2,500 3,000 3,500
Number of Claims
Total Claims=Total initial and continued claims on June 27, 2020
Source: TN Dept of Labor and Workforce Development, WIR2ED Division, PROMIS Data, 6-27-2020 and TN Short
Term Projections, 2019-2021, occupations with greater than 100 employment
Figure 4
As Figure 5 shows, the demand occupations with the highest percent of claimants compared to total employment
were sales managers, with nearly one of every three filing and receiving claims. The arts and entertainment occupa-
tion of producers and directors also had nearly one in three employees receiving claims. Demand occupations with
higher number of claims included the healthcare occupations of physical therapist assistant and medical records
technician.
Production occupations with higher numbers of claims compared to total employment included production super-
visors, computer-controlled machine tool operators, production planning clerks, machinery maintenance workers,
and electrical and electronic engineering technicians. However, except for physical therapist assistant at 12 percent,
the percent of claims among the healthcare and production workers was less than 10 percent.
9What are key points in this analysis?
• A high proportion of those filing claims are low-skilled workers, who will continue to need significant
claims assistance until leisure and hospitality and other related sectors are able to operate safely.
• Professional workers with higher numbers of claims include several sales, finance, and marketing jobs.
• Local governments have had to lay off workers in both education and general government sectors.
• Many demand occupations outside of the entertainment industry and certain manufacturing industries
should continue to have some opportunities for employment, although that may depend significantly on
the geographic area.
TN Demand Occupations by Claims Filed as Percent of 2020
TN Demand Occupations by Claims Filed as Percent of 2020 Employment
Employment
Sales Managers 31.65%
Producers and Directors 30.24%
Sales Assistants
Physical Therapist Managers 12.21% 31.65%
Medical Records and Health Producers
Informationand Directors
Technicians 8.68% 30.24%
Physical
First-Line Supervisors of Production andTherapist
OperatingAssistants
Workers 7.40% 12.21%
Medical Records and Health Information Technicians 8.68%
Computer-Controlled Machine Tool Operators, Metal and Plastic 6.80%
First-Line Supervisors of Production and Operating Workers 7.40%
Production, Planning, and Expediting Clerks 6.71%
Computer-Controlled Machine Tool Operators, Metal and Plastic 6.80%
Accountants and Auditors 5.83%
Production, Planning, and Expediting Clerks 6.71%
Property, Real Estate, and Community Association
Accountants andManagers
Auditors 5.71%
5.83%
Property, Real Estate, andComputer User
Community Support Specialists
Association Managers 5.48%
5.71%
Maintenance
Computer UserWorkers,
Support Machinery
Specialists 5.24%
5.48%
Maintenance
Electrical and Electronics Workers,Technicians
Engineering Machinery 5.24%
5.11%
Electrical and Electronics Engineering
CostTechnicians
Estimators 5.11%
4.83%
Cost Estimators
General and Operations Managers 4.83%
4.80%
General and Operations Managers 4.80%
Heating, Air Conditioning, and Refrigeration Mechanics and… 4.74%
Heating, Air Conditioning, and Refrigeration Mechanics and… 4.74%
Market Research Analysts and Marketing Specialists 4.67%
Market Research Analysts and Marketing Specialists 4.67%
Web Developers 4.65%
Web Developers 4.65%
Operations Research
Operations Research Analysts
Analysts 4.34%
4.34%
Security and
Security and Fire Alarm Systems
Fire Alarm Installers
Systems Installers 4.21%
4.21%
Computer Network Architects 4.09%
0.00% 5.00% 10.00% 15.00% 20.00% 25.00% 30.00% 35.00%
Claims Filed as Percent of 2020 Employment
Source: TN Dept of Labor and Workforce Development, WIRED Division,
PROMIS Data, 6-27-2020 and TN Short Term Projections, 2019-2021
Figure 5
10Essential Industries: The detailed industries listed below increased in employment over the year from May 2019
to May 2020, continuing to grow from April 2020 through May 2020 (see Table 4). Included are industries in both the
goods producing and services-providing industries. Essential industries, needed for survival while individuals shel-
tered at home or began working from home and students were no longer in school, included food and beverage
stores (including grocery stores) and other stores which sell food but are classified in other industries (including gas
stations and general merchandise stores).
Transportation and warehousing increased as more goods were ordered from home rather than purchased in
stores, intensifying e-commerce and its supporting industries. Computer manufacturing employment growth was
supported by the need for technology for increased online presence in education, work, and leisure environments.
Construction of buildings, which added 3,200 jobs over the year, continued its growth as projects in the pipeline
were being completed, buoying some durable goods manufacturing industries. Individuals at home also increased
purchases of building materials and garden supplies, as increased leisure time created a focus on home improve-
ment projects. Expanded federal government expenditures to support the economy stabilized its employment. Jobs
in these essential industries were posted on the jobs4tn.gov website as employment expanded.
Table 4: Detailed Industries with Increased Employment Over the Month and Year, May 2020
May 2020 - May 2020
May April May April 2020 - May 2019
Industry Title
2020 2020 2019 Employment Employment
Change Change
Total Nonfarm 2,855,400 2,758,700 3,112,600 96,700 -257,200
Goods Producing 439,500 417,000 487,900 22,500 -48,400
Construction of Buildings 28,500 27,300 25,300 1,200 3,200
Wood Product Manufacturing 12,800 12,200 12,400 600 400
Primary Metal Manufacturing 11,600 11,200 11,500 400 100
Machinery Manufacturing 26,000 24,500 25,900 1,500 100
Computer and Electronic Product
Manufacturing 5,700 5,500 5,400 200 300
Furniture and Related Product
Manufacturing 10,600 9,000 9,400 1,600 1,200
Chemical Manufacturing 25,800 25,700 25,700 100 100
Service-Providing 2,415,900 2,341,700 2,624,700 74,200 -208,800
Building Material and Garden
Equipment 33,200 31,600 32,300 1,600 900
Food and Beverage Stores 56,400 55,500 54,600 900 1,800
Gasoline Stations 24,600 23,900 23,200 700 1,400
General Merchandise Stores 74,800 71,500 72,400 3,300 2,400
Transportation and Warehousing 174,100 173,400 170,900 700 3,200
Federal Government 50,200 50,100 49,900 100 300
Source: TDLWD, WIR2ED Division, TN Current Employment Statistics, May 2020, Seasonally Unadjusted Data,
Current Employment Statistics May 2020 Seasonally Adjusted Data, Preliminary.
11What are some of the changes from COVID-19 that might affect the Tennessee economy in the longer run? An
important question is whether self-employment will increase. One of the primary ways of collecting information on
self-employment is the Current Population Survey which continuously surveys samples of households in the states.
This survey has not shown evidence of increasing self-employment as the gig economy has been emerging. How-
ever, administrative records such as 1099 returns from the IRS are have shown some growth in self-employment.1
Economists have suggested ways to change the questions on the CPS to better reflect different kinds of self-employ-
ment; until those questions are changed or researchers have better access to administrative data, the answer to
this question will not be available.
According to current research, several trends are likely.2 If work at home at increases, with the potential for new
jobs closer to where people live, there may be more job growth outside of metropolitan areas. This could cause neg-
ative effects on business support services such as restaurants, hotels, cleaning, and maintenance services, hurting
lower-wage workers.3 Lower-wage workers could also be displaced if more routine, lower-skilled jobs are displaced
with the faster adoption of technology. But lack of funds for investment could slow this trend.
A third potential trend could be re-shoring of manufacturing, with COVID-19 disrupting off-shore supply chains. This
has reinforced trends such as higher labor, transportation costs, and issues of product safety. Industries identified
as more likely to re-shore are the following, many of which are prominent in Tennessee:
• Automobile bodies and trailers;
• Other transportation equipment manufacturing;
• Navigational, measurement equipment and control instruments;
• Basic chemicals;
• Semi-conductor and electronics components manufacturing;
• Medical equipment and supplies;
• Communications equipment manufacturing; and
• Aerospace products and parts.
Better ways to communicate through technology and re-shoring of manufacturing could also mean less internation-
al business travel and cause the airlines to continue to have reduced employment.4
1
K. Abraham, J. Haltiwanger, K. Sandusky, J. Spletzer. Measuring the gig economy: current knowledge and open
issues. National Bureau of Economic Research, January 9, 2020. https://www.nber.org/chapters/c13887.
2
Dr. Susan N. Houseman, director of research at the Upjohn Institute for Employment Research, Projections
Managing Partnership Summit presentation August 20, 2020. “Measuring industry and occupations trends beyond
COVID-19”.
3
D. Autor and E. Reynolds. The nature of work after the COVID crisis; too few low-wage jobs. autorReynolds_LO_
Final.pdf. hamiltonproject.org. Downloaded September 10, 2020.
4
Federal Reserve Bank of Atlanta. Businesses anticipate slashing post pandemic travel budgets. August 4, 2020.
https://www.frbatlanta.org/blogs/macroblog/2020/08/04/businesses-anticipate-slashing-postpandemic-travel-
budgets Downloaded September 10, 2020.
12Employment
Tennessee Employment 2019
Tennessee’s average annual nonfarm employment increased 1.9 percent from 2018 to 2019, adding 58,800 jobs.
Goods producing jobs grew at a rate of 2.1 percent compared to 2.2 percent for private service-providing jobs.
Jobs in the government sector grew by 0.3 percent. In the goods producing sector, mining, logging, and construc-
tion grew by 5,400 jobs while manufacturing increased by 4,600 jobs .
Among the private service-providing industries, those with the largest job increases were trade, transportation,
and utilities services which added 12,200 jobs, and leisure and hospitality which added11,400 jobs. Within the
trade, transportation, and utilities services, transportation, warehousing, and utilities accounted for 10,900 of the
added jobs while accommodation and food servcies accounted for 8,500 of the11,400 jobs added in the leisure
and hospitality sector. State government and retail trade experienced a decline from 2018 to 2019 with a loss of
2,200 and 500 jobs respectively.
Since 2014, Tennessee has added 300,000 jobs, a 10.6 percent increase. Leisure and hospitality led the way adding
52,600 jobs. Of those jobs, 42,300 were added in accommodation and food services, and 10,200 were added in
arts, entertainment, and recreation. Other sectors gaining over 25,000 jobs included manufacturing; trade, trans-
portation and utilities; financial activities; professional and business services; and education and health services.
No industry experienced a decline of jobs from 2014 to 2019.
2019 Private Sector Employment
Mining, Logging, &
Other Services,
Construction, 5.0%
4.5%
Leisure &
Hospitality, 13.0% Manufacturing,
13.2%
Education & Health Trade,
Services, 16.5% Transportation, &
Utilities, 23.8%
Professional &
Business Services,
15.9%
Information, 1.7%
Financial Activities,
6.4%
Source: TN Department of Labor & Workforce Development, Current Employment Statistics
Figure 6 13Table 5: Tennessee Industry Employment, 2014-2019
18-19 14-19
Industry Employment (in thousands) 2014 2018 2019 18-19 % 14-19 %
Total Nonfarm 2,822.1 3,063.3 3,122.1 58.8 1.9% 300.0 10.6%
Goods Producing 433.7 479.4 489.4 10.0 2.1% 55.7 12.8%
Mining, Logging, & Construction 111.0 128.9 134.3 5.4 4.2% 23.3 21.0%
Manufacturing 322.7 350.5 355.1 4.6 1.3% 32.4 10.0%
Durable Goods Manuf. 205.5 224.1 227.4 3.3 1.5% 21.9 10.7%
Non Durable Goods Manufacturing 117.3 126.4 127.7 1.3 1.0% 10.4 8.9%
Private Service-Providing 1,964.2 2,148.1 2,195.5 47.4 2.2% 231.3 11.8%
Trade, Transportation, & Utilities 587.8 626.5 638.7 12.2 1.9% 50.9 8.7%
Wholesale Trade 118.0 119.3 121.0 1.7 1.4% 3.0 2.5%
Retail Trade 320.9 335.8 335.3 -0.5 -0.1% 14.4 4.5%
Transportation, Warehousing, & Utilities 148.9 171.5 182.4 10.9 6.4% 33.5 22.5%
Information 44.0 45.2 45.5 0.3 0.7% 1.5 3.4%
Financial Activities 144.2 168.4 172.2 3.8 2.3% 28.0 19.4%
Finance & Insurance 109.5 127.8 130.1 2.3 1.8% 20.6 18.8%
Real Estate, Rental & Leasing 34.6 40.6 42.1 1.5 3.7% 7.5 21.7%
Professional & Business Services 379.9 416.1 426.6 10.5 2.5% 46.7 12.3%
Professional, Scientific & Technical Services 122.9 140.6 146.7 6.1 4.3% 23.8 19.4%
Management of Companies & Enterprises 41.9 49.0 51.7 2.7 5.5% 9.8 23.4%
Admin, Support, Waste Mgt & Remediation
Services 215.1 226.6 228.2 1.6 0.7% 13.1 6.1%
Education & Health Services 405.8 435.9 442.2 6.3 1.4% 36.4 9.0%
Educational Services 55.0 61.0 62.1 1.1 1.8% 7.1 12.9%
Health Care & Social Assistance 350.8 374.9 380.2 5.3 1.4% 29.4 8.4%
Leisure & Hospitality 296.5 337.7 349.1 11.4 3.4% 52.6 17.7%
Arts, Entertainment & Recreation 32.4 39.8 42.6 2.8 2.4% 15.1 14.2%
Accommodation & Food Services 264.1 297.9 306.4 8.5 2.9% 42.3 16.0%
Other Services 106.1 118.4 121.2 2.8 2.4% 15.1 14.2%
Government 424.2 435.8 437.2 1.4 0.3% 13.0 3.1%
Federal Government 48.4 49.1 50.1 1.0 2.0% 1.7 3.5%
State Government 96.5 99.0 96.8 -2.2 -2.2% 0.3 0.3%
Local Government 279.3 287.6 290.4 2.8 1.0% 11.1 4.0%
Source: TN Department of Labor & Workforce Development, Current Employment Statistics
Table 1 shows that total Tennessee nonfarm employment was 3 million, 122 thousand, 1 hundred in 2019. The most
rapidly growing industries during 2014-2019 were arts, entertainment, and recreation; management of companies
and enterprises; and transportation, warehousing, and utilities.
14Tennessee Job Growth 2018-2019
Total Nonfarm 1.9%
Goods Producing 2.1%
Private Service Providing 2.2%
Mining, Logging, & Construction 4.2%
Manufacturing 1.3%
Trade, Transportation, & Utilities 1.9%
Information 0.7%
Financial Activities 2.3%
Professional & Business Services 2.5%
Education & Health Services 1.4%
Leisure & Hospitality 3.4%
Other Services 2.4%
Government 0.3%
0.0% 0.5% 1.0% 1.5% 2.0% 2.5% 3.0% 3.5% 4.0% 4.5%
Growth Rate
Source: TN Department of Labor & Workforce Development, Current Employment Statistics
Figure 7
15Tennessee Labor Force and Demographics
Tennessee’s June 2020 seasonally adjusted unemployment rate was 9.6 per-
cent, a decrease from the revised May 2020 rate of 11.0 percent. Over the past
year, Tennessee’s seasonally adjusted unemployment rate for increased from
Labor Force & 3.4 percent in June 2019 to 9.6 percent in June 2020 while the national rate in-
Demographics creased from 3.7 percent to 11.1 percent. The annual average unemployment
rate for the U.S. in 2010 was 9.6 percent and dropped to 3.7 percent in 2019, a
decrease of 5.9 percent. Tennessee’s annual average in 2010 was 9.7 percent
and declined to 3.4 percent in 2019, a decrease of 6.3 percent, which is more
significant than the United States.
Unemployment Rates - Tennesseee Unemployment Rates - US & Tennessee
Seasonally Adjusted - 2018 to 2020 Seasonally Adjusted - January 2013 to June 2020
18.0 18.0
16.0 16.0
15.5
14.0 14.0
Unemployment Rate (%)
Unemployment Rate (%)
12.0 12.0
11.0
10.0 10.0
9.6
8.0 8.0
6.0 6.0
3.6 3.6 3.6 3.6 3.6 3.6 3.5 3.5 3.5 3.4 3.4 3.4
4.0 4.0
3.3 3.4 3.3
3.4 3.4 3.5 3.5 3.5 3.4 3.4 3.4 3.3 3.3 3.3 3.3
2.0 2.0
0.0 0.0
Jan Feb Mar Apr May Jun Jul Aug Sep Oct Nov Dec 2013 2014 2015 2016 2017 2018 2019 2020
2018 2019 2020 TN US
Source: TN Department of Labor & Workforce Development, Local Area Unemployment Statistics, July 2020
Figure 8 Figure 9
Table 6: U.S. & TN Annual Not Seasonally Adjusted Unemployment Rates, 2010-2019
2010 2011 2012 2013 2014 2015 2016 2017 2018 2019
Unemp. Unemp. Unemp. Unemp. Unemp. Unemp. Unemp. Unemp. Unemp. Unemp.
Rate Rate Rate Rate Rate Rate Rate Rate Rate Rate
United 9.6% 8.9% 8.1% 7.4% 6.2% 5.3% 4.9% 4.4% 3.9% 3.7%
States
Tennessee 9.7% 9.0% 7.8% 7.8% 6.6% 5.6% 4.7% 3.8% 3.5% 3.4%
Source: U.S. Bureau of Labor Statistics, Local Area Unemployment Statistics, July 2020
16You can also read