The adult skills gap: is falling investment in UK adults stalling social mobility? - January 2019
←
→
Page content transcription
If your browser does not render page correctly, please read the page content below
The adult skills gap: is falling investment in UK
adults stalling social mobility?

January 2019

Social Mobility Commission

Sanctuary Buildings

20 Great Smith Street

London

SW1P 3BT

contact@socialmobilitycommission.gov.uk
About the Commission

The Social Mobility Commission is an advisory non-departmental public body
established under the Life Chances Act 2010 as modified by the Welfare Reform and
Work Act 2016. It has a duty to assess progress in improving social mobility in the
UK and to promote social mobility in England. It consists of 13 commissioners and is
supported by a small secretariat.

The Commission board comprises:

   •   Dame Martina Milburn (Chair).
   •   Alastair da Costa, Chair of Capital City College Group
   •   Farrah Storr, Editor-in-chief of Cosmopolitan
   •   Harvey Matthewson, Aviation Activity Officer at Aerobility and Volunteer
   •   Jessica Oghenegweke, Project co-ordinator at the Diana Award
   •   Jody Walker, Senior Vice President at TJX Europe (TK Maxx and Home
       Sense in the UK)
   •   Liz Williams, Group Director of Digital Society at BT
   •   Pippa Dunn, Founder of Broody, helping entrepreneurs and start ups
   •   Saeed Atcha, Founder and Chief Executive Officer of Xplode magazine
   •   Sam Friedman, Associate Professor in Sociology at London School of
       Economics
   •   Sammy Wright, Vice Principal of Southmoor Academy, Sunderland
   •   Sandra Wallace, Joint Managing Director Europe at DLA Piper
   •   Steven Cooper, Chief Executive Officer C.Hoare & Co

The functions of the Commission include:

   •   Monitoring progress on improving social
       mobility.
   •   Providing published advice to ministers on matters relating to social
       mobility.
   •   Undertaking social mobility advocacy.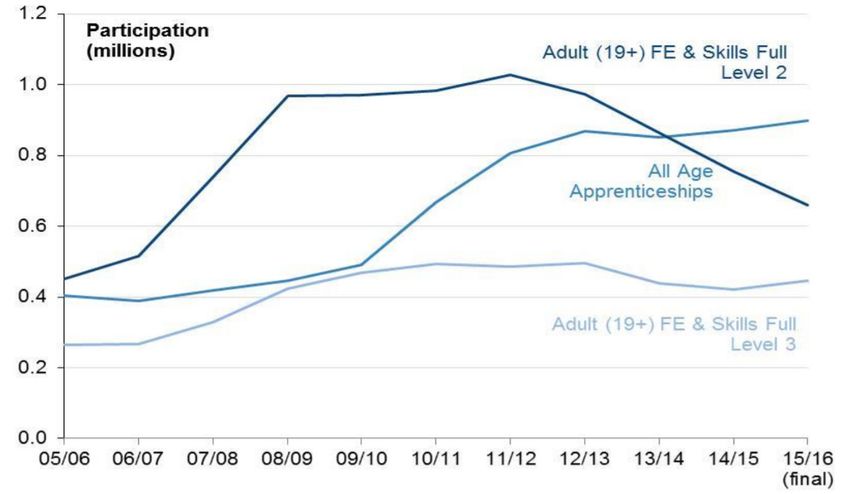
Report prepared by

Dr Daria Luchinskaya, Institute for Employment Research, University of Warwick
Peter Dickinson, Institute for Employment Research, University of Warwick

Institute for Employment Research, University of Warwick

Established in 1981, the Warwick Institute for Employment Research (IER) is a
leading international social science research centre. Its research is interdisciplinary
and made relevant to policy makers and practitioners. It is renowned for consistently
delivering high quality research.

Acknowledgements

The authors would like to acknowledge the UK Data Archive and the Institute for
Social and Economic Research for collecting and making available the data
examined in this project, and researchers from the Social Mobility Commission, the
Learning and Work Institute, and our colleagues at the Institute of Employment
Research for valuable advice and guidance during this project.
Contents
Executive Summary ......................................................................................................... 7

Introduction .................................................................................................................... 10

   Aims and objectives ................................................................................................... 10

   Research context ....................................................................................................... 10

      Data ........................................................................................................................ 11

      Definitions ............................................................................................................... 11

      Methodology ........................................................................................................... 14

Who invests in adult skills? ............................................................................................ 15

   Key findings ............................................................................................................... 15

      Financial investment in adult skills .......................................................................... 15

      Employers’ investment in adult skills ...................................................................... 16

      Government investment in adult skills .................................................................... 21

      Individuals’ investment in and acquisition of adult skills .......................................... 22

Who receives training? .................................................................................................. 26

   Key findings ............................................................................................................... 26

   Participation in job-related training in 2010 and 2017 ................................................. 31

      Type of training ....................................................................................................... 33

      Training by funding source ..................................................................................... 34

      Access to training by socioeconomic factors and other characteristics ................... 35

      Occupation ............................................................................................................. 35

      Socioeconomic background – respondent NS-SEC ............................................... 37

      Socioeconomic background – parental NS-SEC .................................................... 39

      Qualification level ................................................................................................... 41

      Sex ......................................................................................................................... 42
Ethnicity .................................................................................................................. 43
Age ......................................................................................................................... 44
Full-and part-time work ........................................................................................... 46
Public and private sector ........................................................................................ 47
Workplace size ....................................................................................................... 49
What affects the likelihood of doing job-related training or education? .......................... 50
Key findings ............................................................................................................... 50
Has the likelihood of participating in job-related training and/or education changed
between 2010 and 2017? ........................................................................................... 51
Does socioeconomic status affect the likelihood of having done job-related training
and/or education? ...................................................................................................... 52
How does individuals’ investment in adult skills affect socioeconomic outcomes? ........ 55
Key findings ............................................................................................................... 55
Evidence of the impact of adult skills on social mobility and earnings ........................ 55
What do we know about the wage returns to training? ........................................... 58
What do we know about the wage returns to qualifications? .................................. 60
What do we know about the social mobility returns to gaining adult skills?............. 61
Discussion ..................................................................................................................... 63
Who invests in adult skills? ........................................................................................ 63
Who receives training? ............................................................................................... 64
What affects the likelihood of doing job-related training or education? ....................... 65
How does individuals’ investment in adult skills affect socioeconomic outcomes? ..... 65
Evidence of the impact of adult skills on social mobility and earnings ........................ 66
Conclusions ................................................................................................................... 67
List of tables ............................................................................................................... 69
List of figures .............................................................................................................. 69Abbreviations BCS British Cohort Study BHPS British Household Panel Study CAMSIS Cambridge Social Interaction and Stratification [scale] CIPD Chartered Institute of Personnel and Development CVT Continual Vocational Training DfE Department for Education DWP Department for Work and Pensions ESS Employer Skills Survey FE Further Education HE Higher Education HR Human Resources IER Institute for Employment Research LEP Local Enterprise Partnership LFS Labour Force Survey NALS National Adult Learning Survey NCDS National Child Development Study NS-SEC National Statistics Socio-Economic Classification NVQ National Vocational Qualification ONS Office for National Statistics PPS Purchasing Power Standard SMC Social Mobility Commission SMCP Social Mobility and Child Poverty Commission SME Small and Medium-sized Enterprise SOC Standard Occupational Classification TSO Third Sector Organisation UKHLS UK Household Longitudinal Study (Understanding Society)
Executive Summary
Helping those from disadvantaged backgrounds to succeed remains high on the political
agenda. Research by the Social Mobility Commission and others has found little
improvement in social mobility in recent years and deep-seated regional inequalities still
exist across Britain.

Britain’s low levels of social mobility has attracted considerable amounts of research with
much of the attention focused on improving education and skills in young people.

However, a crucial and often overlooked area is adult skills. In 2017 the Commission
found that the UK has an endemic low pay problem with just 1 in 6 low-paid workers (17
per cent) managing to permanently escape from low pay in the last decade. 1 Meanwhile,
a quarter of low-paid workers remained stuck in low pay jobs.

Low pay is mainly a low skill problem but the UK currently lags behind other countries in
giving adults a second chance to get on. Compared to its main competitors, the UK
spends relatively little on vocational skills and investment in labour market support to
increase adult skill levels. Between 2010-11 and 2015-16, the government Adult Skills
budget in England fell by 34 per cent in real terms. 2

If the labour market is to work for everyone, those with lower skills and qualifications
need to be able to improve their career prospects and realise their ambitions. For this to
become a reality, employers and government have to create opportunities for individuals
through training and better career progression. The government’s National Retraining
Scheme provides an opportunity to refocus the adult skills budget on those with lower
skills and qualifications, in particular, anyone experiencing or risking their jobs being
displaced by technology.

In this report, we look at the adult skills landscape – by examining who invests in, and
who participates in, job-related training and education. We consider how these trends
have changed over time and to what extent adult skills affect social mobility.

We uncover evidence that people from the lowest socio-economic backgrounds are the
least likely to receive adult skills investment. First, there is growing evidence to suggest
that those whose parents were working class are less likely to do training than if their
parents were middle class – even though they are doing the same type of job. Second,
employers are more likely to invest in those with higher skills while better-off individuals
are also more likely to fund their own training. This results in widening existing skills
gaps as people from working class backgrounds are less likely to have higher skills –
and are less likely to earn high wages – than their peers from better off backgrounds.

Only state-funded training targets support to those from lower socio-economic
backgrounds, but this makes up a tiny proportion of all training courses undertaken
(around 7 per cent). The gender training gap, at the headline level has been closed.

1https://www.gov.uk/government/publications/low-pay-and-labour-progression-the-great-escape
2Foster, D. (June 2018). Adult further education funding in England since 2010. House of Commons Library
Briefing Paper Number 7708, 13 June 2018.
                                                                                                           7
Indeed, women may be more likely to participate in training – largely because a higher
proportion of women than men work in the public sector, where the provision of training
is higher than in the private sector.
We also found mixed evidence of the returns to investment in adult skills. Research
consistently suggests that the highest qualifications tend to lead to the highest returns,
that academic qualifications lead to higher returns than vocational ones at the same
level, and that qualifications gained later in life tend to secure lower returns than the
same qualifications earlier on. Adult skills provide second chances to individuals,
but those who benefit most are overwhelmingly those who already have higher
levels of adult skills.
Key Findings
• The poorest adults with the lowest qualifications are the least likely to access training –
despite being the group who would benefit most. Graduates are over three times more
likely to participate in training than those with no qualifications (30 per cent vs. 8 per cent
in 2017), and previous research has shown half (49 per cent) of adults from the lowest
socioeconomic groups have received no training since leaving school.
• Almost twice as many people in managerial, professional and associate professional
occupations access training (30 per cent) compared to those in intermediate (16 per
cent) or routine and manual occupations (18 per cent).
• Bigger companies with better developed HR strategies are also more likely to fund
training than smaller companies, but employers are prioritising high-qualified workers in
senior positions for skill investment.
• Since 2010, the proportion of training funded by government decreased and employer
funding stayed flat, leaving individuals to fund more of their own training.
• About £44 billion was spent on training (excluding student loans) in 2013/14 with most
training (82 per cent) provided by employers and much of the rest by individuals. The
Government only funds 7 per cent of all investment in adult skills and in 2016-17 over
£63 million of the adult training budget was unspent. UK spend on vocational training per
employee was half the EU average.
• The public sector is more likely to provide training than the private sector (in 2017, 36
per cent of public sector workers participated in training compared to 19 per cent in the
private sector).
• Men in routine and manual occupations were the least likely group to have done training
regardless of age.
• In 2017, more women than men undertook training (26 per cent versus 21 per cent),
more people from Black and Black British ethnic backgrounds than from white
backgrounds (32 per cent compared to 23 per cent), and more younger than older
people (25 per cent of 25-29 year olds compared to 17 per cent of 60-64 year olds).
• Adults whose parents worked in professional or managerial occupations are more likely
to participate in training, no matter what their own occupation is, than those whose
parents worked in lower-skilled occupations. This is because children of high-skilled
parents are more likely to be high-qualified and in high-skilled jobs themselves, both of
which increase access to training.
8An action plan:
This report shows there is a ‘virtuous’ and a ‘vicious’ cycle of learning, whereby those
with the lowest or no qualifications are much less likely to get education and training and
the highest qualified are likely to receive the most. This urgently needs to be reversed
through a focus from employers and government on supporting those with low or no
qualifications, those in the lowest skilled occupations, and those in the lowest
socioeconomic groups.
Improving the social mobility impact of training will need three key changes:
1. Increased employer spend on lower-skilled, low-paid workers
2. Government support for increased availability of, and access to, free courses for
those who cannot pay themselves
3. Increased quality of training in terms of earning gains, and improved careers
education, information, advice and guidance
1. Employers should seek to understand and address disparities in their training
investment, and consider better work progression pathways by:
• Improving the level and flow of skills within the business by developing workforce skills
to help career progression, with a focus on those in low skilled roles.
• Investing in the skills of the unemployed and economically inactive people in their local
areas to increase the skills supply into businesses.
2. Government should increase the availability, accessibility and quality of
training for adults who need it most by:
• Increasing spending on education and training to bring it closer to that of international
competitors, for example, to comparable expenditure levels of GDP, prioritising this extra
financial support for those with no/low skills and qualifications.
• Ring-fencing National Retraining Scheme funds for the groups who are shown receive
the lowest investment, including low-paid and/or low-skilled people who are self-
employed and men in routine, manual roles (particularly older men).
• Reducing underspend of the Adult Skills budget via more flexible rules, including more
digital and distance learning and flexibility in any underspend of the apprenticeship levy
so that it can support shorter courses for low-skilled workers.
3. Government should also improve the quality of information available on adult
skills, training and careers by:
• Improving monitoring of government-funded and government-managed training
provision for the take-up by, and impact on, those with low or no qualifications, those in
lower level occupations and those in low socioeconomic groups, to inform evidence and
to learn what works.
• Investing in research on the impact of investing in training on longer-term social mobility
outcomes to help individuals make informed choices about their training, using this to
improve careers education, information, advice and guidance for adults.
9Introduction
Warwick University Institute for Employment Research was commissioned by the Social
Mobility Commission to undertake research into adult skills and social mobility.
Aims and objectives
The main aims of this research are to explore:
1. How are adult skills defined and what is included in this definition in the scope of
this report?
2. Who invests in adult skills in the UK, and how has this changed over time?
3. What characteristics affect the decision to invest in adult skills?
4. How do adult skills affect socioeconomic outcomes?
5. How do the findings inform policy goals of improving social mobility, in light of the
government agenda of this Parliament, and longer-term changes to jobs and
skills, and any recommendations about measuring and monitoring data going
forward?
Research context
Social mobility in Britain is high on the political agenda. The State of the Nation 2017
report highlighted deep regional inequalities cross-cutting Britain. This revealed a stark
postcode lottery where the opportunities and life chances of people from disadvantaged
backgrounds is bound by where they live. 3 Research by the Commission and others has
found that Britain has an ongoing ‘social mobility problem’ 4 that has attracted
considerable research and proposed solutions. At present, some of the main questions
being asked focus on the relationship between the adult education agenda and social
mobility, and include the following:
• Intergenerational movements: what are the odds that someone can end up in a higher
class position (destination) than their parents’ class position (origin)?
• Intragenerational movements: what are the chances of someone ending up in a higher
position than that they started from?
• What are the chances of access to professional occupations and elite universities for
people from different backgrounds? 5
• How do these issues vary with geography, sex, health, ethnicity, and other
characteristics?
• What can be done to improve social mobility and life chances for people?
3 SMC. (November 2017). State of the Nation 2017: Social Mobility in Great Britain. London: Social Mobility
Commission.
https://www.gov.uk/government/uploads/system/uploads/attachment_data/file/662744/State_of_the_Nation_2017
_-_Social_Mobility_in_Great_Britain.pdf
4 Elliot Major, L. (2017). Stuck: Britain’s social mobility problem. Key note speech given at the University of
Warwick, 2nd November 2017. London: The Sutton Trust. https://www.suttontrust.com/newsarchive/britains-
social-mobility-problem-2/
5 E.g. SMCP. (August 2014). Elitist Britain? London: Social Mobility and Child Poverty Commission.
10Education has often been seen as a vehicle for social mobility, but its effectiveness has
been questioned. In this report, we focus on looking at who invests in adult skills, how
this has changed over time, and whether investment in adult skills has any measurable
impact on social mobility. We explain how we approach these issues below.
Data, definitions and methodology
The exploratory research in this report focuses on whether individuals’ investment in
adult skills varies with their socio-economic background, and the kinds of outcomes that
can result.
Data
The analysis draws on two main datasets, the Labour Force Survey (LFS) and
Understanding Society (UKHLS). The Quarterly Labour Force Survey is a survey of
randomly-selected households. It has been carried out since 1992, although the quarters
used in the Survey shifted from seasonal to calendar basis in 2006. There are roughly
90,000 individuals in each LFS quarterly survey, of whom about half are economically
active. From the July-September 2014 quarter, the LFS included a new module on social
mobility, which asks who the main wage earner was when the respondent was aged 14,
and what occupation the main wage earner did. However, this question module only
appears in the third (July-September) quarter, and is not available in the Annual
Population Survey.
Understanding Society (UKHLS) is a longitudinal panel survey which follows a sample of
the UK population since 2009 and incorporates the British Household Panel Study
(BHPS, a similar longitudinal study, which started in 1991). Understanding Society
contains over 40,000 households or over 100,000 individuals, with around 50,000
interviews with adults (aged 16+). The BHPS is considerably smaller, with roughly 5,000
households and 10,000 individual adult interviews. UKHLS waves 1-7 cover the period
2009-2016. Its design means that it is possible to look at variation in the decisions to
invest in adult skills and in outcomes by sub-group, and to look at geographic region in
more detail (England, Scotland, Wales, Northern Ireland) than would have been the
case if the BHPS data had been used. 6
Definitions
By adult skills, we mean the education and training that people undertake once they
leave formal full-time education, although adult skills can of course be a much broader
concept than that (e.g. skills that people develop through a number of activities, such as
childcare, voluntary work, and as part of their daily life). In this report, we focus on two
main measures of adult skills: whether individuals have undertaken any job-related
training or education in the last three months or in the last year, and whether
individuals have gained any qualifications in the last 12 months. Specifically, we
focus on whether individuals have undertaken education and training or gained
qualifications themselves, rather than looking at whether employers have funded
6Initially the BHPS did not contain a Northern Irish sample, and had relatively low numbers for Wales and
Scotland. Boosters for Scotland and Wales were introduced in wave 9, and a Northern Irish sample was
conducted at wave 11.
11individuals’ access to adult skills. Types of training include: induction training, health and
safety training, as well as training to develop one’s skills, or for professional/occupational
standards reasons. Training might also be categorised into on- and off-the-job, with the
latter tending to be more formal, and tending to yield higher wage returns than the
former. As we refer to the findings from other research, the definitions of education and
training vary according to the source, as do the definitions of social groups.
When we talk about social mobility outcomes in this report, we focus more on
intragenerational social mobility, i.e. the extent to which the life chances and outcomes
of individuals are affected by their acquisition of skills and qualifications in their adult life,
and the extent to which education and training enables people to increase their
earnings and become upwardly socially mobile. We do also look at parental
background, i.e. the occupations of the individuals’ parents when the individuals were
children. We use two measures of social mobility: the 3-group National Statistics Socio-
economic Classification (NS-SEC), and the gross monthly income in respondents’ main
jobs. For more information about the NS-SEC, see Box 1.
12Box 1: The NS-SEC
The NS-SEC is a socioeconomic classification to categorise people into social
classes based on their occupation and labour relations. Introduced in 2000, it builds
on the Goldthorpe Schema sociological classification of class and measures
employment relations and conditions of occupations. In so doing, it shows the
structure of socio-economic positions in modern societies (ONS, 2010).
The main employment relations distinctions are between employers, employees,
and the self-employed, and employees can be further classified by employment
regulations such as: a service relationship (salary, career advancement, benefits), a
labour contract (labour exchanged for a wage based on work done or time
expended), or a hybrid, intermediate type of relationship. Further distinctions are
made in terms of company size. The table below shows how the 8- 5- and 3-class
NS-SECs are related to each other. In this report, we use the three-group NS-SEC:
whether someone is working in the managerial or professional occupations,
intermediate occupations, or routine occupations. Note that the NS-SEC aims to
describe employment relations and not skill levels (as is the case with the SOC).
NS-SEC classes
Source:
https://www.ons.gov.uk/methodology/classificationsandstandards/otherclassifications/thenational
statisticssocioeconomicclassificationnssecrebasedonsoc2010
Proportion of employed adults aged 25-64 in each NS-SEC class (2017, LFS)
1. Higher managerial, administrative and professional occupations: 47 per cent
2. Intermediate occupations: 24 per cent
3. Routine and manual occupations: 29 per cent
13Methodology
We focus on adults aged 25-64 because younger adults are more likely to engage in full-
time education, while people who are retired are less likely to engage in training and
their socioeconomic status is harder to capture (socioeconomic status is typically linked
to an occupation). We also focus on adults in employment, in part this is because the
main measure used in the LFS is job-related training, but also because we would like to
exclude any mandatory training programs that people who are claiming unemployment
benefit may have to undertake or leisure courses which people take for their own
personal pleasure.
Cross-sectional descriptive analysis is carried out to gain an understanding of the data,
using the 2010 and 2017 Labour Force Surveys for July-September quarter. We then
run a regression to see whether individuals’ investment in adult skills has changed over
time, and what characteristics affect the decisions to invest in adult skills. See the
technical annex for a more detailed discussion of our methodology.
We also include a discussion of the impact of investment in adult skills on social mobility
and earnings from a range of existing research sources and summarise the main
findings. We did attempt to investigate the effect of investment in adult skills (gaining
training or a new qualification) on social mobility but encountered several problems in
the data. A discussion of our approach is included in the technical annex. Moreover, we
consider that, as there is an extensive research literature on the effect of undertaking
training and gaining new qualifications on wages, discussing some of the most influential
findings to date would provide a more balanced view, rather than conducting an
additional study. The main contribution of our report is that we specifically look at the
differences in adult skills investment, and their impact on social mobility, by socio-
economic background.
The report starts with a short review of the main research on social background and
investment in adult skills. First, we show who undertook training in 2010 and 2017
using the Labour Force Survey (LFS) 2010 and 2017 July-September quarters. Next, we
look at how multiple factors affect the likelihood of participating in training using the LFS
(and also analyse the UKHLS, details in the technical annex). We then bring together a
range of recent research findings to discuss the impact of investing in adult skills on
social mobility outcomes. The findings form the basis for the discussion and
recommendations section. The conclusion summarises the main threads of the report
and situates our findings in a broader policy context.
14Who invests in adult skills?
Key findings
• Around £44 billion was spent by employers, individuals and the government on training
(excluding HE loans) in 2013-14.
• According to analysis of training expenditure, most training is funded by employers (82
per cent) and individuals (9 per cent per cent).
• Just 7 per cent of training is funded by government. This tends to be provision targeted
at those with lower/no qualifications and at those living in deprived areas.
• Employer-funded provision tends to be from those organisations with better developed
human resources and product marketing strategies, which are both linked to ‘good’ jobs.
• Larger employers are more likely to invest in training than smaller employers (with fewer
than 50 employees).
• Public sector employers are more likely to invest in training than private sector
employers.
Financial investment in adult skills
The financial investment in adult skills, including direct (such as training fees) and
indirect (for example, lost earnings/production time) investment, is funded by individuals,
employers, the state, and/or third sector organisations (TSOs).
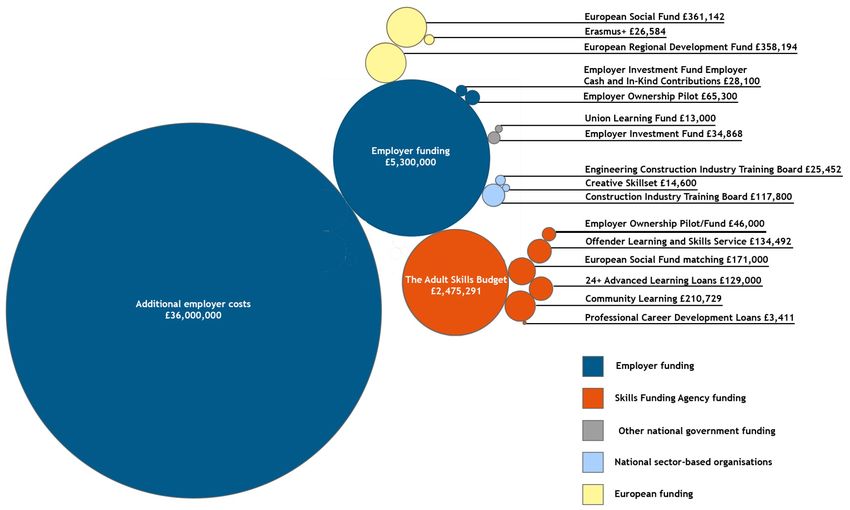
In 2013-14, direct employer funding of training 7 was estimated at £5.3 billion, and
government funding (through the Department for Business, Innovation and Skills)
amounted to around £3 billion (Figure 1). 8 Other government departments, particularly
the Department for Work and Pensions, also fund training (estimated as £0.35 billion) 9
but these figures are not included in the diagram. European sources of funding (primarily
the European Social Fund and European Regional Development Fund) totalled just over
£0.7 billion. 10 The largest contribution by far is additional or indirect employer costs,
which contribute an additional £31 billion to the funding of training. Overall, employers
spent £36 billion in training in 2013-14. Individuals’ expenditure in 2014-15 was
estimated to be at just under £4 billion (excluding loans). We assume that individual
expenditure is a similar amount in 2013-14, and add this to the amount in Figure 1 to get
a sense of the total spend on training in that year.
Overall, the total spend on training illustrated in Figure 1 and including individuals’
expenditure roughly amounts to £44 bn. Of this, 82 per cent was funded by employers
7 Employer direct funding of training includes cash contributions covering fees to external training providers and
costs of running training centres, which is arguably the type of training spend most similar to the Adult Skills
Budget (ASB). Additional employer costs include on-the-job training, trainee labour costs, and trainer and training
management costs.
8 No comprehensive data exists on the amount of TSO funding to support people’s training. Providing the
comprehensive amount of funding by TSOs is not possible, due to the complexity of TSO organisations, TSOs’
use of other funding sources e.g. the state, and the lack of surveys of the sector.
9 Gloster, R., Marvell, R., Buzzeo, J., Hadjivassiliou, K., Williams, J. and Huxley, C. (2016). Mapping investment
in adult skills: Which individuals, in what learning and with what returns? BIS Research Paper. London: BIS.
10 It is at present unclear to what extent skills funding from EU sources, in particular from the European Social
Fund and European Regional Development Fund programmes, will be replaced after Brexit.
15(directly or indirectly), 7 per cent by the government, 9 per cent by individuals (including
loans) and 2 per cent by the EU.
Figure 1: Sources and scale of investment 11 in adult skills in England (£’000s) for
2013-14
Source: LFS 2013-14; ESS 2013, Figure taken from Gloster et al. (2016), p. 17.
Employers’ investment in adult skills
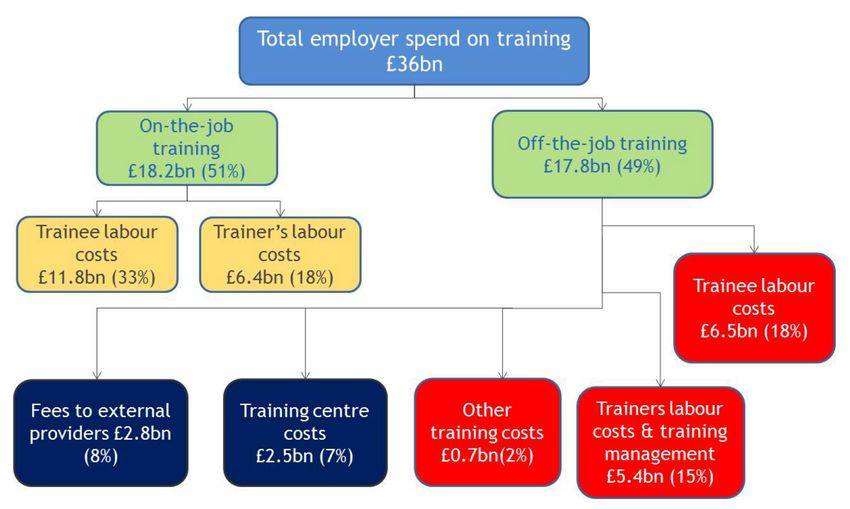
The breakdown of the employers’ £36 billion total investment is shown in Figure 2.
Funding was split almost equally between off- and on-the- job training. The largest
component of both of these types of training are trainees’ and trainers’ labour costs.
11 Employer spending on fees includes all employer contributions (on and off the job training).
16Figure 2: Overview of employer spend on training
Source: Taken from Gloster et al. (2016), p. 19
The level of employer investment in training varies by sector, and is closely related to
whether the organisation is public (where 84 per cent of employers have funded or
arranged employee training), third sector (82 per cent) or private (71 per cent, Employer
Perspectives Survey, 2016). 12 Organisations who have recruited in the past 12 months
are also much more likely to invest in staff training (89 per cent) compared to those who
had not (56 per cent). Human resources practices are also closely related to training
investment: 90 per cent of those employers accredited with Investors in People funded
staff training compared to 69 per cent who were not. Organisations with a positive
growth outlook are also more likely to fund staff training: 79 per cent who expected the
business to grow paid for employee training, compared to 60 per cent of those who
expected the business to contract or remain the same.
Private sector employers with a higher product market strategy 13 are much more likely to
invest in staff training (Employer Skills Survey, 2015). Of those describing their business
12 Shury, J. et al. (2017). Employer Perspectives Survey 2016 : Research report. IFF Research, Department for
Education.
https://assets.publishing.service.gov.uk/government/uploads/system/uploads/attachment_data/file/622343/EPS_
2016_UK_Report.pdf
13 The product market strategy is a composite score based on five questions which asks employers, for example,
how innovative they are; and the extent to which their goods and services are price dependent (as opposed to
quality, service or innovation). See Vivian, D., et al. (2016). Employer Skills Survey 2015:UK Results. Evidence
Report 97 May 2016, Amended May 2018. London: UKCES.
17as having a high or very high product market strategy, 69 per cent funded staff training
compared to 54 per cent with a low or very low product market strategy. Those with a
high/very high product market strategy were also much more likely to fund off-the-job
training (51 per cent compared to 37 per cent). The orientation of the business with
regard to product market strategy, as well as management practices, are key
components of strategies to address low productivity and wages, and address poverty. 14
Whilst employer investment in skills training appears substantial, a number of studies
have identified that, compared to its main competitors, the UK has relatively low
spending on vocational skills 15 and that investment in labour market support that can
increase adult skill levels. 16 The picture is somewhat complex. In general, a high
proportion of UK firms provide training, although this proportion has declined over time.
In 2015, 86 per cent of UK enterprises provided continual vocational training (CVT)
courses and other forms of CVT compared to the EU-28 average of 73 per cent. 17, 18 In
2005, however, the proportions were 90 per cent and 60 per cent respectively (i.e. over
the period 2005-2015 the proportion of UK firms providing training has fallen while the
EU-28 average proportion has risen). Similarly, on a simple headcount basis,
participation in adult education and training in the UK was above the EU-28 average in
2011 (16.3 per cent vs. 9.1 per cent) and in 2016 (14.1 per cent vs. 10.8 per cent),
although the proportion in the EU-28 has risen, while that in the UK has fallen over the
period. Moreover, these measures do not capture the quality or extent of the training.
In contrast, the proportion of employees accessing training was lower in the UK than in
the EU. In 2015, only 30 per cent of the UK’s employees received CVT compared to the
EU average of 41 per cent and this proportion is well below that of the other European
G7 countries (France, Germany and Italy). 19 Moreover, this represents a decline for the
UK since 2005. Whilst the proportion of employees receiving continual vocational
training in the UK fell by 2.2 percentage points between 2005-2015, the proportion
across the EU rose by 8 percentage points.
Furthermore, Figure 3 shows that the expenditure per employee on training courses is
also much lower in the UK than the EU. In 2015, the amount spent per employee in the
UK was just half of the EU-28 average (comparison in euro, down from 80 per cent in
https://assets.publishing.service.gov.uk/government/uploads/system/uploads/attachment_data/file/704104/Emplo
yer_Skills_Survey_2015_UK_Results-Amended-2018.pdf
14 For example, see Green, A. E., et al. (2018), Raising productivity in low-wage sectors and reducing poverty.
York: Joseph Rowntree Foundation.
15 Greatbatch, D. and Tate, S. (July 2017). Funding and expenditure in post-16 education: An international
review. London: Department for Education.
16 Cedefop. (July 2017). Investing in skills pays off: The economic and social cost of low-skilled adults in the EU.
Thessaloniki: Cedefop.
17 Figures taken from http://ec.europa.eu/eurostat/web/education-and-training/data/database ‘Enterprises
providing training by type of training and size class - % of all enterprises (trng_cvt_01s)’
18 “Continuing vocational training (CVT) refers to education or training measures or activities which are financed
in total or at least partly by the enterprise (directly or indirectly). Part financing could include the use of work-time
for the training activity as well as financing of training equipment.”
http://ec.europa.eu/eurostat/cache/metadata/en/trng_cvt_esms.htm
19 Figures taken from http://ec.europa.eu/eurostat/web/education-and-training/data/database ‘Participants in CVT
courses by sex and size class - % of persons employed in all enterprises (trng_cvt_12s)’
182005). 20 The amount spent per training participant in the UK was also below EU levels,
around two thirds of the EU average in 2015 (68 per cent, down from 82 per cent in
2005). In addition, the UK spends less on vocational training as a proportion of the EU-
28 if the purchasing power standard exchange rate is used to adjust for the cost of living
in different countries instead of euro. 21
In addition to the measures discussed above, the UK is below the EU average on the
following training-related measures: the proportion of GDP spent on education and
training (see also Figure 4); the participation rate in education and training; the duration
of formal training, and the level of training accessed. 22 This relative lack of investment
manifests itself in the comparative skills of the British workforce. According to the
OECD’s Survey of Adult Skills, 2013-16, England is ranked 14th on literacy, 18th on
numeracy and 10th on problem solving. 23
Employer skills training, already at a low level by international standards, has remained
broadly flat overall, and may have fallen slightly in real terms between 2011 and 2015
(see Table 1). 24 Total employer expenditure has fallen by an estimated 3 per cent in real
terms, the amount per person trained and per employee has also fallen by 19 per cent
and 6 per cent respectively. Investment in management training has increased by 18 per
cent suggesting that training for most other categories of employees has fallen.
The picture across UK countries varies significantly. In Scotland, total employer spend
on training increased by 24 per cent and the amount per employee rose by 20 per cent.
In England, total employer skills training expenditure fell by 2 per cent whilst spend by
employee remained static. In Wales and Northern Ireland, however, both these amounts
fell, and by larger amounts than in England.
20 Figures taken from http://ec.europa.eu/eurostat/web/education-and-training/data/database ‘Cost of CVT
courses by type and size class - cost per person employed in all enterprises (trng_cvt_17s)’ and ‘Cost of CVT
courses by type and size class - cost per participant (trng_cvt_19s)’. Data last updated June 2018. In 2015, the
UK spent 293 euro on training per employee compared to 585 euro across the EU-28, while in 2005 the figures
were 383 euro and 478 euro respectively. In 2015, the UK spent 961 euro on training per employee compared to
EU-28 of 1,418 euro, while in 2005 the figures were 1,178 euro and 1,438 euro respectively.
21 The purchasing power standard is an artificial currency constructed to reflect the different price levels – and
thus the cost of living – in different countries. In 2015, the amount spent on CVT courses per employee in the UK
in purchasing power standard terms was just 38 per cent of the EU-28 average (220 pps vs. 585 pps), while the
amount spent per training participant was 51 per cent of the EU average (721 pps vs. 1,418 pps).
22 See: http://ec.europa.eu/eurostat/statistics-
explained/index.php?title=File:Participation_rate_in_education_and_training,_2011_(%C2%B9)_(%25)_YB16.pn
g (participation rate and level of training) and Eurostat ‘Hours spent in CVT courses by size class - hours per
person employed in all enterprises (trng_cvt_23s)’ (duration).
23 See IPPR. (February 2017). Skills 2030: Why the adult skills system is failing to build an economy that works
for everyone. London: IPPR. https://www.ippr.org/files/publications/pdf/skills-2030_Feb2017.pdf
24 New Economy. (2017). Investment in skills. Manchester: New Economy. Note, however, that it is not clear from
the New Economy report how the real-terms employer spending figures have been calculated and which deflator
has been used. Given that it is not clear which deflator should be applied to nominal employer spend figures to
adjust for changes in costs, and given that labour costs have been dampened owing to slow growth in real
wages, we can broadly say that, whether adjustments are made or not, employer spending on training in the UK
has not changed by much between 2011 and 2015.
19Figure 3: Average expenditure on CVT courses per employee by enterprises in the
EU-28, 2005-15, euro
France
Germany
EU-28
Italy
United Kingdom
0 200 400 600 800 1,000 1,200 1,400
2005 2010 2015
Source: Eurostat ‘Cost of CVT courses by type and size class - cost per person employed in all
enterprises [trng_cvt_17s].’ 25 Selected countries shown.
Table 1: Real terms spending by employers on skills by type of investment (UK),
2011-2015
2011 2013 2015 Per cent
change
2011-
2015
Total (£ bn) 46.8 44.4 45.4 -3%
On job (£ bn) 24.3 22.4 22.5 -7%
Off job (£ bn) 22.5 22.0 22.9 2%
Training cost minus 23.9 22.0 23.8 0%
wages/opportunity cost (£ bn)
Fees to external provider (£ bn) 2.9 2.5 2.2 -24%
Management training (£ bn) 6.5 6.7 7.7 18%
Per person trained £ thousand) 3.2 2.7 2.6 -19%
Per employee (£ thousand) 1.7 1.6 1.6 -6%
Source: Employer Skills Survey various years, taken from New Economy (2017)
25 http://ec.europa.eu/eurostat/web/products-datasets/-/trng_cvt_17s
20Government investment in adult skills
The levels of government investment in adult skills in England seem to be decreasing
over time. Broadly, since 2013-14, some of the grant component of the Adult Skills
Budget 26 has been replaced by loans – an example of shifting resources from the state
to the private sector, so while the overall budget allocations are similar, the composition
of the budget has moved away from government and towards individuals and
employers.
The adult further education budget comprises the Adult Skills Budget (the majority of the
adult further education allocations) and also smaller funding areas, such as the offender
learning and skills service and community learning. The Adult Skills Budget fell by 34 per
cent in real terms (29 per cent in cash terms) between 2010-11 and 2015-16. From
2015-16, the Adult Skills Budget excluding apprenticeships was combined with
community learning and discretionary learner support to create the Adult Education
Budget. This new Adult Education Budget is set to continue falling in real terms (remain
at the same level in cash terms) between 2015-16 to 2019-20. In contrast, 19+
apprenticeships and advanced learner loans funding allocations are set to rise
substantially. However, not all of these increases will be government funded. Part of the
19+ apprenticeships funding increases will come from employers (from 2017-18 through
the apprenticeship levy), while advanced learner loans will be mostly borne by
individuals themselves.
In 2019-20, the total adult further education and skills budget is planned to be £3.78bn,
up from £2.94bn in 2015-16 and £3.18bn in 2010-11 (cash terms). 27 In cash terms, this
represents an 8 per cent fall between 2010-11 and 2015-16, and a 29 per cent rise from
2015-16 to 2019-20. However, by 2019-10, loans and apprenticeships will comprise
around half of the total adult further education and skills budget, up from a third in 2010-
11. In 2019-20, advanced learner loans are expected to constitute 13 per cent of the
budget compared to just 7 per cent in 2015-16. Apprenticeships for people aged 19+ are
expected to increase from 25 per cent of the budget in 2015-16 to around 38 per cent of
the budget in 2019-20.
It should also be noted that the government’s Adult Education Budget is not fully spent
each year. In 2016-17, for example, at least £63 million was unspent, 28 equivalent to
around 5 per cent of the total amount allocated. 29 Some of the budget was used to
support further education colleges generally. A possible explanation for some of the
underspend is that it may arise due to restrictions on how money can be spent and lower
demand for college-based courses, as full-time workers cannot always access them.
In addition, there is a move to devolve the Adult Education Budget to Mayoral Combined
Authorities in England from 2019-20. Such a move would allow local areas to work more
26 The Adult Skills Budget includes classroom-based further education, adult apprenticeships and other
workplace training.
27 This excludes funding from the European Social Fund programmes.
28 Milton, A. (February 2018). Answer to Adult Education: Public Expenditure: Written question –127048.
https://www.parliament.uk/business/publications/written-questions-answers-statements/written-
question/Commons/2018-02-06/127048/
29 Foster, D. (June 2018). Adult further education funding in England since 2010. House of Commons Library
Briefing Paper Number 7708, 13 June 2018.
21closely with other organisations such as local enterprise partnerships and respond to
local needs. However, the funding formula for calculating the grants to local areas has
not yet been developed, and no financial plans have yet been announced for the Adult
Education Budget going forward from 2020-21 onwards.
Government investment in training is also at comparatively low levels internationally.
Comparing expenditure on training across countries is complicated due to differences in
definitions and finding a comparable unit of measurement, therefore the analysis should
be treated with caution. However, Figure 4 supports the argument that the UK tends to
have internationally low levels of investment in skills. As a proportion of GDP, public
expenditure on training in Great Britain was among the lowest of the G7 countries
between 2004-2011 with only Japan at comparably low levels.
Figure 4: Public expenditure on training as a percentage of GDP, G7 countries,
2000-2016
0.6
0.5
0.4
0.3
0.2
0.1
0
Canada France Germany Italy Japan Great Britain USA
Source: OECD data 2000-2016 30
Individuals’ investment in and acquisition of adult skills
Most information about individuals’ financial investment in adult skills comes from data
on learner loans. Several points have to be clarified before we discuss the data. First,
any loans-based measure can only approximately measure individuals’ investment in
adult skills, because it does not capture individuals’ private means spent on training or
30 Accessed from https://data.oecd.org/socialexp/public-spending-on-labour-markets.htm
22qualifications without taking out a loan – data on individuals’ own expenditure have to be
found from other sources. Second, not all individuals will repay the full amount of their
loans. 31 Regarding the largest component of individuals’ investments in adult skills,
higher education loans, an estimated 83 per cent of students will not repay the full
amount, and if the amount outstanding is to be met by the government, this would
contribute to the long-term government cost of higher education provision. 32 Third,
higher education (HE) and further education (FE) are devolved policy areas, which
means that each UK constituent country (England, Scotland, Wales and Northern
Ireland) decides its own policy on providing and financing these systems. Most estimates
of learner loans are based on data for England only. Third, the HE and FE loans
systems have been under considerable change in recent years, which results in a
complex set of criteria about who repays what and under what conditions. This makes it
quite difficult to compare changes in individuals’ investments in adult skills over time.
Undergraduate HE loans make up the bulk of all HE loan figures. Masters loans were
introduced in April 2016, 33 and doctoral loans will come into effect from August 2018. 34 In
England, the most recent change to the amount taken out in student loans came in
2012-13, when new entrants to HE faced tuition fees of roughly £9,000, compared to
earlier cohorts, whose tuition fees were roughly £3,000. 35
FE loans were introduced in August 2013, and were available to those aged 24 or older,
studying for qualifications at levels 3 and 4 (A-levels/equivalent and certificate of higher
education/equivalent). From August 2016, FE loans were expanded to people aged 19
or older, and extended the range of qualifications to include levels 5 and 6 (diploma of
higher education/foundation degree/equivalent and degree/equivalent respectively). 36
An estimate of individuals’ investment in education and training in England was
undertaken based on the National Adult Learning Survey (see below), and data from the
higher education and further education loans companies in 2014-15. Individuals’
expenditure in 2014-15 was estimated to be at just under £4 billion, whilst higher
education and further education loans (tuition and maintenance) totalled at around £11
billion, of which £0.12 billion was further education loans. 37 More recent data on higher
education loans only show that the tuition and maintenance loans in England amounted
31 New Economy. (2017). Investment in skills. Manchester: New Economy.
32 Institute for Fiscal Studies. (October 2017). Higher Education finance reform: Raising the repayment threshold
to £25,000 and freezing the fee cap at £9,250. IFS Briefing Note BN0217.
33 https://www.slc.co.uk/media/latest-news/apply-now-for-postgraduate-student-funding.aspx;
34 https://www.gov.uk/funding-for-postgraduate-study
35 Prior to 2006-07, tuition fees were roughly £1,000, initially introduced in the academic year 1998-99.
36 See https://www.gov.uk/advanced-learner-loan/eligibility and see https://www.gov.uk/what-different-
qualification-levels-mean/list-of-qualification-levels for an overview of levels and corresponding qualifications.
37 New Economy. (2017). Investment in skills. While these figures are not broken down by age, a rough ‘back of
the envelope’ calculation can be made for illustration purposes. If we assume that older learners take out loans at
the same rate as all students, we can multiply the total amount of HE loan by the proportion of over-25s in HE
(first degree). This gives a figure of £10.7bn * 0.17 = £1.8bn (tuition and student loan) in 2014-15 for the over-
25s. In practice, older students’ different circumstances may mean that the rate of loan take-up differs from that
of students aged under 25.
23to £12.8bn in 2016-17 (provisional figures). 38 This increase partly reflects the change in
replacing maintenance grants in full by loans from 2016-17. 39
Investments made by individuals appear to be the only category of skills spending to
rise, however, these data are difficult to compile and compare over time, as discussed
above. The evidence for this claim comes from looking at individuals’ learner loans, and
assuming that all loans in their entirety are to be repaid by individuals. The data suggest
that individuals’ learner loans, and predominantly HE loans, have increased over time. In
2014-15, the Student Loans Company reported £10.7bn loan funding (of which £3.7bn
was for maintenance), an increase of £4.7bn since 2010-11.
Regarding participation in HE and FE, it is worth highlighting that for those participating
in first degrees across all modes of study (full- and part-time), the proportion of students
aged 25 or over fell from 20 per cent in 2012-13 to 16 per cent in 2017-18. 40 Looking just
at disadvantaged students, the number of part-time students (who are mostly older) from
low-participation areas (POLAR3 Q1) has fallen by 47 per cent since funding changes in
2011-12. 41 For those on postgraduate courses, the proportion of people on taught
courses (predominantly masters courses) aged 25 and over fell slightly (65 per cent and
62 per cent), while for research courses it remained broadly unchanged (78 per cent and
77 per cent) over the same period. Further education participation levels in England
were at 2.3 million aged 19 and older in government-funded adult education in 2015-16,
down from around 3.1 million in 2010-11. 42
Regarding FE, the data suggest that overall, adult (19+) participation has been
decreasing since 2010-11. In particular, the number of people enrolled on Full Level 2
courses has fallen considerably since 2010-11, Full Level 3 participation was slightly
lower than in 2010-11, while the number of apprenticeships (at all ages) has been
increasing. Apprenticeship figures increased between 2004-05 and 2016-17 as eligibility
criteria were relaxed, extending apprenticeship availability to people aged 25 or over. 43
Of apprenticeship starts in 2016-17, almost half (46 per cent) went to those aged over
25, up from just over a third in 2013-14. 44 However, apprenticeship starts have fallen by
38 Student Loans Company. (2018). Student Support for Higher Education in England 2017: academic year 2016-
17 payments, 2017-18 awards. Student Loans Company. https://www.slc.co.uk/media/9667/slcsfr052017-with-
correction.pdf
39 Bolton, P. (2018). Student Loan Statistics. House of Commons Library Briefing Paper Number 1079, 28
February. http://researchbriefings.parliament.uk/ResearchBriefing/Summary/SN01079
40 HESA. (2018). HE student enrolments by personal characteristics. Statistical First Release 247. See Figure 4.
https://www.hesa.ac.uk/data-and-analysis/sfr247/figure-4
41 Johnson, J. (2017). Answer to ‘Higher Education: Admissions: Written question – 109016’, November.
https://www.parliament.uk/business/publications/written-questions-answers-statements/written-
question/Commons/2017-10-23/109016
42 Department for Education and Skills Funding Agency. (2017). Further education and skills in England.
SFA/SFR36. 17 November 2016, updated 15 December 2017. London: DfES.
https://assets.publishing.service.gov.uk/government/uploads/system/uploads/attachment_data/file/577119/SFA_
SFR36_2016_Ofqual_Update.pdf
43 Apprenticeship starts had also been previously affected by the introduction of advanced learner loans in 2013-
14, when older apprentices (aged 25 or over) had to take out loans. This policy was reversed in February 2014,
when the Skills Funding Agency stated that apprentices did not have to take out loans, and that those who had
already taken them out did not have to pay them back. See Powell (2018) for more information.
44 Powell, A. (2018). Apprenticeship Statistics: England. House of Commons Library Briefing Paper, Number
06113. https://researchbriefings.parliament.uk/ResearchBriefing/Summary/SN06113
24You can also read