The costs of adaptation in Punakha, Bhutan: Loss and damage associated with changing monsoon patterns - November 2012
←
→
Page content transcription
If your browser does not render page correctly, please read the page content below
The costs of adaptation in Punakha,
Bhutan: Loss and damage associated
with changing monsoon patterns
Norbu Wangdi & Koen Kusters

                         November 2012
The costs of adaptation in Punakha, Bhutan

Contents

    Executive Summary                                                                               4
    1. Introduction                                                                                 7
    2. The research area                                                                           11
    3. Research methods                                                                            16
    4. Livelihoods and vulnerability along the main river                                          18
    5. Loss and damage from changing monsoon patterns                                              24
    6. Loss and damage from the 1994 GLOF                                                          34
    7. Reflections and policy options                                                              37
    8. References                                                                                  41
    Appendices                                                                                     44

Authors

Norbu Wangdi, Ugyen Wangchuck Institute for Conservation and Environment, Bumthang, Bhutan

Koen Kusters, Wereld in Woorden – Global research and reporting, Amsterdam, the Netherlands

                                                                            August 2012
This paper has been prepared in the context of the ‘Loss and Damage in Vulnerable Countries Initiative’, which is part
of the Climate Development Knowledge Network. Responsibility for the content solely lies with the authors.

2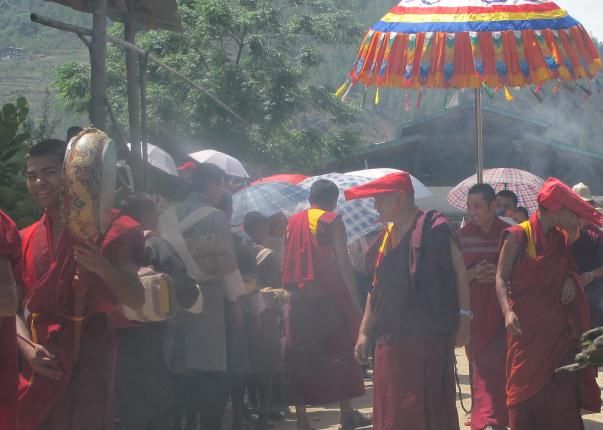
The costs of adaptation in Punakha, Bhutan

Acronyms/abbreviations
    ACPC          The African Climate Policy Centre
    BTN           Bhutan Ngultrum
    CBDRM         Community Based Disaster Risk Management
    CDKN          Climate Development Knowledge Network
    DGM           Department of Geology and Mines
    DoA           Department of Agriculture
    GLOF          Glacial Lake Outburst Flood
    ICCCAD        International Centre for Climate Change and Development
    ICIMOD        International Centre for Integrated Mountain Development
    IPCC          Intergovernmental Panel on Climate Change
    LCAR          Land Cover Assessment Report
    LDCs          Least Developed Countries
    MCII          Munich Climate Insurance Initiative
    MoAF          Ministry of Agriculture and Forests
    NEC           National Environment Commission
    NSB           National Statistics Bureau
    UNECA         United Nations Economic Commission for Africa
    UNU-EHS       United Nations Institute for Environment and Human Security
    UWICE         Ugyen Wangchuck Institute for Conservation and Environment
    WWF           World Wide Fund for Nature

Glossary of Bhutanese Terms
    Ap            Term used to refer to a man
    Aum           Term used to refer to a woman
    Chhu          River
    Chhukor       Water turn/rotation
    Dzong         Administrative centre and the House of the Central Monastic Body
    Dzongchhung   A smaller building in front of the main Dzong
    Dzongkhag     District
    Gewog         Sub-district
    Je Khenpo     Chief Abbot
    Lochhoe       Buddhist ritual
    Soelkha       Buddhist ritual

3
The costs of adaptation in Punakha, Bhutan

                                                          Bhutan, exploring how people are adapting to slow-
Executive Summary                                         onset changes in water availability, their coping
                                                          strategies after extreme events, and the residual
                                                          loss and damage. We used a combination of
Background                                                qualitative and quantitative methods, including a
People in the Himalayan region are confronted with        household survey of 273 households and a wide
changes due to global warming. Glaciers are               range of in-depth individual and group interviews.
melting, leading to changing river flows and an
increased risk of floods (Richardson and Reynolds,        Gradual changes in water availability
2000; IPCC, 2007; NRC, 2012). In addition, several        Most farmers in Punakha district cultivate paddy on
recent studies have been pointing at changing             terraces, which are irrigated using rain-fed streams
rainfall patterns in the region (e.g., Ashfaq et al.,     coming from the mountains. The paddy is planted
2009; Bhutiyani et al., 2010; Macchi et al., 2011).       and harvested during the summer monsoon period,
Although there is much uncertainty about the              when there is enough water in the streams, and the
direction of these changes and their local                water in the irrigation channels is shared among
manifestations, it is expected that altering patterns     households and villages. According to 91% of the
of precipitation will affect local livelihoods,           respondents it has become increasingly difficult to
particularly small-scale farmers. In Bhutan, shifting     access enough water for irrigation over the last two
rainfall patterns will have direct consequences for       decades, because of decreasing and delayed
the majority of the population, as most Bhutanese         monsoon rains. Farmers also mentioned changes in
are subsistence-oriented farmers depending almost         the timing of the summer monsoon rains. These
entirely on the South Asian monsoon rains for the         local perceptions were confirmed by an analysis of
cultivation of rice (NEC, 2011).                          rainfall data between 1990 and 2010 from six
                                                          meteorological stations in the area same district. Of
       Farmers’ measures are not                          all the respondents who indicated that changes in
                                                          water availability negatively affect their crop
       enough to neutralize the                           production, 89% take action in response. The most
       negative effects of                                mentioned measures are: performing dedicated
                                                          Buddhist rituals to request for rain; developing new,
       changing water                                     or modifying existing water-sharing arrangements
       availability and come with                         between households and villages; working on the
                                                          maintenance of irrigation channels to make sure
       extra costs.                                       water is used more efficiently; shifting from irrigated
                                                          to rain-fed crops, for example cultivating maize
                                                          instead of rice in part of the fields; buying irrigation
The research                                              water from upstream villages; and using a gasoline
As changes in water availability may become more          pump to carry water from the main river to the fields
pronounced in the future, and extreme events such         using long hoses.
as floods may occur more frequently, we need to
understand how farmers are adapting to gradual            Eighty-eight per cent of the farmers who take
changes and coping with extreme events. But this          measures indicated that their measures are not
alone is not enough. In both scholarly debates and        enough to neutralize the negative effects of
policy circles it is increasingly acknowledged that       changing water availability. What’s more, the
there are limits to adaptation and coping. It means       measures come with significant extra costs. There
that it is particularly important to pay specific         are several ‘new’ monetary expenses that arise due
attention to those cases where adaptation and             to changes in water availability. The rental of a
coping measures are not successful or associated          water pump, for example, costs approximately
with costs and losses. This has become known as           US$160 per acre per season, while buying the right
‘loss and damage’ from climate-induced changes.           to access irritation water from another village may
At this point, empirical data at the household level is   cost US$70 per acre per season. But there are non-
needed in order to inform decision-making to              monetary costs as well. Sixty per cent of the
address loss and damage for the most vulnerable           respondents mentioning water sharing as an
people in the world. To help fill this knowledge gap,     adaptation measure, indicated that this is
we conducted a case study in Punakha district,            associated with increased tensions between
                                                          households and villages. Several cases of violent

4
The costs of adaptation in Punakha, Bhutan

conflict and vandalism were reported. This may for        neighbours and friends and reduced expenses.
example happen when one village finds out that            Many affected farmers also said they had to look for
another village has broken the water-sharing              additional     income,    for     example    through
arrangement by secretively diverting an irrigation        sharecropping arrangements. For 12% of the
stream to their fields during the night. Another cost     respondents the GLOF caused a permanent loss.
is the time invested in the maintenance of the            These were the farmers who lost part of their
irrigation channels. For a household with one acre        agricultural lands for good, as they got covered with
of paddy fields, maintenance work would normally          a fine layer of river sand and stones, or were
take one or two days in the summer season, while          washed away completely. The government
this can increase to more than fifteen days of work       compensated at least half of them. Today, farmers
when water is scarce. Last but not least, the             are not much concerned with the risk of future
cultivation of non-irrigated crops instead of irrigated   floods. They point at the attempts of the
rice is seldom the preferred option for farmers. Not      government, which has taken several measures
only because rice is the staple food, but also            both to decrease the risk – for example by artificially
because the yields of non-irrigated crops are less        lowering the water level of the Thorthormi glacial
secure and the income per acre can be up to eight         lake – as well as to prepare people for disasters
times lower compared to paddy rice.                       through a national awareness campaign.

The 1994 Glacial Lake Outburst Flood                      Conclusions
To explore people’s coping strategies after an            Small-scale farmers in Punakha district experience
extreme event we focussed on a large flood that           difficulties in accessing sufficient irrigation water to
occurred in 1994 when the dam of a glacial lake           cultivate their paddy fields and have been adopting
burst, resulting in a so-called Glacial Lake Outburst     a variety of measures to deal with this. The
Flood, or GLOF. The 1994 flood is engraved in the         measures, however, are considered insufficient, and
memory of the Bhutanese people, because it                have their own costs. We argue that these costs
destroyed a part of the age-old Punakha Dzong             should not only be conceived in monetary terms, but
(Palace of Great Happiness). When we asked                also in terms of time, social-cohesion and livelihood
respondents about the impact of the flood, this was       security.
usually the first thing mentioned. A relatively small
part (15%) of all the household-heads living within       We argue that, in contrast with extreme events such
300 meters of the main river indicated to be affected     as floods, gradual changes in water availability are
by the GLOF themselves, which is partly due to the        an easily overlooked area for interventions. Efforts
geography of Punakha valley, with sharply inclined        are needed to secure access to water by small-
slopes on both sides of the river. At the household       scale farmers, for example by investing in research
level, the most severe immediate effect of the flood      on, and development of collective and private water-
was the loss of a part of the annual paddy harvest,       services, like water-storages, water pumps and
which was washed away by the flood. To cope with          irrigation systems.
this, affected farmers asked for food or money from

5
The costs of adaptation in Punakha, Bhutan

Acknowledgments
We would like to thank the Ugyen Wangchuck             Change and Development (ICCCAD) and Munich
Institute for Conservation and Environment             Climate Insurance Initiative (MCII). We would like to
(UWICE),      and    the     National   Environment    express our appreciation to the people who helped
Commission Secretariat in Bhutan. We thank the         us with the research in the field, data entry and
United Nation’s University in Bonn, Germany, and       analysis: Chador Zangmo, Sonam Choden, Thinley
particularly Dr. Koko Warner and Dr. Kees van der      Norbu, Tenzin Namgyal, Jinpa Tharchen, Nima
Geest. This study is part of the Loss and Damage in    Phuntsho Gyeltshen, Karma Wangdi, Tshering
Vulnerable Countries Initiative, which was initiated   Nidup, Lungten Tshering, Dechen, Dr. Ellen Cheng
by the Government of Bangladesh, funded by the         and Chhimi Dorji. We are grateful for the extensive
Climate and Development Knowledge Network              reviews received from Dr. Sangay Wangchuk, Dr.
(CDKN), and coordinated by the United Nations          Ken Bauer, Thinley Namgay and Riamsara
Institute for Environment and Human Security           Kuyakanon Knapp. Finally, we thank all the people
(UNU-EHS). Other partners in the consortium are        along the Pho-chhu and Punatsang-chhu rivers that
GermanWatch, the International Centre for Climate      we interviewed for this research.

6
The costs of adaptation in Punakha, Bhutan

                                                        change, such as variation in rainfall patterns,
1. Introduction                                         droughts, floods, glacier retreat, cyclones, sea-level
                                                        rise, salinity intrusion and coastal erosion. The
1.1 Project background                                  Bhutan case study examines both glacial retreat
                                                        and changing rainfall patterns with special attention
Academics and policy makers are increasingly            to impacts on small-scale farmers.
aware that not all impacts of climate change can be
addressed by current mitigation and future              As Loss & Damage is a new concept in climate
adaptation efforts. Vulnerable people in developing     change research, no commonly accepted definition
countries suffer disproportionately from the adverse    is available yet. However, to inform our research
impacts of climate change caused primarily by           questions and methods, we used the following
developed countries. Their capacity to cope with        working definition: Loss and damage refers to
extreme weather events and adapt to slow-onset          adverse effects of climate variability and climate
climatic changes is limited. The impact of climate      change to which people have not been able to cope
change beyond coping and adaptation has come to         or adapt (Warner et al., 2012). This includes inability
be known as 'loss and damage'. In 2010, the 16th        to respond to climate stresses (i.e. the costs of
Conference of the Parties (COP 16) of the United        inaction) and the costs associated with existing
Nations Framework Convention on Climate Change          coping and adaptive strategies. Such costs can be
(UNFCCC), recognized that joint international           economic or monetary, but also social and cultural.
efforts were needed to better understand and            Loss and damage can involve direct costs, but it
address such losses and damages.                        can also involve longer-term effects on the viability
                                                        of livelihoods. The extent to which households,
This report looks at loss and damage associated         communities and societies incur loss and damage
with the adverse effects of extreme events and          from climate change varies according to their level
slow-onset climatic changes in Punakha district,        of vulnerability and resilience. The case studies
Bhutan. It is part of a series of case studies that     recognize that loss and damage is also related to
empirically assess such losses and damages              mitigation as the potential costs of future climate
among people in Africa, Asia and Oceania. These         change depend to a large extent on the intensity of
case studies are part of the Loss and Damage in         climatic disruptions, which depend on mitigation
Vulnerable Countries Initiative, which was initiated    efforts globally.
by the Government of Bangladesh and funded by
the Climate and Development Knowledge Network
(CDKN). The case studies are coordinated by the                Loss and damage refers to
United Nations Institute for Environment and Human
Security (UNU-EHS). Other partners in the
                                                               adverse effects of climate
consortium are GermanWatch, the International                  variability and climate
Centre for Climate Change and Development
(ICCCAD) and Munich Climate Insurance Initiative               change to which people
(MCII). The African Climate Policy Centre (ACPC)               have not been able to cope
of the United Nations Economic Commission for
Africa (UNECA) funded the research in three                    or adapt.
African countries.
                                                        So far, efforts to assess losses and damages from
The case studies aim to support Least Developed         climate change have focussed almost exclusively
Countries (LDCs) in the climate negotiations by         on material damage – usually expressed in
providing scientific data about real-life experiences   quantitative terms – and loss of life or displacement
of loss and damage in vulnerable countries. There       resulting from extreme weather events. By contrast,
are large gaps in our knowledge about the impacts       the case studies in the Loss and Damage in
of climate extremes and slow-onset processes,           Vulnerable Countries Initiative take a people’s
particularly for communities in LDCs that are not       perspective, with ample attention to local
(yet) able to cope with or adapt to such changes.       perceptions and real-life experiences. Moreover,
The case studies take place in eight countries:         they expand the narrow focus on impacts of
Bangladesh, Bhutan, Micronesia, Kenya, the              extreme events to include slow-onset climatic
Gambia, Ethiopia, Burkina Faso and Mozambique.          changes.
These investigate different aspects of climate

7
The costs of adaptation in Punakha, Bhutan
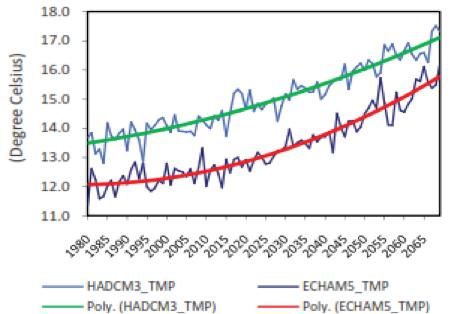
1.2 Climate change in Bhutan Figure 1-1 Trends of annual mean air temperature
(°C) from 1980 to 2069 for Bhutan
Bhutan – the Buddhist Kingdom in the eastern
Himalayas – has little more than 700,000
inhabitants and one of the smallest economies in
the world. With a forest cover of almost 70%, limited
industrialization and a surplus of hydropower
production, the country is absorbing more carbon
than it emits and thus functions as a net sink for
greenhouse gases At the same time, however, the
Bhutanese people are experiencing the
consequences of global warming due to emissions
elsewhere (NEC, 2011).
Much is uncertain about the ways in which global
warming manifests itself in the Himalayas and how
it may impact the various localities in the region
Source: NEC, 2011. Trends according to PRECIS
(NRC, 2012).1 In Bhutan specifically, there is a lack
downscaled HadCM3Q0 and ECHAM5 scenarios.
of historical records of rainfall and temperature.
Reliable data is available for less than two decades.
The melting of glaciers and changing rainfall
An analysis with data from 2000-2009 shows an
patterns due to global warming are expected to
increasing trend for both maximum and minimum
have serious consequences for agricultural
temperatures and no apparent trends in the
production in Bhutan (MoAF, 2011a).2 While arable
precipitation pattern, but the timespan of the
lands cover only three per cent of the total land
analysis is too short to draw strong conclusions
surface, agriculture is the main source of the
(NEC, 2011; MoAF, 2011b). The Second National
livelihoods of about 70% of the population (NSSC,
Communication to the UNFCCC (NEC, 2011)
2010) and climate change will thus have a direct
reports on two climate models, using ECHAM5 and
impact on the majority of the population.3 Changes
HadCM3Q0 A1B scenarios (Figure 1-1). Compared
in the availability of water for agriculture is seen as
to 1980-2009, the mean annual temperature is
the most important threat for agriculture and the
projected to increase by 0.800C to 1.000C in 2010-
Royal Government of Bhutan identified water
2039 and by 2.000C to 2.400C in 2040- 2069 (NEC,
resources availability (in terms of quantity, quality
2011).
and timeliness) as one of the principal climate
pressures on broader human development in
Bhutan (GNHC, 2011). Next to that, climate change
is thought to lead to pest and disease outbreaks
and increased occurrence of landslides. Moreover,
receding glaciers and changing rainfall patterns are
projected to affect the production of hydro energy
(NEC, 2011).
2
In addition to the consequences for the local economy,
impacts are likely to be felt by people in downstream
areas, as the Himalaya mountains form the headwaters
of several of Asia’s major river systems, including the
Ganges, Mekong, Brahmaputra. Yangtze and Yellow
River. Altered river flows due to glacier melt and
changing precipitation can have serious consequences
1
According to a recent study by Shrestha et al. (2012) for roughly 1.5 billion people downstream who use these
the Himalayas have warmed by 1.5°C from 1982 to 2006, rivers as sources of drinking water and irrigation (IPCC,
at an average rate of 0.06°C per year, but with variations 2007; NRC, 2012).
3
in the rate of warming across seasons and ecoregions. Although temperature rise could, in theory, make it
According to the same study, the average annual possible to cultivate crops at higher elevations, Alam and
precipitation- for the whole Himalaya region – has Tshering (2004) argue that this is hardly feasible in
increased by 163 mm during the 25-year period. Bhutan due to the steep slopes at higher altitudes.
8The costs of adaptation in Punakha, Bhutan
In this report we will focus primarily on the impacts Reynolds, 2000). The Bhutanese National
and responses at the household level of small-scale Environment Commission writes: “Bhutan has 677
farmers. Below we will shortly address two main glaciers and 2674 glacial lakes. Glaciers in Bhutan
climate-induced changes with potential effects on are retreating rapidly by 8-10m per year for debris
local livelihoods, i.e., glacial melt, and changing free glaciers and 30-40m per year for debris-
rainfall patterns. covered glaciers. Due to the rapid melting, 25
glacial lakes are considered potentially dangerous
Glacial melt with the threat of glacial lake outburst floods
Himalayan glaciers – covering about three million (GLOFs). Based on rates of glacial retreat,
hectares or 17% of the mountain area – form the temperature trends in the area and trends in GLOFs
largest body of ice outside the polar caps and are in the region, threats from GLOFs are expected to
the source of water for a large number of rivers. increase in the future” (NEC, 2011: 8).
Glacial melt is expected to change the seasonality
of these rivers, e,g, leading to earlier peak flows in GLOFs occurred in 1957, 1960, 1968 and 1994,
spring time, and reduced flows in summer. Overall with varying intensity and damage in the
flows are projected to increase in the short-term, downstream valleys. The one that occurred on 7th
especially in winter and spring times, with higher October 1994, due to a partial burst at the Luggye
chances of flooding. Eventually, however, the Tsho glacial lake located in eastern Lunana, caused
contribution of glacier melt will decrease over the loss of life and property along the Punakha-
longer term, decreasing the overall river flows. This Wangduphodrang valley. This last event triggered
is expected to have negative impacts on the awareness of policy makers and scientists about
downstream irrigated agriculture in most South the risk of future GLOFs in relation to rising water
Asian countries (IPCC, 2007). In this way, according levels in several glacial lakes due to rising
to Stern (2007, cited in IPCC, 2007: 483), glacier temperatures. The National Environment
melt could negatively affect half a billion people. Commission refers to an unpublished study
conducted in 2002 by the Department of Geology
Available meteorological data from the Bhutanese and Mines together with the Institute of Geology of
Department of Energy show that temperatures in the University of Vienna in Austria. The study warns
Bhutan have been increasing over the past that a major GLOF of the Thorthormi Lake could
decades. At higher altitudes, temperatures have occur by 2015, leading to discharge of about 53
increased even more sharply than at lower altitudes million cubic meters (NEC, 2006). The United
(MoAF, 2011a). Based on monitoring results using Nations Development Program and the National
satellite imagery of the Department of Geology and Environment Commission of Bhutan identified
Mines (DGM), Bhutan’s glaciers are receding at a GLOFs as an imminent threat to large areas and
rate of 20-30 meters per annum and according to populations of the country (UNDP-ALM, 2011).
DGM all the glaciers in the Bhutanese Himalaya
could disappear within a few decades. 4 Glacial Changing rainfall patterns
retreat may alter river flows, which could negatively Rainfall patterns in the Himalayan region remain
affect current farming systems, and the possibilities poorly understood, largely because of an
for irrigated farming in the future (DoA, 2011). inadequate meteorological and hydrological
Moreover, glacial melt is leading to the growth of database. Also, fluctuations in precipitation are
supra-glacial lakes. When such glacial lakes highly region-specific – making it difficult to identify
develop behind unstable ice-cored moraines, they general patterns and trends – and at higher
have the potential to burst, leading to devastating altitudes it becomes even more complicated to
floods downstream. This is especially the case understand how various factors such as wind
when increasing temperatures contribute to the direction, air pressure, temperature and moisture
melting and destabilization of ice-cored dams. Such levels interact to deliver rains (NBC, 2011; see also
sudden floods are known as Glacial Lakes Outburst The Economist, 2012). Still, there is evidence that
Floods or GLOFs, in short (Richardson and rainfall patterns in the Himalayas are changing. In a
recent study of four Himalayan areas by Macchi et
4
According to a recent report by the National Research al (2011) farmers indicate that the monsoon rains
Council (USA), Himalayan glaciers are retreating at are increasingly erratic and delayed. Also, the
accelerated rate in the eastern and central regions of the Bhutan National Environment Commission reports
Himalayas, while they seem more stable in the western on drying water sources throughout the country
Himalayas (NRC, 2012). (NEC, 2011). Moreover, the Commission predicts
9The costs of adaptation in Punakha, Bhutan
that rainfall will become more extreme, with more responses to more gradual changes, and coping,
frequent episodes of high rainfall over short periods i.e., short-term responses to unusual events.
and larger differences in rainfall between the
seasons, and that annual precipitation is likely to As the occurrence of GLOFs is likely to increase
increase (NEC, 2011). This last point is contested, (ICIMOD/UNEP, 2000) and the effects of gradual
as several other analyses and models predict an changes in water availability may become more
overall decrease in rainfall in the Himalayas. Based pronounced in the future (e.g., Ashfaq et al., 2009),
on an analysis of available rainfall data between we need to understand how farmers are responding
1866 and 2006, Bhutiyani et al. (2010), for example, to these changes. But this alone is not enough. In
found a statistically significant decreasing trend in both scholarly debates and policy circles it is
monsoon precipitation and overall annual increasingly acknowledged that there are limits to
precipitation. A sophisticated climate model coping and adaptation. This means that it is
developed by Ashfaq et al. (2009) predicts that particularly important to pay specific attention to
climate change will alter the dynamics of the South those cases where responses are not successful
Asian summer monsoon by decreasing summer and/or associated with losses or high costs. Loss
precipitation, delaying the start of the monsoon and damage is a new concept in climate change
season and leading to longer breaks between rainy research and no commonly accepted definition is
periods. Clearly, it is extremely hard to predict how available yet. In this case study we define loss and
climate change will manifest itself in different damage as the negative effects of climate variability
localities within the Himalayan region, as it will and climate change that households have not been
depend on the local topography and microclimate able to cope with or adapt to. At this point, empirical
factors. data at the household level is urgently needed in
order to inform decision-makers to address loss and
Although evidence from meteorological sources is damage for the most vulnerable people. This has
scarce, there are several anecdotal accounts of been the starting point of our research.
changing rainfall patterns in Bhutan (Lhendup, et al,
2011; Macchi et al., 2011, NEC, 2011). According to Through this case study we aim to understand how
a climate change vulnerability assessment of gradual and abrupt changes lead to loss and
biodiversity, livelihoods, and water conducted by the damage, and what combinations of policies can
World Wide Fund for Nature (WWF) and help limiting loss and damage at the household
Wangchuck Centennial Park, local people are level. The study focuses on Punakha district – one
experiencing more erratic rainfall and less snowfall, of the districts affected by the 1994 GLOF. Besides
leading to changing water availability, with negative that, it is one of the most important agricultural
consequences for their agricultural practices areas of Bhutan. While acknowledging that losses
(Lhendup, et al, 2011). Also, increasingly erratic rain and damages are incurred at all scales, we focus
showers will lead to more floods and landslides, exclusively on households. Other consequences,
which can wipe out roads, bridges and farmland e.g., on the generation of hydro-energy, are
(NEC, 2011). therefore outside of the scope of this research.
The central question in this case study is: How do
1.3 Research focus and objectives gradual changes in water availability and sudden
In this study we distinguish between two types of floods (GLOFs) result in loss and damage at the
level of agricultural households in Punakha valley?
climate threats: gradual or slow-onset changes and
extreme or sudden-onset events. Firstly, we will This question will be answered through the following
explore water availability for agriculture, which may set of sub-questions: (i) How did people cope with
be gradually changing as the result of altering the 1994 GLOF and what is the associated loss and
rainfall patterns. Secondly, we explore extreme damage? (ii) What are the local perceptions
events and gradual changes related to the on-going regarding changing water availability in the glacial-
fed river and rain-fed streams? (iii) How do people
retreat of glaciers in the Himalaya, i.e., increased
risk of GLOFs and changes in the flow of glacial-fed adapt to gradual changes in water availability and
rivers. Related to people’s responses, we what is the associated loss and damage? And (iv)
differentiate between adaptation, i.e., long-term what can be done to reduce loss and damage from
climate-induced gradual and abrupt changes?
10The costs of adaptation in Punakha, Bhutan
Box 1-1 Research domains
In order to better understand patterns of loss and damage in Bhutan, we study the following four research
domains:
Climate threats: The two climate threats central in this study are the increased risk of GLOFs and the
changing water availability for agriculture, which are influenced by glacial melt and changing rainfall
patterns. This research uses social science methods to study the impacts of these climate threats. The
question to what extent glacier melt and changing monsoon patterns are caused by anthropogenic
climate change or global warming requires physical science methods and is beyond the scope of this
research.
Societal impacts: In this study we focus on two types of societal impact: (i) The effect of changing water
availability in rivers and streams on crop production and other agricultural activities, and (ii) the effect of
the latest large GLOF in Bhutan, which happened in 1994, on physical properties of households.
Responses: We study how people have coped with the 1994 GLOF and how people have been
adapting to more gradual changes in river and stream flows.
Loss & Damage: Loss and Damage refers to the effects of glacial melt and changing rainfall patterns
that people have not (yet) been able to avoid. This includes: (i) the inability to cope with the 1994
GLOF; (ii) the inability to adapt to changing stream flows; and (iii) costs associated with existing coping
and adaptive strategies.
11The costs of adaptation in Punakha, Bhutan
2. The research area southwards. At Punakha town it merges with the
Mo-chhu River, coming from the northwest. In
Dzongkha, the official language in Bhutan, “Pho”
Punakha district, located in the Punakha- means “male”, “Mo” means “female” and “chhu”
Wangduephodrang valley, is one of the 20 districts means river or “water”. The confluence of the two
of Bhutan (Figure 2-1). The district covers a total rivers is right below the Punakha Dzong, where the
area of 1,108 km2, and consists of 11 sub-districts name of the river changes to Punatsang-chhu. The
(also known as blocks or gewogs). Punakha town, river continues through Dagana and Tsirang
72 kilometres northeast of Thimphu, is the districts in Bhutan after which it enters India (where
administrative centre of the district (NSB, 2010). It it is known at the Sunkosh) and finally joins the
used to be the capital of Bhutan and the seat of Brahmaputra River.
government until 1955, when the capital was moved
to Thimphu. The district is well known for the
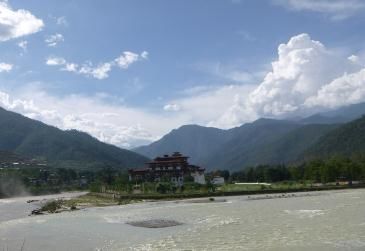
Punakha Dzong 5 , also known as the Palace of Punakha Dzong at the confluence of the Pho-chhu and
Great Happiness, which was built in 1637. The large the Mo-chhu rivers
building contains the district’s administration and is
the winter residence of the Central Monk Body and
its Chief Abbot (Je Khenpo). It is located at the
confluence of the Pho-chhu and Mo-chhu rivers and
during the 1994 GLOF, the Dzongchhung (a smaller
building in front of the main Dzong) was seriously
damaged, reportedly without harming the religious
relics it contained. Work is currently in progress to
protect the building from future flood damage by
deepening the river channels and raising the
embankments.
According to the Punakha District Annual Statistics
of 2011, the district had a population of 17,715
inhabitants and a population density of 18 people
per km2 in 2005. An exact number of the population
in 2011 was not available at the time of study, but is Agriculture
estimated to be around 26,000 people (NSB, 2011). Farmers in Punakha district produce a wide variety
The total forest coverage is about 87,978 hectares, of non-irrigated crops, mostly in the winter months.
consisting mostly of coniferous and broad-leaved These include wheat, mustard, buckwheat,
trees. Twenty-two per cent of the total area of persimmon, guavas, peaches, plums, pears, apples,
Punakha district is cultivable land (NSB, 2010). The chillies, radish, cabbages, green leaved vegetables
lowest point in the valley is about 1,200 meters and tomatoes. The most important crop in the
above sea level, while the highest point is 4,825 district, however, is rice, cultivated on irrigated
meters. Most cultivation takes place below 1,800 terraces (NSB, 2010). Punakha district contains one
meters (Dorji et al., 1990). of Bhutan’s largest contiguous rice cultivation areas.
Small-scale farmers grow rice along the river valleys
The Pho-chhu River of the Pho-chhu, Mo-chhu and Punatsang-chhu in
The Pho-chhu River is one of Bhutan’s major rivers. the summer months, when water from the monsoon
It originates in Gasa district near the border rains is available in the irrigation channels. It is the
between Bhutan and Tibet, from where it flows most important crop in terms of area, production
and employment. Also, rice is the most important
crop for food, cash and barter (Dorji et al., 1990;
5
A Dzong is the religious, military, administrative and NSB, 2010). All rice fields are irrigated. In 2009 the
social centre of a district. Each district has its own Dzong, district had 138 functional government-constructed
and each Dzong is divided in two parts; one part is irrigation channels, with a total length of 413 km and
allocated to the administrative function (the district
the area covered by irrigation was estimated to be
government), and the other part is allocted to the
religious leaders and monks. Most Dzongs in Bhutan
8,155 acres (NSB, 2010).
date from the 17the century and are located at strategic
locations as they also functioned as fortresses.
12The costs of adaptation in Punakha, Bhutan
Figure 2-1 Map of Bhutan showing Punakha district
Figure 2-2 and Figure 2-3 provide data on paddy Figure 2-3 Paddy yields in Punakha district (MT/acre)
production and productivity for Punakha district. The 2,5"
figures suggest that production has been gradually
increasing, mostly due to an increase in productivity 2"
per acre. According to government officials at
Punakha district, the general trend is increasing due
to improved seeds, fertilizers and agricultural 1,5"
intensification.
1"
Figure 2-2 Paddy production in Punakha district
0,5"
2002-2010 (MT)
14000"
0"
2002" 2003" 2004" 2005" 2006" 2007" 2008" 2009" 2010"
12000"
Source: FAO Country-STAT Bhutan, http://www.rnrstat.bt
10000"
8000" In addition to the introduction of better seeds,
fertilizers, and intensification, rainfall levels may
6000" influence agricultural productivity. We therefore
compared the rainfall data from two metrological
4000"
stations with the paddy production data of the two
2000" sub-districts in which these stations are located
(Guma and Shengana) but this yielded no
0" significant relationship.
2002" 2003" 2004" 2005" 2006" 2007" 2008" 2009" 2010"
Source: FAO Country-STAT Bhutan, http://www.rnrstat.bt
13The costs of adaptation in Punakha, Bhutan
collected at the Punakha Dzong meteorological
Climate and changing rainfall station.
The Punakha-Wangduephodrang valley is
characterized by warm summers (from June to Figure 2-4 Annual average rainfall in Punakha and
November), cool winters (from November to June), Wangdue Phodrang districts
and monomodal monsoon-related rainfall. About
75% of the annual rainfall falls in the summer period
(Dorji et al., 1990). Table 2-1 presents the
maximum, minimum and average temperatures per
month in 2010 and the average monthly rainfall for
the same year, recorded at two meteorological
stations in Punakha district – one located at the
Punakha Dzong in Guma sub-district and one
located in Shengana sub-district.
We obtained rainfall data from 1990 up to 2008,
recorded at six meteorological stations: two in
Punakha district (Punakha Dzong and Shengana)
and four in the neighbouring Wangduephodrang
district (Semtengang, Wangdue, Phobjikha and Source: Hydromet Services Department, Ministry of
Nobding). The data shows a decreasing trend Economic Affairs, Thimphu, Bhutan.
(Figure 2-4), which is significant (sig=0.00187).
Punakha Dzong and Shegana recorded the largest
decrease in June, the first month of the monsoon
(Figure 2-5). Finally, Figure 2-6 shows the
difference in rainfall between the 1990s and 2000s
based on the average cumulative daily rainfall
Table 2-1 Temperature and rainfall in Punakha (2010)
Temperature in Punakha district (°C) Monthly rainfall (mm)
Max. Min. Average Punakha Dzong Shengana
January 18 5 12 0 0
February 14 1 8 2 3
March 16 6 11 10 13
April 19 9 14 30 41
May 26 14 20 62 76
June 31 21 26 143 125
July 33 22 27 251 372
August 31 22 27 98 213
September 31 21 26 120 256
October 29 18 24 37 103
November 25 14 20 8 19
December 23 6 15 4 0
Annual 25 14 19 764 1221
Source: NSB, 2011
14The costs of adaptation in Punakha, Bhutan
Figure 2-5 Average rainfall in the 1990’s and 2000’s Figure 2-6 Cumulative rainfall averages of 1990s and
during monsoon months 2000s at Punakha Dzong
Source: Hydromet Services Department, Ministry of
Economic Affairs, Thimphu, Bhutan (analysis by Kees
Source: Hydromet Services Department, Ministry of van der Geest, UN University, 2012).
Economic Affairs, Thimphu, Bhutan.
15The costs of adaptation in Punakha, Bhutan
3. Research methods profound understanding of people’s perceptions,
attitudes, and internal discussions. During two
3.1 A mixed method approach group interviews we asked the participants to
identify the adopted coping strategies in response to
A research team of ten people spent two weeks in the 1994 GLOF and to rank them in order of
Punakha district to gather data in the field. The importance. We organised one focus group
team consisted of a principal investigator, an discussion with just women, focussing explicitly on
international researcher, five enumerators, a note- gender roles in the household economy and the
taker, a practical assistant, a driver and a cook. One differences in vulnerability to (climate-induced)
of the objectives of the study was to research loss changes between men and women.
and damage from the 1994 GLOF, which, according
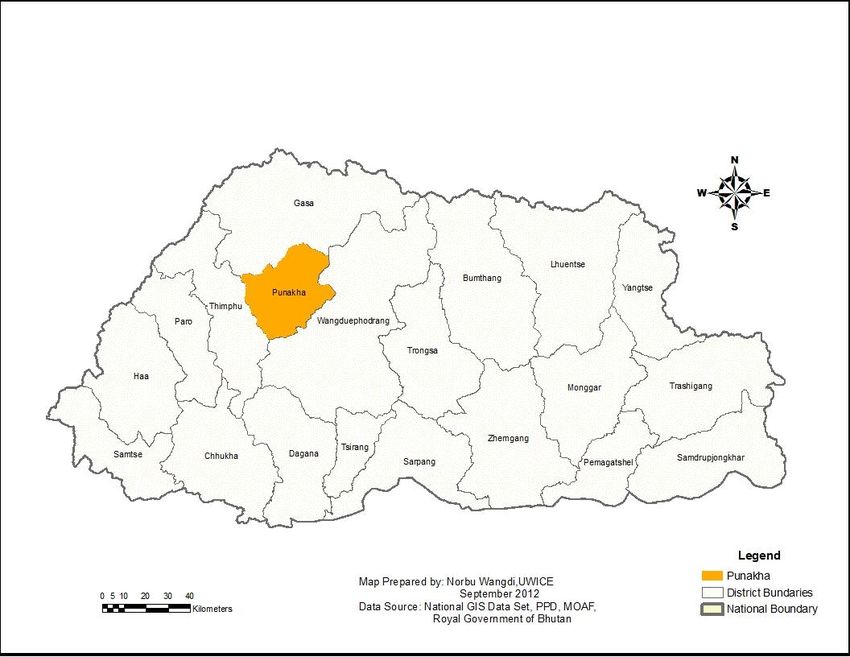
to government officials at the Punakha district In the field, every evening all the questionnaires
administration, had particularly affected households were checked and discussed with the enumerators.
in Dzomi and Toewang sub-districts, located on the This allowed us to learn from the experiences of the
east bank of the Pho-chhu River in Punakha district. enumerators and the stories from the field.
The west bank was said to be much less affected, Information from the survey was followed up in
due to its steep slopes. In an effort to capture a interviews with key informants and we occasionally
sufficient number of households affected by the re-visited survey respondents who seemed to have
flood, we interviewed 100% of the households an interesting story for complementary in-depth
located within 300 meters from the main river in interviews in order to gather extra information,
these two sub-districts – a total of 28 settlements particularly on people’s life histories. At the same
(Table 3-1). In addition, we surveyed 100% of the time information from in-depth interviews was used
households living within 300 meters from the river in to instruct the enumerators.
several neighbouring settlements: seven on the
west bank of the river (Chhubu sub-district), two The simultaneous use of quantitative and qualitative
upstream of Toewang (Lingmukha sub-district), and methods reinforced each other, not only during the
two downstream of Dzomi (Thedtsho sub-district). field research, but also during the analysis of the
data. The qualitative information provided the
Enumerators interviewed the heads of households, necessary insight for a meaningful analysis of the
using a questionnaire that contained both open quantitative data, while we used the survey results
ended and closed questions, divided in four to crosscheck statements by key informants.
sections: (i) respondent and household
characteristics, sources of livelihood and
vulnerability; (ii) impact of and adapting to changes Table 3 – 1 Research Sample
in river and stream flows; (iii) impact of and coping Sub-district Nr of Nr of hh heads
with weather-related extreme events; (iv) settlements interviewed
vulnerability, gender and policy (see Annex 1 for the
full questionnaire). On average, interviews took Thedtsho 2 23
between 40 minutes and one hour.
Dzomi 17 111
In addition to the survey, we conducted 31 in-depth Toewang 14 83
interviews with key informants, namely village Chhubu 7 27
representatives, extension workers, sub-district Lingmukha 2 29
representatives, and government officials at the
district level (see Appendix 2 for list of key Total 42 273
informants). The key informants were selected for
their specific knowledge and/or experience.
We also organised focus group discussions with a
total of 20 men and women of different ages in three
settlements in Lingmukha, Dzomi and Toewang
sub-districts (Appendix 3). The focus group
discussions were meant to generate an open
conversation with and among villagers about the
themes under study, in order to obtain a more
16The costs of adaptation in Punakha, Bhutan
Figure 3-1 Map of the research area production. In the field we soon found that farmers
were using rain-fed streams rather than the main
river for irrigation purposes, and that they were
complaining about decreasing water availability in
their irrigation channels. We then decided to add
new questions to the questionnaire, concerning
these changes in water availability. Without this last-
minute shift of focus, our research would probably
not have yielded useful insights. It shows the
importance of reflecting upon and crosschecking
information while in the field and to allow for
flexibility during the research. As Campbell and
Sayer (2003) argue: Good research, like jazz,
requires improvisation.
The fact we found out that glacier melt was not
Map by Dara Mendeloff, The Earth Institute, Columbia perceived as an immediate threat, while changing
University. monsoon patterns were, provides another important
Note: The dots indicate the administrative villages as lesson. It underlines the importance of a grounded
recorded in the 2005 population census. The 42 understanding of local realities in order to develop
settlements surveyed include the sub-villages. appropriate and effective policies: interventions to
address loss and damage should not be based on
assumptions, but on community consultation.
3.2 Research limitations and lessons
A practical limitation we encountered in the field
was people’s time availability. Our research period
coincided with the paddy-harvesting time, which
meant that all people (men and women) were busy
in the fields – from early in the morning to late in the
evening. Individual farmers were generally willing to
be interviewed, either in the field or at home during
the evenings, but it appeared more difficult to
arrange group interviews during this busy time of
the year.
Interventions to address
loss and damage should
not be based on
assumptions, but on
community consultation.
Due to a tight deadline in combination with long
travel times, the team had not been able to organize
an exploratory visit to Punakha district to conduct a
reconnaissance survey, before the actual survey
would start. In the first days of the fieldwork we
found out that our questionnaire was not catered
well to the local situation. The original questionnaire
focussed solely on (the impacts of) changes
induced by the retreat of glaciers, assuming farmers
would be using the glacial-fed river for agricultural
17The costs of adaptation in Punakha, Bhutan
4. Livelihoods and As Table 4-1 shows, there are many more female
household heads. In the research area it is common
vulnerability along the main for the women to be the head of the household. It is
river the local tradition that the man moves in with the
family of the woman. In terms of decision making at
We interviewed a total of 273 households heads, all the household and community levels there is not
located within 300 meters from the main river. The much differentiation between the sexes. Women
average age of the respondents was 49, and the and men do, however, have specific roles in the
average household consisted of six members. household economy. Men are said to do the tough
Education levels of the heads of households work, like ploughing and preparing the fields.
appeared extremely low, with most of them having Women usually do the rest of the work in the fields,
enjoyed no formal education whatsoever. School like preparing seedlings, planting and weeding.
enrolment among the younger generations is much Women usually take care of household chores and
higher. Table 4-1 summarizes some basic cooking.
characteristics of the interviewed heads of
households.
Table 4-1 Characteristics of respondents
Characteristic Percentage of respondents
Sex Male 37%
Female 63%
Household type Single headed 12%
Married (or double-headed) 88%
Education No education 83%
Entered primary school 11%
Entered secondary school or higher 6%
Religion Buddhist 97%
Hindu 3%
involved in non-farm activities, often in the winter
4.1 Main sources of livelihood season. The non-farm sector is the main source of
Travelling through the research area in the summer cash income in the area (Table 4-2 and Figure 4-1).
months it becomes clear why the area is referred to
Table 4-2 Income-earning activities
as the rice bowl of Bhutan, with rice terraces
Activity N % of Mean annual hh
stretched out on the mountain slopes along the
hh cash income*
main river. The vast majority of the people in the
(BTN) (US$)
area are small-scale, subsistence-oriented farmers,
Crops 247 91% 16,593 301
producing primarily rice and vegetables. In addition,
they often own a small number of livestock and fruit Livestock 219 80% 3,019 55
trees. About 80% of the households indicated that Trees 181 66% 2,126 39
they consume more than half of their agricultural Non-farm 164 60% 45,175 820
production. In general, only agricultural surplus is Remittances 111 41% 11,225 204
sold for cash. The mean annual cash income per
Farm labour** 32 12% 667 12
household is BTN85,664 (US$1,556) 6 . The mean
annual cash income per capita is BTN18,154 Other*** 18 7% 6,800 124
(US$330). More than half of the households are *Means calculated over the survey population (N=273)
**Households that earn cash income with farm labour.
This does not include the households who are engaged
6
Exchange rate BTN1.00 = US$0.0181591. The PPP in labour exchange.
(purchasing power parity) conversion factor in Bhutan ***This category includes renting out houses and
was 0.39 in 2011 (Source: www.tradingeconomics.com). machinery (e.g. tractor, tiller, grinder, chainsaw, pump).
18The costs of adaptation in Punakha, Bhutan
Of the farming households, 94% own (part of) the
Figure 4-1 Mean annual cash income per capita land they cultivate, and 23% are involved in
sharecropping arrangements. About 4% of the
farming households do not own any land
themselves and depend entirely on a sharecropping
or rent arrangement. The average size cultivated
per household is 2.1 acres. Table 4-3 presents the
distribution in the size of lands owned.
Crop cultivation
More than 90% of the people are farmers – virtually
all of whom practice irrigated rice cultivation on
terraces and use either animal traction or a (hired)
hand tractor to plough their fields.7 The terraces are
irrigated using rain-fed streams descending from the
mountains. The rice is planted and harvested during
the summer monsoon period, when there is enough
water in the streams, and the water in the irrigation
channels is shared among households and villages.
In winter the main crops are maize, mustard and
wheat, potato, pumpkin, radish, tomato, bean,
barley, cabbage, eggplant, millet, union and
spinach. Farmers produce for their own
consumption first, and those who have surplus will
sell it. Mean incomes from crop cultivation are
relatively low (compared to non-farm income) but
almost all households engage in subsistence-
oriented farming.
7
Eighteen households do not cultivate crops. Fourteen of
them are specialised in non-farm activities (driver,
teacher, extension officers), while the other four rely
mostly on remittances.
19The costs of adaptation in Punakha, Bhutan
Table 4-3 Land size and income
Land size N % of hh % subsistence- Mean annual Mean annual
category oriented hh within income from income from
category* crop sales crop sales
(BTN) (US$)
0-1 acres 75 30.9% 96% 12,011 218
1-2 acres 84 34.6% 90% 13,232 240
2-6 acres 73 30.0% 82% 24,007 436
6-14 acres 11 4.5% 73% 54,850 996
*At least half of the total agricultural production is consumed by the household.
Farming households take part in a labour exchange illustrates two simultaneous trends influencing
system within the community, which means that agricultural production in the research area, but in
villagers work on each other’s farms (reciprocal opposing ways. Firstly, due to increased access to
labour). Members of 32 households occasionally fertilizers, pesticides and improved seeds – made
work as labourer on other people’s fields for a daily available in the 1990s through extension services
wage, earning on average BTN5,693 (US$103) by the government – people have been able to
annually. improve their production. Secondly, farmers seem
to be dealing with unreliable water availability for
Crop trend their crops, hampering agricultural production. This
All respondents were asked to indicate whether is confirmed by Aum Sangay Om, a female farmer
their crop production changed over the last ten from Khawakha village, who said: “In general,
years (Table 4-4). If they noticed a change, they compared to before, there has been better yields
were also asked to mention the main reason why due to use of fertilizers, better quality seeds and
they think the production is changing (Table 4-5). supported with some machineries. But when
According to just over one-third of the respondents, cultivation is delayed due to the lack of rainfall, the
their crop production increased, while close to one- yields are much lower as they should be” (interview
third indicated a decreasing crop production. on 03-07-2012).
Of the respondents that indicated decreasing crop Table 4-4 Trend in crop production (N=246)
yields, 92% argued that this is primarily caused by Crop trend in last ten years % of hh
changes in (timely) water availability. Other reasons Decrease a lot 2.0%
mentioned are pests and decreasing fertility of the Decrease a little 28.0%
land. Of those with increased crop production, 87
Remain the same 35.4%
per cent said that this has been because of access
to improved technologies like chemical fertilizer and Increase a little 32.1%
pesticides, and improved seeds. Some also Increase a lot 2.4%
explicitly mentioned the assistance of extension
officers and improved traction (cow or tractor). This
Table 4-5 Causes for changes in crop production (N=147)
Decreased production Increased production
Nr (N=76) % Nr (N=71) %
Water 69 92% 0 0%
Pests 2 2% 0 0%
Technology 0 0% 62 87%
Extension services 0 0% 6 9%
Other 5 7% 3 4%
Total 76 100% 71 100%
20The costs of adaptation in Punakha, Bhutan
Livestock and economic trees Table 4-6 Most important non-farm activities
About 75% of the surveyed households own one or Activity Examples % of hh
more cows, with an average of six cows and a Trade Small shop, trade in 7%
maximum of 18 cows per household. Twenty-nine vegetables
per cent of the households have one or more pigs White collar Extension officer, village 8%
(any number up to four), and 44% own some fowls representative, teacher
(five on average). Livestock is primarily used for Blue collar Construction work 18%
own consumption. Cows are used for both traction
and to produce milk and cheese, which are Crafts Carpentry and painting 22%
important ingredients in the Bhutanese kitchen.
Other Truck and taxi drivers, 11%
Surplus milk and cheese is sold, generating a mean
religious services (rituals)
annual income of BTN3,736 (US$68) for those
households with cows.
Remittances
Forty-three per cent of the households own a small
The relative importance of remittances in the
number of economic trees, such as citrus, guavas,
research area (Table 4-2) is explained by the fact
peaches and plums, mostly for own consumption.
that many young people, especially those who have
About half of them occasionally sell surplus tree
enjoyed some education, leave the area in search
products. For households that own trees, the mean
of non-farm jobs in the urban centres. About 41% of
annual cash income from selling tree products is
the interviewed household heads reported income
BTN3,206 (US$58).
from remittances, mostly from the Thimphu/Paro
region (51%) and Bumthang (18%). For the
Non-farm activities
households that receive remittances, the average
The non-farm sector is the most important source of
amount of money received is BTN27,608 (US$501)
cash income in the area (Table 4-6). Farmers often
per year. Next to that, people also receive goods
look for non-farm activities in the lay season, when
from their relatives who work in other parts of the
there is less work on the farm. A large number of
country. People try to return home at least once a
people work as craftsman in the construction and
year, and when they do, they generally bring goods
maintenance of houses, for which the demand is
for their family. The average estimated value of the
high, as the typical Bhutanese house demands a lot
goods brought in by relatives is BTN11,490
of subtle carpentry and painting work. Work in
(US$209) per household per year.
construction of roads is also common. A small
number of households (5%) is fully specialised in
Income diversification
non-farm activities, such as teachers, taxi drivers
As indicated above, most households farm and
and extension officers. 8
have one or two additional income sources – often
temporary work in the non-farm sector and
For the households with non-farm income, the mean
remittances. There is no significant relation between
annual income earned with non-farm activities is
the number of sources of cash income and the
BTN73,926 (US$1,342), but the differences are
mean cash income per capita (Table 4-7).
large, ranging from BTN200 (US$4) for occasionally
helping with painting houses, up to BTN600,000
(US$10,896) for the combination of a shop, a bar
and a taxi business. The mean annual income
earned in white-collar jobs (mostly civil servants and
government officials) and the ‘other’ category
(mostly taxi and truck drivers) is relatively high:
US$2,888 and US$2,224, respectively.
8
Trade in the caterpillar fungus (Cordyceps sinensis) is a
major source of income for farmers at a higher altitude
(Gasa District), but does not exist in Punakha.
21The costs of adaptation in Punakha, Bhutan
Table 4-7 Cash income diversification
Nr of cash sources N % of hh Mean cash income Mean cash income
per capita (BTN) per capita (US$)
0 2 0.7 0 0
1 67 24.5 18,962 344
2 91 33.3 18,299 332
3 75 27.5 19,027 346
4 30 11.0 15,846 288
5 8 2.9 14,674 267
income is not straightforward. As could be
4.2 Housing and household property expected, the poorest households have little or no
Virtually all houses in the research area are built in land and little additional cash income, but wealthier
traditional Bhutanese style. They are typically households do not necessarily have much land.
constructed with rammed earth and whitewashed There are two types of households with a high per
with lime paint. Only six per cent of the houses are capita cash income: (1) those specialized in non-
made of baked bricks. Houses are spacious with farm activities, such as teachers and extension
officers, who have little land, and (2) farm
two or three storeys and with room for livestock and
storage on the ground floor. The doors and windows households with large landholdings.
are made of wood and richly decorated with animal,
We defined three wealth categories, based on the
religious, or floral designs. The use of corrugated
galvanised iron sheets for roofing is widespread ranking of land-size per capita and cash income per
(97%), and all houses, except for some temporary capita (Table 4-8). The dependency ratio is
dwellings, are connected to the national electricity significantly smaller for the high wealth category
grid. Private latrines are common. Only six per cent (ANOVA, sig=0.019), which means that this group is
of the households in the survey depend on surface characterized by a higher number of economically
water for drinking. All the other households have active household members compared to the other
access to a water pipe. two groups.
There is no significant difference between the cash
4.3 Poverty income of female-headed and male-headed
households, but Table 4-9 suggests that the mean
Two important characteristics that help to define the annual per capita cash income of single-headed
livelihood-status in the area are the land size per households (generally widowed or divorced) is
capita, determining how much food one can much lower than that of other households (ANOVA,
produce, and the cash income per capita, sig.=0.095). Of the single-headed households, 85%
determining how much food and other consumer are female-headed.
products one can buy and the productive
investments one can make (e.g., purchasing
fertilizers). The relation between land size and
Table 4-8 Wealth categories (N=270)
% of hh Mean land-size Mean annual cash income Dependency ratio*
per capita (acre) per capita (BTN)
Low 33% 0.24 3,399 1.4082
Medium 34% 0.34 11,390 1.5043
High 33% 0.62 40,002 1.1037
* No. of economically non-active hh members divided by the no. of economically active hh members.
22You can also read