The Dawning of a Golden Decade - May 27, 2020 Compact Version - Ronald-Peter Stöferle & Mark J. Valek - In Gold We Trust
←
→
Page content transcription
If your browser does not render page correctly, please read the page content below

Über uns                                         1

                                    May 27, 2020
                                 Compact Version
                Download the Extended Version (350 Pages) at
                                    www.ingoldwetrust.report

The Dawning
of a Golden
Decade
                          Ronald-Peter Stöferle
                               & Mark J. Valek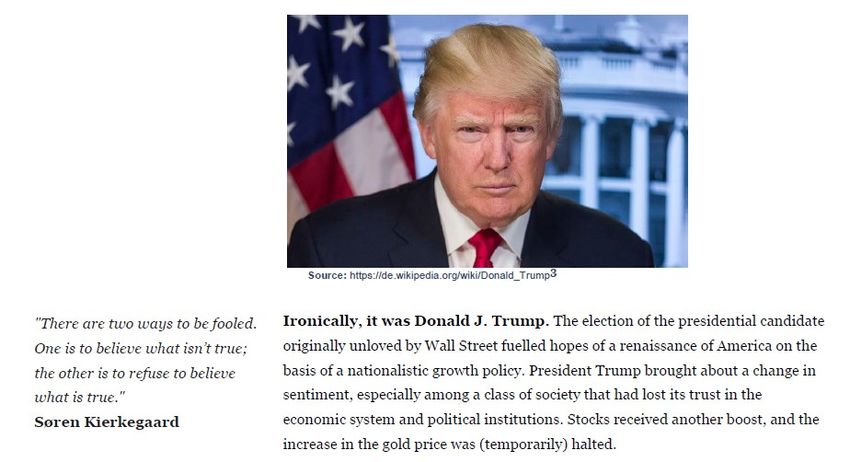
Introduction                                                            2

   We would like to express our profound gratitude
    to our Premium Partners for supporting the
           In Gold We Trust report 2020

Details about our Premium Partners can be found on page 91 and page 92.

                                                           LinkedIn | twitter | #IGWTreport
Introduction                                                                                3

Introduction
“All roads lead to gold.”
Kiril Sokoloff

                      Key Takeaways

                  •   Monetary policy normalization has failed
                      We had formulated the failure of monetary policy normalization as the most likely
                      scenario in our four-year forecast in the In Gold We Trust report 2017. Our gold
                      price target of > USD 1,800 for January 2021 for this scenario is within reach.

                  •   The coronavirus is the accelerant of the overdue
                      recession
                      The debt-driven expansion in the US has been cooling off since the end of 2018.
                      Measured in gold, the US equity market reached its peak more than 18 months ago.
                      The coronavirus and the reactions to it act as a massive accelerant.

                  •   Debt-bearing capacity is reaching its limits
                      The interventions resulting from the pandemic risk are overstretching the debt
                      sustainability of many countries. Government bonds will increasingly be called into
                      question as a safe haven. Gold could take on this role.

                  •   Central banks are in a quandary when it comes to
                      combating inflation in the future
                      Due to overindebtedness, it will not be possible to combat nascent inflation risks
                      with substantial interest rate increases. In the medium-term inflationary
                      environment, silver and mining stocks will also be successful alongside gold.

                  •   Dawn of a new monetary world order
                      In the decade that has just begun, trend-setting monetary and geopolitical
                      upheavals are to be expected. Gold will once again play an important role in the new
                      monetary world order as a stateless reserve currency.

                  •   New gold all-time highs are only a matter of time
                      The question is not whether the gold price will reach new all-time highs, but how
                      high these will be. We are convinced that gold will prove to be a profitable
                      investment over the course of this decade and will provide stability and security in
                      any portfolio.

                                                                           LinkedIn | twitter | #IGWTreport
Introduction                                                                                                       4

Gold is not a story until it's a    This year’s 14th edition of our In Gold We Trust report, titled
story.                              “The Dawning of a Golden Decade”, is being published at the opening
Guy Adami                           of a new decade.1 As the last decade draws to a close, gold has once again
                                    demonstrated its sensitive seventh sense and alerted the keen observer that the
                                    general situation in the financial markets is about to change fundamentally.2 Last
                                    year economic activity cooled off noticeably, and it was only a matter of time before
                                    the long overdue recessionary storm broke. In anticipation of the storm, the
                                    development in calendar year 2019 was superb on a US dollar basis, with a plus of
                                    18.9%, and even more remarkable on a euro basis with 22.7%.

Like the weather, markets are       But even before the storm clouds could thunder and a “conventional recession”
turbulent.                          could occur, the world was confronted with the novel coronavirus and the dramatic
Benoit Mandelbrot                   reactions to it. The economic storm that we are now experiencing is indeed
                                    unprecedented. The pandemic became the trigger and accelerator of the
                                    following fundamental dynamics:

                                     • Economic emergency braking
                                         After a prolonged period of economic expansion, the global economy is
                                         experiencing the most severe recession in over 80 years. The IMF is
                                         forecasting a contraction in global GDP of 3% for the current year, and this
                                         figure is likely to have to be revised downwards.3 The real-time indicator of
                                         the Federal Reserve Bank of New York shows an unprecedented
                                         annualized contraction of US GDP of over 31% for the second quarter.4

                                     • Collapse on the financial markets
We’re only down 15% from the             The economic slump led to a spectacular collapse in financial assets, which
all-time high of February 19, and        had already been valued ambitiously. March 2020 will go down as one of
it seems to me that the world is         the worst months in stock market history. In the first quarter of this year,
more than 15% screwed up.                the market capitalization of the US stock markets, measured by the
Howard Marks,                            Wilshire 5000 Total Market Index, fell by USD 7trn. The “everything
April 20, 2020                           bubble”, which we have been pointing out for years,5 is now in acute
                                         danger of bursting. Central banks have since been trying to prevent further
                                         collapse with seemingly desperate stimulus measures

                                     • Monetary U-turn
                                         The normalization of monetary policy is off the table long before it could
                                         be completed. Quantitative easing is now (again) the norm because of the
                                         prevailing zero interest rate level. The dimensions of the new QE programs
                                         beggar the imagination. At the height of the financial market panic, the
                                         Federal Reserve dished out USD 1mn every single second, day and night,
                                         for two weeks.6 It should be noted that monetary policy had already turned

                                    —
                                    1 All 13 previous issues of the In Gold We Trust report can be found in our archive at
                                    https://ingoldwetrust.report/archive/?lang=en.
                                    2 See Stoeferle, Ronald: “Gold - The 7th Sense Of Financial Markets”, Presentation: Precious Metals Summit,
                                    November 11, 2019
                                    3 See IMF: World Economic Outlook, April 2020: The Great Lockdown, April 2020
                                    4 Nowcasting Report, Federal Reserve Bank of New York, as of May 15, 2020
                                    5 See “Introduction” and “White, Gray and Black Swans“, In Gold We Trust report 2017; “Introduction”, In Gold We
                                    Trust report 2018; “Introduction“ and “The Status Quo of Gold”, In Gold We Trust report 2019
                                    6 It took the Federal Reserve 2 weeks to create USD 1trn. It would take over 31,000 years to count up to this
                                    number, assuming you count one US dollar per second.

                                                                                                               LinkedIn | twitter | #IGWTreport
Introduction                                                                                                    5

                                               around in the second half of 2019 in order to combat the looming
                                               recession early on.

                                           • Fiscal policy crescendo
     Suckers think that you cure               The renewed QE programs in the trillions are now being joined by a highly
     greed with money, addiction               expansive fiscal policy. In 2020 the US is likely to triple last year’s already
     with substances, expert problems          excessive budget deficit of 4.6%. Record debt growth is also expected in
     with experts, banking with                the eurozone. Italy, Greece, Spain and France, already economically
     bankers, economics with                   depressed countries, will be hit particularly hard.
     economists, and debt crises with
     debt spending.                        • The limits of debt sustainability
     Nassim Taleb                              Many households, companies, emerging markets, and even industrial
                                               nations could reach the limits of their debt sustainability as a result of the
                                               devastating economic slump and the numerous government interventions.
                                               According to the latest estimate of the International Monetary Fund
                                               (IMF), the debt of the industrial nations will soar from 105% of GDP in the
                                               last year to over 122% in this calendar year alone.7

                                           • The end of central bank independence: The dramatic debt
                                               developments are increasingly undermining the independence of central
                                               banks. The intertwining of fiscal and monetary policy is progressing
                                               steadily. For example, in April the very traditional Bank of England broke
                                               a fundamental taboo and is now financing the government deficit through
                                               direct government bond purchases.8 In the US, too, central bank circles
                                               are now openly considering the official interlinking of fiscal and monetary
                                               policy.9 All of these are steps that point further in the direction of
                                               implementing the controversial Modern Monetary Theory (MMT).

Source: Federal Reserve Bank of Chicago
                                          These developments have in some cases already built up over years and
                                          decades, but in the current crisis the situation is becoming exorbitantly
                                          worse. As unpleasant as the dynamics in general are, the conditions for
                                          gold could not be better, given massively overindebted economies, which as a
                                          last resort use the devaluation of their currencies to finance their deficits. For
                                          these and a number of other reasons, we take a broad view and foresee
                                          “The Dawning of a Golden Decade”.

                                          But before we begin our analysis of this year’s topics, we would first like to take a
                                          step back to reflect on our past theses.

     Gold is a constant. It’s like the    Looking back on the recent past of the In Gold We Trust report, we find
     North Star.                          that we became optimistic too soon after the gold price slump in 2013.
     Steve Forbes                         By the time the US economy began to slow down in 2015, a recession was already
                                          in the air. Interest rates were still at a low level, even in the USA, and monetary
                                          policy normalization seemed light years away. Our expectation at the time was
                                          that, due to the prevailing low interest rate level, gold would experience a strong

                                          —
                                          7 IMF DataMapper: Gross debt position in % of GDP
                                          8 “Bank of England to directly finance UK government’s extra spending”, Financial Times, April 9, 2020
                                          9 Bianchi, Francesco, Faccini, Renato und Melosi, Leonardo: “Monetary and Fiscal Policies in Times of Large Debt:
                                          Unity is Strength”, Federal Reserve Bank of Chicago, Working Paper No. 2020-13, revised May 11, 2020

                                                                                                                  LinkedIn | twitter | #IGWTreport
Introduction                                                                                              6

                                             appreciation when the coming recession hit. The gold bulls were just beginning to
                                             trot when they were abruptly slowed down again at the end of 2016.

                                                                What had happened? Donald Trump was elected President of
                                                                the United States, and with him a Republican majority in both
                                                                houses of Congress. It was obvious to us that Trump would be a
                                                                determining factor in the price of gold. This required a reevaluation
                                                                of the situation. We therefore made a forecast for the gold
                                                                price in the In Gold We Trust report 2017, which was
                                                                timed to coincide with Donald Trump’s four-year term.10

                                                                Our thesis was that the combination of deficit spending and the
                                                                change of mood among previously disappointed sections of the US
                                                                population would (finally) allow monetary policy to begin to
Source: In Gold We Trust report 2017, p. 7                      normalize. The litmus test for us was whether a “normal” interest
                                                                rate level could be reached or whether the reduction of the Federal
                                             Reserve’s balance sheet could be implemented without choking off the debt-
                                             induced upswing.

                                             We worked out the following four scenarios for the gold price at that
                                             time, with a time horizon of January 2021:

                                                   Term of office is                                          Monetary policy            Gold price
                                                                                      Growth
                                                   characterized by                                            normalization              in USD

                                                            Scenario A:             Real growth                  Successful;
                                                                                                                                         700-1,000
                                                          Genuine Boom               > 3% p.a.           Real interest rate level >1.5

                                                            Scenario B:          Growth & Inflation
                                                                                                                not completed            1,000-1,400
                                                      Muddling Through              1.5-3% p.a.

                                                              Scenario C:        Growth & Inflation
                                                                                                                not completed            1,400-2,300
                                                       Inflationary Boom            > 3% p.a.

                                                            Scenario D:        Growth / Contraction       Normalization paused or
                                                                                                                                         1,800-5,000
                                                       Adverse Scenario
Introduction                                                                                                 7

                                                 (scenario B). This term of office will probably end under the conditions of an ad-
                                                 verse scenario (scenario D), which we have repeatedly classified since 2017 as the
                                                 most probable scenario.

             In order to succeed, you must       The gold price also behaved as we expected in the respective scenarios.
             first survive.                      In the event of a reversal of monetary policy, in 2017 we predicted gold prices of
             Nassim Taleb                        over USD 1,800 by the end of January 2021. This is still likely to be the case.

                                                     Gold in USD, 01/2015-05/2020

                                                 2,000

                                                 1,900
                                                                                      4-year
                                                 1,800                               forecast
                                                                                     IGWT 17
                                                 1,700

                                                 1,600
                                                                         Election of
                                                 1,500                  Donald Trump

                                                 1,400
                                                                                                                                        End of
                                                 1,300
                                                                                                                                         term/
                                                 1,200                                                                                 forecast
                                                                                                                                        period
                                                 1,100

                                                 1,000
                                                      2015          2016         2017          2018         2019          2020          2021         2022

                                                     Source: Reuters Eikon, Incrementum AG

                                                 In retrospect, we are quite satisfied with our assessments of the past
                                                 few years, because the central theses of our past In Gold We Trust reports have
                                                 proved to be true.

             If we winter this one out, we can   Even more exciting than the review is the outlook. In line with this year’s
             summer anywhere.                    leitmotif, “The Dawning of a Golden Decade”, we venture to offer a 10-year outlook
             Seamus Heaney                       for the gold price.14 First, however, we want to deal with the most burning issue at
                                                 present.

                                                 Covid-19 and the prospect of recession
                                                 The international reaction to Covid-19 is largely responsible for the extraordinarily
                                                 severe recession we are facing. But would a recession have occurred even
                                                 without the pandemic? An answer to this counterfactual question is very
                                                 important for the assessment of future developments. We are convinced that
                                                 even without a coronavirus pandemic in 2020, major economies would
                                                 have slid into recession. What leads us to this view? Germany, Italy and
                                                 Japan, for example, were already in recessions or quasi-recessions.

                                                 Most telling for us was the fact that world trade volume, which
                                                 normally grows about 5% per annum or double the rate of the increase

Source: Center for Disease Control and
                                                 in GDP, last year declined by about 0.5%. This marked only the third decline
Prevention (CDC) via AP                          since 1980. The other two declines happened during the deep recessions of 1982
                                                 and 2009.15 So it seems that we had already entered 2020 in a very weak

                                                 —
                                                 14 This can be found as usual in the final chapter “Quo vadis, aurum?”
                                                 15 See Lacy Hunt: “The Road Through Deflation Toward Eventual Hyperinflation”, Macrovoices, April, 30 2020

                                                                                                                        LinkedIn | twitter | #IGWTreport
Introduction                                                                                                                  8

                                condition, which leads us to think that the US would have entered a
                                recession even without Covid-19. We would like to underpin this thesis at this
                                point with some charts on the US economy.

The Fed can change how things   An inversion of the yield curve has always been considered one of the
look, but not how things are.   most reliable leading indicators for recessions. As early as 2019, the
Jim Grant                       proportion of yield curve inversions was already considerable, massively indicating
                                an approaching recession. According to this indicator, a recession would not have
                                been unlikely by mid-2020.

                                   Recession probability within the next 12 months, 01/1985-04/2021

                                   50%

                                   40%

                                   30%

                                   20%

                                   10%

                                      0%
                                        1985           1990          1995          2000         2005             2010          2015           2020

                                                                   Recession                           Recession probability
                                      Source: Federal Reserve NY, Incrementum AG

                                The Dow/gold ratio is also of great interest to us, as an unsustainable
                                equity rally is sometimes sniffed out by a strongly rising gold price.
                                According to the Dow/gold ratio, share prices had already peaked at the end of
                                2018. Since then, shares measured in gold have been on a clear downward trend.
                                The long-term chart clearly shows the potential fall in share prices expressed in
         Courtesy of Hedgeye    gold.

                                   Dow/Gold ratio (log), 01/1800-04/2020
                                100                                                                                                       Gold low
                                                                                             1913                    Gold low            Stocks high
                                                                                                  Gold low          Stocks high
                                                      Gold standard era                          Stocks high

                                 10

                                                  Gold low
                                                 Stocks high
                                                                                                    Gold high
                                  1                                                                 Stocks low
                                                                                                                                Gold high                 ?
                                                                                                                                Stocks low
                                                                    Gold high
                                                      Gold high     Stocks low                                                 Fiat money era
                                                      Stocks low
                                  0
                                   1800        1820     1840       1860     1880      1900      1920      1940          1960      1980       2000      2020

                                                                                          Dow/Gold ratio
                                      Source: Nick Laird, goldchartsrus.com, Reuters Eikon, Incrementum AG

                                However, the most convincing evidence for the approaching recession
                                is the U-turn in US monetary policy. In 2017/2018 the Federal Reserve
                                continuously communicated its intention that monetary policy normalization
                                would be carried out, come what may. As recently as December 2018, Jerome

                                                                                                             LinkedIn | twitter | #IGWTreport
Introduction                                                                                                      9

                                  Powell said that the reduction in the Federal Reserve’s balance sheet was still “on
                                  autopilot”.16 Only a few days later, he rowed back this statement, in view of the
                                  massive correction in stock markets. For the first time since 2008, the Federal
                                  Reserve finally cut the key interest rate on July 31, 2019, with two further interest
                                  rate cuts to follow in 2019.

My friends keep telling me the    In autumn 2019, the quantitative tightening of the balance sheet was
Fed shot its gun and is out of    stopped. The Federal Reserve began to expand its balance sheet again, initially
bullets. Are you kidding me?      with the aim of keeping the rise in short-term interest rates in check. These
They own the bullet factory.      measures were taken long before the outbreak of the coronavirus and testify to the
Harris Kupperman                  fact that economic momentum had already weakened significantly by 2019.

                                      Federal Reserve balance sheet (lhs), in USD bn, and Federal funds
                                      rate (rhs), in %, 01/2003-05/2020
                                   10,000                                                                                                     7

                                                                                                                                              6
                                      8,000
                                                                                                                                              5

                                      6,000
                                                                                                                                              4

                                                                                                                                              3
                                      4,000

                                                                                                                                              2
                                      2,000
                                                                                                                                              1

                                         0                                                                                                    0
                                          2003      2005       2007      2009       2011       2013      2015       2017       2019
                                                   Recession                                           Fed balance sheet
                                                   Fed balance sheet (projection)                      Federal funds rate
                                       Source: Reuters Eikon, Incrementum AG

This scheme essentially merges    Why is the question of whether the recession would have occurred
the Fed and Treasury into one     even without the coronavirus so relevant? Ben Bernanke had always argued
organization.                     that the Federal Reserve’s bond purchases were not government financing through
Jim Bianco                        the printing press, as the increased bond holdings were to be held only
                                  temporarily by the Federal Reserve:

                                       “The (FOMC) has often stated its intention to return the Fed balance sheet to
                                       normal, pre-crisis levels over time. Once that occurs, the Treasury will be left
                                       with just as much debt held by the public as before the Fed took any of these
                                       actions.’ When that happens, it will be clear that the Fed has not been using
                                       money creation as a permanent source for financing government spending.”17

The highly abnormal is becoming   Between 2008 and 2015 the Federal Reserve’s balance sheet total
uncomfortably normal. … There     increased from USD 0.9trn to 4.5trn. Only a fraction of this increase was
is something vaguely troubling    repaid in the course of the economic cycle. After the first round of Federal Reserve
when the unthinkable becomes      measures to combat the catastrophic economic effects of Covid-19, the balance
routine.                          sheet total currently stands at a breathtaking USD 7trn. In reality, the exact
Claudio Borio, BIS                opposite of Ben Bernanke’s statement is true: The balance sheet inflation is
                                  permanent and is therefore government financing through the printing press.

                                  —
                                  16 See “Treasury Yields fall as Fed’s Powell says balance sheet reduction on auto pilot”, Reuters, December 19,
                                  2018
                                  17 “In-Depth: Is the Fed Monetizing Government Debt?”, Federal Reserve Bank of St. Louis, April 1, 2013

                                                                                                           LinkedIn | twitter | #IGWTreport
Introduction                                                                                                   10

                                         CB flows yoy (lhs), in USD bn, and S&P 500 yoy% (rhs), 01/2004-
                                         04/2020
                                    5,000

                                    4,000

                                    3,000

                                    2,000

                                    1,000

                                          0

                                   -1,000
                                         2004          2006      2008          2010     2012          2014      2016      2018          2020

                                                               Fed                BoJ                 ECB               Total
                                         Source: Reuters Eikon, Incrementum AG

                                   Have the industrial nations fallen prey to QE addiction?
If my answers frighten you,        In our view, the occurrence of another recession even before monetary policy
Vincent, then you should cease     normalization confirms that the “medicine” of unconventional monetary policy is
asking scary questions.            at best paused but can no longer be stopped. QE is now conventional
Pulp Fiction                       monetary policy, part of the new normal, and the (indirect) financing
                                   of the state budget via the electronic printing press is the new
                                   permanent state of affairs.

                                      Federal debt as % of GDP, 1790-2030
                                   120                                                                                                 108
                                                                                                        106
                                                                                                                                             98
                                   100

                                    80

                                    60

                                    40

                                    20

                                     0
                                      1790      1810    1830   1850     1870     1890   1910   1930      1950   1970   1990     2010     2030
                                                                        Federal debt as % of GDP
                                                                        March 2020 CBO forecast through 2030
                                                                        April 2020 CBO forecast through 2021
                                         Source: CBO, Incrementum AG

Gold has stood the test of time,   There is unanimity among governments and central banks on how to
providing a stable store of        combat the economic consequences of the Covid-19 crisis: As many
wealth to mankind for millennia.   people as possible should be saved, whatever the cost. Après nous le
And as we look to an               déluge – the level of debt no longer matters. The combination of an unprecedented
increasingly uncertain future,     economic collapse and soaring debt levels is explosive. The debt is now threatening
with fiat currencies across the    to get out of hand for good. After the Covid-19 crisis, a worsening debt
globe under siege from rising      crisis looms. It will probably no longer be possible to finance the debt, as global
debt levels, it remains the only   savings volumes are no longer sufficient to cover the financing requirements
money guaranteed to survive.       necessary to keep the electronic printing press up and running.
Grant Williams

                                                                                                        LinkedIn | twitter | #IGWTreport
Introduction 11
The central banks are not only playing along with the governments’
debt game, they are actively encouraging it. In the case of the eurozone,
Madame Lagarde calls for a “common European fiscal response”, which should be
“swift, sizeable and symmetrical”.18 Yet through their actions, central banks are
putting the last remnants of their independence at risk. Neel Kashkari, president of
the Federal Reserve Bank of Minneapolis, recently answered the question of
whether the Federal Reserve would simply print money on the TV show 60
Minutes:
Credit: Wikipedia “That’s literally what Congress has told us to do. That’s the authority that
they have given us, to print money and provide liquidity into the financial
system. And that’s how we do it. We create it electronically. And then we can
also print it with the Treasury Department, print it so that you can get money
outta your ATM.”19
Money printer go Brrr
The realization that the central bank money supply will only know one
direction will also affect the highest good of an uncovered fiat
currency: confidence. In addition to system-critical gold bugs, an increasing
number of fiat-money critics can also be found within the younger generation,
most of whom reach this insight by studying cryptocurrencies. As
the new QE programs are rolled out, these youthful citizens of the
world are taking to social media to hold the overseers of monetary
policy responsible. With the implementation of the new QE
programs, memes,20 fun homepages,21 and YouTube videos have
appeared online in the USA around the slogan “Money Printer Go
Brrr”. Critics of the current monetary system are still in the
minority. However, a world dominated by permanent money
printing should increase the popularity of this critical view in the
Source: Money Printer Go Brrr (the original!), YouTube coming years. In addition, even more radical measures
such as the implementation of MMT, helicopter money,
increased financial repression measures such as cash restrictions, and
low negative interest rates can be expected in the course of the next few
years.
The Great Monetary Inflation
The extent of the central bank measures is not only of concern to a critical minority
of consumers. Assorted investment legends have also been unable to hide their
concerns about the ginormous QE programs. For example, hedge fund luminary
Paul Tudor Jones has drawn attention in his latest report, entitled “The Great
Monetary Inflation”. He states that he is extremely critical of monetary policy and
Courtesy of Hedgeye
therefore bullish on gold:
“The depth and magnitude of the economic drop-off took modern monetary
theory – or the direct monetization of massive fiscal spending – from the
—
18 “Lagarde urges eurozone to launch joint fiscal stimulus”, Financial Times, May 8, 2020
19 “Coronavirus and the economy: Best and worst-case scenarios from Minneapolis Fed president”, CBS News,
March 22, 2020
20 Know Your Meme: Money Printer Go Brrr
21 brrr.money
LinkedIn | twitter | #IGWTreportIntroduction 12
theoretical to practice without any debate. It has happened globally with such
speed that even a market veteran like myself was left speechless.”22
I think Gold will go substantially In addition, Jones has a positive view of Bitcoin as a hedge against the incoming
higher. monetary tsunami because of the high convexity. The topic of Bitcoin is also close
Paul Tudor Jones to our hearts, which is why we regularly cover it in our In Gold We Trust reports,
also this year. Recently, we also started offering a fund strategy for
professional investors that invests in both physical gold and Bitcoin.23
Where does the money flow to?
It’s important to highlight that It is very possible that experimental monetary policy will trigger a
both periods of extremely renaissance of hard assets. If that thesis is correct, the battered commodity
depressed commodities prices sector should also offer opportunities to courageous contrarian investors. Relative
(1970 and 2000), were to the Dow Jones index, commodities are currently trading at the lowest valuation
accompanied by overvalued level since the mid-1960s. Compared to equities, commodities were undervalued to
equity markets and related a similar extent only before Black Thursday on October 24, 1929 and during the
investment bubbles – a situation exaggerations of the dotcom bubble.
that exists once again today.
Leigh Goehring & Adam GSCI/DJIA ratio, 01/1900-04/2020
Rozencwajg 1.2
1.0
Commodities radically overvalued
0.8
0.6
Median: 0.46
0.4
0.2
Commodities radically undervalued
0.0
1900 1910 1920 1930 1940 1950 1960 1970 1980 1990 2000 2010 2020
GSCI/DJIA ratio
Source: Goehring & Rozencwajg, Reuters Eikon, Incrementum AG
Let us take a closer look at the two phases in which commodities were so favorably
valued compared to equities, at the onset of commodity bull markets. What both
phases have in common is that they were preceded by massive monetary inflation.
The parallels of the decade changes around 1970 and 2000 to the
current situation are astonishing. Each time before, an expansive monetary
policy had fed a period of bullish stock markets. What the Nifty Fifty were in the
1960s, the dotcoms were in the 1990s and the FAANG stocks are now. Could
history now repeat itself? After 1970 and 2000, a decade of commodities began in
each case. In the past 10 years we have experienced the most expansive and
experimental monetary policy in history, but it has only peripherally reached the
commodity markets.
—
22 Jones, Paul T. and Giorgianni, Lorenzo: “The Great Monetary Inflation”, Market Outlook – Macro Perspective,
May 2020
23 Further information can be found at www.noninflatable.com.
LinkedIn | twitter | #IGWTreportIntroduction 13
Fiat system goes critical
It takes 20 years to build a With the dawn of the new decade, the world will become increasingly
reputation and five minutes to interventionist. In keeping with the motto “Once your worldly reputation is in
ruin it. If you think about that, tatters, the opinion of others hardly matters”, all the barriers to new debt are now
you'll do things differently. being breached. Debt no longer plays a role, and zero interest rates and money
Warren Buffett supply expansion remain the order of the day as far as the eye can see.
The mixed situation at the beginning of this decade holds the possibility that the
world monetary order that has existed for almost half a century may be
fundamentally unhinged. This is the conclusion reached by an increasing number
of analysts working for traditional banks. Deutsche Bank, for example, writes in its
outlook for the year 2030 that our monetary system could start to totter before the
end of the decade:
“The forces that have held the current fiat system together now look fragile,
and they could unravel in the 2020s. If so, that will start to lead to a backlash
against fiat money, and demand for alternative currencies such as gold or
crypto could soar.”24
Gold is the anchor of trust for the Savers and investors will find it increasingly difficult to navigate their
financial system. If the whole assets safely through the coming times. While the world is threatened by a
system collapses, the gold stock flood of fiat currencies, safe havens are scarce. Gold could also increasingly
can serve as a basis to build it up compete with bonds in an era of negative interest rates. The conditions for
again. investing in gold could not be better. While we do not know what the level of debt
De Nederlandsche Bank or the money supply will be at the end of the decade, in the case of gold or even
Bitcoin, it is quite likely that there will be a relative shortage.
Historically, permanent central bank-financed debt has always led to rising
inflation rates. In addition, silver and mining stocks are good investments for
inflationary scenarios. Both assets have been rather shunned by traditional
investors in recent years and are still relatively cheap. Therefore, we are devoting a
chapter to silver and silver mining stocks in this year’s In Gold We Trust report.
Silver, HUI and S&P 500, indexed 30.01.2009 = 100, 01/2009-
05/2020
450
400
350
300
250
200
150
100
50
0
2009 2010 2011 2012 2013 2014 2015 2016 2017 2018 2019 2020
S&P 500 HUI Silver
Source: Reuters Eikon, Incrementum AG
—
24 Reid, Jim: “The end of fiat money?”, in: “Imagine 2030 - The decade ahead”, db research, December 4, 2019,
p.10
LinkedIn | twitter | #IGWTreportIntroduction 14
Our claim has always been to provide a holistic analysis of the financial
markets. Ultimately, our approach differs from that of other gold analysts in that
we aim to capture the longer-term big picture as comprehensively as possible.
Year after year, the In Gold We Trust report strives to be the most recognized,
widely read, and comprehensive analysis of gold in the world. This would not be
possible without the fantastic help of our entire team of more than 20 people and
especially without the support of our Premium Partners25, to whom we would like
to express our gratitude and sincere thanks.
Learn from yesterday, live for True to Prof. Einstein’s words (on the left), we will continue to do our
today, hope for tomorrow. The best to provide you, dear readers, with a comprehensive, informative,
important thing is not to stop and entertaining guide to gold investments and the factors influencing
questioning. it.
Albert Einstein
Now we invite you to our annual tour de force and hope that you enjoy reading our
14th In Gold We Trust report, “The Dawning of a Golden Decade”, as much as we
enjoyed writing it.
Cordially,
Ronald-Peter Stöferle and Mark J. Valek
—
25 At the end of the In Gold We Trust report you will find an overview of our Premium Partners, including a brief
description of the companies.
LinkedIn | twitter | #IGWTreportÜber uns 15
The Status Quo of Gold
“Realize that everything is connected to
everything else.”
Leonardo Da Vinci
Key Takeaways
• Gold has recently reached new all-time highs in almost
all currencies. With regard to the US dollar, the question
is not whether an all-time high will be reached, but
rather when.
• While liquidity worries and the fear that too little money
would be printed still dominated in 2008, the Covid-19
recession/depression is likely to lead to a contrary
market assessment.
• We are convinced that we are now close to a fork in the
road: Disinflationary pressures will (have to) be broken.
Inflationary forces will prevail. We assume that inflation
will be the dominant investment theme in the coming
years.
• Central banks and institutional investors in particular
will generate greater demand for gold.
• Rising price inflation coupled with a fading post-
coronavirus economy is the “perfect storm” for gold.
• The expansion of the money supply, the negative real
interest environment, and the disproportionate growth
of debt have further increased the fragility of the global
system.The Status Quo of Gold 16
When the traveler goes alone he As in previous years, we begin our long journey through the gold
gets acquainted with himself. universe in this year’s In Gold We Trust report with a detailed analysis
Liberty Hyde Bailey of the most important influencing factors. Especially in times of upheaval, a
comprehensive assessment of the situation is important. This applies to everyone
personally, as well as to the macroeconomic overall picture. At least three reference
points are needed to determine a position; and with each additional reference
point, the position can be determined with increasing accuracy. Therefore, on the
following pages we want to analyze the status quo of gold from as many
perspectives as possible.
It requires a very unusual mind In contrast to the majority of gold analysts, we do not consider the
to make an analysis of the exclusive analysis of supply/demand statistics to be very helpful for
obvious. assessing gold price development. Gold is a stock commodity and a
Alfred North Whitehead monetary metal.26 As such, the decisive short and medium-term factors that
ultimately affect price developments are closely related to the current situa-
tion of the monetary system and financial markets. In our analysis we
therefore focus primarily on the following factors:
• Trend of the US dollar and other fiat currencies
• Opportunity costs (shares, bonds, ...)
• Trend in commodity prices
• Inflation trend and inflation expectations
• Level and trend of real interest rates
• Credit spreads (as an indicator of economic confidence and credit growth)
• Dynamics of the debt situation
• Trends and momentum of monetary growth
• Confidence in central bank policy and the stability of the financial system and
economic development
• Confidence in politics and fiscal stability
• Geopolitical environment
• Technical setup (positioning, sentiment, ...)
—
26 See “Stock-to-Flow Ratio as the Most Important Reason for Gold’s Monetary Importance”, In Gold We Trust report
2013; “The Stock-to-Flow Ratio as the Most Significant Reason for Gold’s Monetary Importance”, In Gold We Trust
report 2014; “Gold and Inflation”, In Gold We Trust report 2015
LinkedIn | twitter | #IGWTreportThe Status Quo of Gold 17
Status Quo of Gold in the Currency Context
“Scarcity is the fundamental starting point of all
economics, and its most important implication is
the notion that everything has an opportunity
cost.”
Saifedean Ammous
Traditionally, we start our assessment by looking at the most
important performance data. Over the past 12 months, gold has reached new
all-time highs in almost all currencies, including EUR, JPY, CHF, CNY, AUD, CAD,
GBP, etc. The “market breadth” of the uptrend was therefore excellent.
What’s past is prologue. The development in calendar year 2019 was superb on a US dollar
William Shakespeare basis, with a plus of 18.9%, and even more remarkable on a euro basis
with 22.7%. Let us now look at the gold price development since the last In Gold
We Trust report in USD and in EUR. We see that three weeks after the publication
of the last In Gold We Trust report on May 28, 2019, the gold price successfully
jumped above the resistance zone at USD 1,360-1,380.27 Subsequently, the
impulsive move we had expected to see to just under USD 1,600 set in before the
price consolidated in the autumn.
Gold in USD & EUR, 1 year performance
1,800
IGWT 2019
1,700
1,600
1,500
1,400
1,300
1,200
1,100
05/2019 07/2019 09/2019 11/2019 01/2020 03/2020 05/2020
Gold in USD Gold in EUR
Source: Reuters Eikon, Incrementum AG
Since the outbreak of the coronavirus crisis and the epochal monetary
and fiscal stimuli associated with it, even hard-boiled gold bulls have
been surprised by the vehemence of the rally, even though gold also had a
good run during the March stock market sell-off.
If we look at recent developments, it seems that many investors have
been disappointed and unsettled by gold’s performance during the
—
27 However, it would be too much to attribute this breakthrough to our prediction alone.
LinkedIn | twitter | #IGWTreportThe Status Quo of Gold 18
initial Covid-19 crash phase. In our opinion, the following factors were the
main reasons for the weaker performance in the short term:28
• Stress liquidity: Gold is a highly liquid asset, with an average of USD
260 billion in gold contracts traded each day. During situations of stress in
financial markets, gold can be liquidated quickly and at low cost. When
volatility rises to extreme levels, selling pressure sets in, as can be seen
from the following chart. In such exceptional situations, one of gold’s great
strengths – its ability to liquidate quickly into fiat currencies almost
anywhere in the world – translates into temporary losses.
• Profit-taking: Gold rallied in the first trading weeks of 2020 and on
March 9 – just before the sell-off – was already up 7% on the year. Profit-
taking then occurred.
• The selling pressure came primarily from the derivatives
market: The net long position on the COMEX was at a record high before
the sell-off. Between March 9 and March 19, trading volumes amounted to
almost 5 million futures contracts. On the other hand, there were massive
inflows on the physical demand side and also in ETFs.
• Real interest rate development: Crash phases are always deflationary,
i.e. real interest rates rise due to imploding inflation expectations, which
naturally means headwinds for the gold price.
In 2008 the high in the VIX (CBOE Volatility Index) at 80 points
corresponded to the lows in gold. A similar situation occurred in 2020, when
the VIX reached a high of 82.7 on March 16 and gold saw its intraday low at
USD 1,455.
Gold, in USD (lhs), and VIX (rhs), crisis comparison 2008 vs. 2020
130 80
70
120
60
110 50
40
100
30
20
90
10
80 0
0 50 100 150 200 250 300
Number of trading days
Gold 2008 Gold 2020 VIX 2008 VIX 2020
Source: Reuters Eikon, Incrementum AG
After that, gold and mining stocks recovered more quickly than stocks and other
risk assets in general. By the time the S&P 500 hit its low of 2,237 on March 23,
2020, gold had already risen USD 100 from its lows. As we have formulated in
previous years, gold usually trades weaker at the beginning of a crash, for the
—
28 See also “Investment Update: Gold prices swing as markets sell off”, World Gold Council, March 19, 2020
LinkedIn | twitter | #IGWTreportThe Status Quo of Gold 19
reasons mentioned above. It is fiscal and monetary measures that boost
the gold price again only a short time later.
Bear markets have three stages – Now the question arises: Has the danger in markets already been
sharp down, reflexive rebound averted? Have central bankers and politicians once again bailed us
and a drawn-out fundamental out? Will the financial and real economy soon return to “business as
downtrend. usual”? The loyal reader probably already suspects that a healthy dose
Bob Farrell, Rule #8 of skepticism is in order, because historically market crashes occur in three
phases:
1. Initial panic selling ✓
2. Relief rally from the low point, aka “dead cat bounce”29 ✓
3. Demoralizing retest of the panic low as disastrous corporate and
economic news is released. But the market no longer falls below the
initial panic lows.
After these three crash phases, it seems not completely implausible that the
markets will test their lows again and the VIX will snap up once more. This was the
case in 2008/2009, when the VIX reached almost 90 during trading on 24 October
2008. Then, on the 20th November, after a sharp interim fall, the VIX rose above
80 again, which, if the pattern repeats in 2020, could mean some
headwind for the gold price.
The biggest misconception about But let us now turn to the “market breadth” of gold, i.e. the
gold is that it’s no longer money. development in different currencies. This analysis helps us to understand
The idea that a bureaucrat, a how solid the upward trend is. The world gold price, which represents the gold
president, could say in 1971 that price in the trade-weighted external value of the US dollar, has successively
gold’s not money and therefore it marked new all-time highs and is currently quoted at 2,500. The divergence
isn’t. After 4,000 years, that the between the gold price in US dollars and the world gold price is a good indication
bureaucrats control money, is an of the strength of the US dollar, which has been dominant since the end of 2012. In
absurdity to anyone who studied view of the extremely strong rise in the world gold price recently, it
history and understands seems that a consolidation is now likely.
economics.
Daniel Oliver
—
29 See Wikipedia entry: “Dead Cat Bounce”: “The term is a metaphor in the financial markets. It describes the
unsustainable recovery after a strong, usually prolonged, slump. The term is derived from the cynical saying: ‘Even a
dead cat will bounce if it is dropped from high enough!” So after a short ascent the course continues to collapse.”
LinkedIn | twitter | #IGWTreportThe Status Quo of Gold 20
Gold in USD, and world gold price, 01/2008-05/2020
2,500
2,250
2,000
1,750
1,500
1,250
1,000
750
500
2008 2010 2012 2014 2016 2018 2020
Gold in USD World gold price
Source: Reuters Eikon, Incrementum AG
Now we want to break down the currency spectrum even further and look at the
gold price in the major currencies. The full year 2019 was clearly positive for
gold in all currencies, with an average of 18.3%. The performance in this
secular bull market remains impressive. The average annual performance from
2001 to 2020 is 10.30%. During this period, gold was able – despite
significant corrections – to clearly outperform practically every other
asset class and, above all, every other currency. Since the beginning of
2020, the performance has been stellar.
Gold performance since 2001 in various currencies (%)
EUR USD GBP AUD CAD CNY JPY CHF INR Average
2001 8.1% 2.5% 5.4% 11.3% 8.8% 2.5% 17.4% 5.0% 5.8% 7.4%
2002 5.9% 24.7% 12.7% 13.5% 23.7% 24.8% 13.0% 3.9% 24.0% 16.2%
2003 -0.5% 19.6% 7.9% -10.5% -2.2% 19.5% 7.9% 7.0% 13.5% 6.9%
2004 -2.7% 5.3% -2.3% 1.8% -1.9% 5.3% 0.7% -3.4% 0.6% 0.5%
2005 36.8% 20.0% 33.0% 28.9% 15.4% 17.0% 37.6% 37.8% 24.2% 26.1%
2006 10.6% 23.0% 8.1% 13.7% 23.0% 19.1% 24.3% 14.1% 20.9% 17.2%
2007 18.4% 30.9% 29.2% 18.3% 12.1% 22.3% 22.9% 21.7% 16.5% 21.7%
2008 10.5% 5.6% 43.2% 31.3% 30.1% -2.4% -14.4% -0.1% 28.8% 15.5%
2009 20.7% 23.4% 12.7% -3.0% 5.9% 23.6% 26.8% 20.1% 19.3% 16.5%
2010 38.8% 29.5% 34.3% 13.5% 22.3% 24.9% 13.0% 16.7% 23.7% 25.2%
2011 14.2% 10.1% 10.5% 10.2% 13.5% 5.9% 4.5% 11.2% 31.1% 11.2%
2012 4.9% 7.0% 2.2% 5.4% 4.3% 6.2% 20.7% 4.2% 10.3% 7.5%
2013 -31.2% -28.3% -29.4% -16.2% -23.0% -30.2% -12.8% -30.1% -18.7% -24.1%
2014 12.1% -1.5% 5.0% 7.7% 7.9% 1.2% 12.3% 9.9% 0.8% 6.2%
2015 -0.3% -10.4% -5.2% 0.4% 7.5% -6.2% -10.1% -9.9% -5.9% -3.8%
2016 12.4% 9.1% 30.2% 10.5% 5.9% 16.8% 5.8% 10.8% 11.9% 12.3%
2017 -1.0% 13.6% 3.2% 4.6% 6.0% 6.4% 8.9% 8.1% 6.4% 6.3%
2018 2.7% -2.1% 3.8% 8.5% 6.3% 3.5% -4.7% -1.2% 6.6% 2.6%
2019 22.7% 18.9% 14.2% 19.3% 13.0% 20.3% 17.7% 17.1% 21.6% 18.3%
2020 ytd 17.6% 14.3% 24.4% 22.7% 23.0% 17.0% 13.2% 14.8% 22.0% 18.7%
Average 9.7% 10.7% 12.0% 9.5% 10.0% 9.7% 10.1% 7.8% 13.0% 10.3%
Source: Goldprice.org, Incrementum AG, figures as of May 22, 2020
LinkedIn | twitter | #IGWTreportThe Status Quo of Gold 21
If we now look at the gold price development in the 7 most important currencies,
we can observe that only on the basis of the US dollar the highs from 2011-2013
have so far not been exceeded.
Gold performance in major currencies, indexed 01/2009 = 100,
01/2009-05/2020
240
220
200
180
160
140
120
100
80
2009 2010 2011 2012 2013 2014 2015 2016 2017 2018 2019 2020
JPY EUR GBP CAD CNY USD CHF
Source: Reuters Eikon, Incrementum AG
Gold has worked down from But let us now turn back even further in the history books. Since 15
Alexander's time... When August 1971 – the beginning of this new monetary era – the average
something holds good for two annual increase in the price of gold in US dollars has been 10.1%. The
thousand years, I do not believe inflation-adjusted appreciation of gold against the US dollar is 6.1% per year on
it can be so because of prejudice average. The chart below impressively demonstrates that the regular accumulation
or mistaken theory. of gold (“gold saving”), taking advantage of the cost-average effect, is advisable.
Bernard Baruch Average annual gold price (log, lhs), in USD, and Gold yoy% (rhs),
1970-2020
10,000 100%
80%
60%
1,000
40%
20%
100
0%
-20%
10 -40%
1970 1975 1980 1985 1990 1995 2000 2005 2010 2015 2020
Average annual gold price Gold yoy%
Source: Reuters Eikon, Incrementum AG
If we look at the gold price development in different currencies and over decades,
we see that the performance diverges significantly. The 1970s in particular, and to
a lesser extent the 2000s, can be described as golden decades. If you look at the
development of real interest rates in the US dollar, this performance makes perfect
sense. The 1970s were characterised by negative real interest rates as a result of
high inflation. The dynamics changed dramatically in the early 1980s. While zero
interest rates were reached for the first time at the end of the 2000s, the relatively
low rate of inflation in the 2010s did not cause real interest rates to fall further,
although nominal interest rates remained at their lowest levels.
LinkedIn | twitter | #IGWTreportThe Status Quo of Gold 22
2010-
Gold Yields 1971-1980 1980-1990 1990-2000 2000-2010
today
USD 1,268% -22% -28% 281% 39%
EUR 1,256% -3% -15% 168% 80%
GBP 1,275% 9% -28% 281% 84%
CHF 1,098% -24% -26% 148% 32%
JPY 1,219% -53% -49% 246% 59%
AUD 1,269% 7% -18% 179% 85%
CAD 1,282% -23% -10% 177% 75%
INR 1,274% 30% 33% 313% 114%
RUB 1,296% -17% 30% 306% 209%
ZAR 1,251% 142% 73% 357% 189%
CNY 1,204% 155% 26% 214% 46%
TRY 1,358% 74% 71% 939% 442%
BRL 1,360% -24% 72% 278% 232%
ARS 1,356% 68% -29% 1,370% 1,930%
Source: Bloomberg, Michael Nicoletos, Incrementum AG
Conclusion
Last year we drew the following interim conclusion:
“Whether viewed in EUR or USD, it seems that the price of gold is slowly
creeping up, on the quiet and far from any attention from the media or the
wider investment community. The fact that gold is already trading at new
all-time highs in some currencies confirms this theory.”30
Currencies don’t float, they just Our forecast, or rather our conclusion from last year, that gold was in a new bull
sink at different rates. market, has come true. The strength of the trend was accentuated even further last
Clyde Harrison year, which is why we assume that new all-time highs will soon be reached in US
dollar terms. For us it is obvious that the gold price – against any currency – is
about to enter a golden decade, i.e. the purchasing power of EUR, USD, etc.
measured in gold will continue to fall.
Milligram gold per USD & EUR, 01/1999-05/2020
120
100
80 -83%
-84%
60
40
20
0
1999 2002 2005 2008 2011 2014 2017 2020
Milligram gold per USD Milligram gold per EUR
Source: Reuters Eikon, Incrementum AG
—
30 See “The Status Quo of Gold”, In Gold We Trust report 2019
LinkedIn | twitter | #IGWTreportThe Status Quo of Gold 23
Status Quo of the US Dollar and the US
Economy
“The cycle of manias and panics results from
procyclical changes in the supply of credit …
Money always seems free in manias.”
Charles Kindleberger
When we recall the recessions of recent years, the Anna Karenina
principle comes to mind.31 Leo Tolstoy noted in his epoch-making novel:
“All happy families are alike; each unhappy family is unhappy in its own
way.”
While many factors, such as sexual attraction, finances, child rearing, religion, and
relationships with in-laws and friends must all go well to make possible a happy
family life, it is enough for one of these factors not to be positive for unhappiness
to prevail.
In general terms:
• Success requires many positive factors, all of which must be interlinked.
• For failure, only one negative factor is needed.32
A recession is when you have to The situation is similar with recessions. While upswings are usually
tighten your belt; depression is similar, every economic downturn has its own characteristics. In the
when you have no belt to tighten. 1930s it was deflation, which in turn had its origins in the inflationary Roaring
When you’ve lost your trousers – Twenties; in the oil crises it was the politically motivated supply shock combined
you’re in the airline business. with double-digit inflation and interest rates in the USA; in 1999/2000 it was the
Adam Thomson dotcom mania; in 2008/2009 the subprime crisis with its devastating
consequences for the banking sector; and now finally the coronavirus recession.
But all crises had their origins in too-expansive monetary policy in the
run-up to them, which fired up too wild a party. Just as a lack of
alcohol brings the party to an abrupt end, so the withdrawal of liquidity
and rising interest rates will mark the end of the stock market party.
Black Swan or Gray Rhino?
In recent weeks, countless experts have described the Covid-19 pandemic as a
black swan. But it seems that the wrong animal metaphor is being applied here.33
—
31 “Wie Privatanleger eine drohende Rezession erkennen” (“How private investors recognize an impending
recession”), NZZ, August 14, 2019
32 See Wikipedia entry: “Anna Karenina principle”
33 World Gold Forum: “Keynote Speech – Ronald-Peter Stoeferle: ‘Gold in 2019: A New Bull Market Forming?’”,
YouTube, May 1, 2019
LinkedIn | twitter | #IGWTreportThe Status Quo of Gold 24
We issued our warning that, The term black swan was coined by Nassim Taleb. With it he describes an
effectively, you should kill it in event that comes completely unexpectedly and exerts a great influence. The events
the egg. … Governments did not of 11 September 2001, for example, were a typical black swan.34 The current
want to spend pennies in pandemic is not a black swan, in Taleb’s eyes. After all, governments have had
January; now they are going to sufficient warning and enough time to prepare for the outbreak of a pandemic.35
spend trillions. Countries such as Taiwan, South Korea, and Hongkong had taken the necessary
Nassim Taleb precautions and adopted early containment measures, in large measure thanks to
the experience gained from the 2002/2003 SARS pandemic. So far, success has
proved them right.
There is no vaccine against If we stick to Taleb’s original concept, the correct metaphor for the
stupidity. coronavirus crisis is that of a “gray rhino”. A gray rhino event is very likely
Albert Einstein and has enormous consequences, but the responsible actors have systematically
underestimated the threat. The term was coined by policy analyst Michele Wucker,
who published the book The Gray Rhino: How to Recognize and Act on the
Obvious Dangers We Ignore after the Greek financial crisis of 2012.36
So the Covid-19 pandemic is not the black swan. The reaction of politicians
and central banks and the downstream consequences for the real economy,
companies, prosperity, society, and financial markets; that is the black swan.
Historically the inversion of the The prediction of the final drop that causes the barrel to overflow is
yield curve has been a good sign known to be complex. However, it was evident that the barrel was filled
of economic downturns, but this to the brim. In previous years, we have often referred to the increasing fragility
time it may not. of the global economy and to specific risk factors.
Ben Bernanke
Percentage of US yield curve inversions, 01/1970-02/2020
100%
80% ?
60%
40%
20%
0%
1970 1975 1980 1985 1990 1995 2000 2005 2010 2015 2020
Recession Percentage of US yield curve inversions
Source: Tavi Costa, Crescat Capital LLC, Incrementum AG
Our economic pessimism was based primarily on the interest rate structure, which,
as is well known, has the best track record in terms of recession forecasts. The yield
curve has once again impressively demonstrated this forecasting ability, even
though in the course of the inversion numerous reasons were given as to why “this
—
34 A detailed explanation of Taleb’s concept of the black swan can be found in “Gold in the Context of Portfolio
Diversification”, In Gold We Trust report 2016
35 See “Systemic Risk of Pandemic via Novel Pathogens – Coronavirus: A Note”, Joseph Norman, Yaneer Bar-Yam,
Nassim Nicholas Taleb, January 26, 2020
36 Wucker, Michele: “The Gray Rhino: How to Recognize and Act on the Obvious Dangers We Ignore”, 2016
LinkedIn | twitter | #IGWTreportThe Status Quo of Gold 25
time is different”. History is known to be the best teacher for the most
inattentive students.
The only function of economic Last year we also pointed out that of the 87 analysts surveyed by
forecasting is to make astrology Bloomberg, not a single one (!) expected GDP to contract in 2019,
look respectable. 2020, or 2021. The expected growth in these three years averaged between 1.8%
John Kenneth Galbraith and 2.4%. This may be ascribed to herd mentality but also to structural problems
(career risk). For 2020, the 96 analysts surveyed forecast an average economic
downturn of 4.2% for the USA. According to the analysts, US GDP will recover
again in 2021 and increase by 3.9% on average. However, the unusually wide range
of estimates shows that there is still a great deal of uncertainty in the market and
that the current economic situation is difficult to assess, with the result that the
forecast growth figures have to be revised almost weekly – usually downwards.
Smoothed distribution of annual US GDP growth projections
made by 96 analysts, GDP growth (x-axis), in %, and number of
analysts (y-axis), 2020 & 2021
20
15
10
5
0
-12 -9 -6 -3 0 3 6 9 12 15
2020 2021
Source: Bloomberg, Incrementum AG
Mises’s solution follows logically But let us now take a closer look at the phenomenon of recession.
from his warnings. You can’t fix Where does the recession phobia actually come from? Actually, the evil
what’s broken by breaking it “R-word” should be allowed to take place. We see recessions as
again. Stop the credit gavage. something healthy and necessary. The downturn corrects the mistakes and
Stop inflation. Don’t encourage excesses of the upswing. In the process, encrusted structures in the labour market
consumption, but rather break down, labour costs fall, and productivity and competitiveness generally
encourage saving and the increase. Misallocations are corrected; unprofitable investments are stopped,
repayment of debt. written off, or liquidated; and mismanaged governments are voted out of office.
Mark Spitznagel Investors and entrepreneurs who act too riskily and are overleveraged suffer
losses, and goods prices are adjusted to actual consumer preferences. According to
our analogy of monetary tectonics,37 one could also say that smaller quakes
prevent larger quakes because they reduce tensions. Similarly, recessions reduce
imbalances.
Fighting depression through This also means, however, that these adjustment processes become all
forced credit expansion is like the more unpleasant the longer you delay them and the more you try to
trying to heal an evil by its own stem them through fiscal and monetary policy interventions. In a
causes. democratic system there is a real political danger that a painful adjustment process
Friedrich August von Hayek cannot be allowed to take place because the interventions have previously been too
—
37 See “Gold and Inflation”, In Gold We Trust report 2014; “Gold and Inflation”, In Gold We Trust report 2015
LinkedIn | twitter | #IGWTreportThe Status Quo of Gold 26
extreme and the adjustment processes will therefore take too long to bear fruit. No
democratic government which, at the next election, gets the receipt for the obvious
successes and failures during its term of office, will voluntarily allow a deep,
cleansing recession, even if it believes that the adjustment processes are necessary.
The performance of gold in recessions
In view of the current horrific economic news, the question arises
whether we are facing even worse or whether the worst is already
behind us. In the In Gold We Trust report 2019, we examined the performance of
gold in recessions in detail and explained why gold is an excellent equity diversifier
and recession hedge.38 An important reason for gold’s good performance in
recessions is that gold discounts the typically implemented fiscal and monetary
policy measures early on.
So let’s now take a closer look at gold and equity performance during
recessions.39,40 Readers of the In Gold We Trust report know that gold, as an
event hedge or safe haven, should perform well during recessions. In the table
below we look at all recessions in the US since 1970, breaking each one
down into four phases:
• Phase 1: Pre-recession phase (one quarter before the recession)
• Phase 2: Unofficial recession (entry into recession until the official
announcement of GDP growth figures by the statistical authorities;
assumption: one quarter)
• Phase 3: Official recession
• Phase 4: Final phase of the recession (last quarter of the recession)
Performance: S&P 500 and gold, in USD and EUR, in %, 1970-2020
S&P 500 Gold in USD Gold in EUR
Duration of the Phase Phase
Phase 1 Phase 2 Phase 3 Phase 4 Phase 1 Phase 2 Phase 3 Phase 4 Phase 1 Phase 3
recession 2 4
1st recession Q1/1970 – Q4/1970 -1.8% -4.6% -7.0% 7.0% -8.9% -6.6% 0.0% 5.9% N/A 4.6% 11.1% 3.0%
2nd recession Q1/1974 – Q1/1975 -8.0% 0.3% -15.0% 16.6% -10.9% 58.5% 89.7% -1.1% 7.2% 51.8% 51.0% -6.2%
3rd recession Q2/1980 – Q3/1980 7.1% -2.1% 7.7% 10.0% 70.1% -22.8% -5.9% 21.8% 27.5% 0.5% 20.2% -1.6%
4th recession Q4/1981 – Q4/1982 -7.4% 2.9% 12.8% 15.9% -14.6% 0.8% 1.2% 14.2% 2.6% -4.8% 21.0% 10.4%
5th recession Q4/1990 – Q1/1991 -10.7% -0.1% 13.8% 13.9% 7.1% -3.3% -7.9% -4.7% 4.6% -9.3% -12.2% -3.6%
6th recession Q2/2001 – Q4/2001 -5.7% 1.3% -8.1% 0.5% -1.5% 3.8% 5.4% 1.3% -0.8% 8.3% 5.5% -4.4%
7th recession Q1/2008 – Q2/2009 0.5% -10.2% -50.4% -18.0% 21.6% 14.3% 16.3% 24.0% 2.2% 12.2% 31.4% 19.8%
8th recession Q2/2020- 1.2% 8.5% -9.3% 4.5% 3.1% 12.1% 9.0% 0.2% 16.0%
Average: -3.1% -0.5% -6.9% 6.6% 8.4% 6.0% 13.9% 8.8% 7.5% 7.9% 18.0% 2.5%
Source: Federal Reserve St. Louis, Investing.com, World Gold Council, Incrementum AG
If we look at performance over the entire recession cycle, it is striking
that gold has seen significant price increases on average in both USD
and EUR at every stage. By contrast, equities (S&P 500) were only able to make
significant gains in the final phase of the recession. Thus, gold was able to
compensate very well for the stock losses in phases 1, 2 and 3.
Furthermore, it is noticeable that on average gold performed the stronger the
—
38 See “Portfolio Characteristics: Gold as Equity Diversifier in Recessions”, In Gold We Trust report 2019
39 The data are based on the recessions for the USA, determined by the NBER.
40 See “Gold in a Context of Portfolio Diversification”, In Gold We Trust report 2015; “Gold in a Context of Portfolio
Diversification”, In Gold We Trust report 2016; “The Portfolio Characteristics of Gold”, In Gold We Trust report 2017
LinkedIn | twitter | #IGWTreportYou can also read