The effect of policies for filling school principal positions on school management in Brazil
←
→
Page content transcription
If your browser does not render page correctly, please read the page content below
The effect of policies for filling school principal positions on
school management in Brazil
Bruno Sendra de Assis ¹
Nelson Marconi ¹
¹ Fundação Getulio Vargas / Escola de Administração de Empresas de São Paulo, São Paulo / SP – Brazil

         Leadership by a school principal is one of the key factors for ensuring an educational environment conducive to
         the teaching-learning process. Nevertheless, only a handful of studies have analyzed the determinants of principals’
         performance. This study evaluated the potential effect of principal selection policies on teacher perceptions of principal
         leadership and school climate. The factors were created based on responses to the National Basic Education Assessment
         System (Sistema Nacional de Avaliação da Educação Básica - Saeb) contextual questionnaires applied in 2013 and
         2015. The legislation for filling school principal positions in the 26 states and the Federal District was also analyzed.
         The results showed a statistically significant difference between the group of schools that carried out “civil service
         examination only” and “selection process and election” compared to the group that adopted the “appointment only”
         modality. However, the high variation observed in the climate and leadership coefficients between the federative entities
         reveals that the local context affects teacher perceptions of these variables. This demonstrates that in addition to the
         selection process, it is important to consider each locality’s characteristics to select professionals with competencies
         and skills appropriate to the position’s challenges, which may contribute to better educational outcomes for students.
         Keywords: educational policies; school management; filling school principal positions; leadership; school climate.

Efeito das políticas de provimento ao cargo de diretor na gestão escolar
         A liderança do diretor escolar constitui um dos fatores centrais para garantir um ambiente educacional adequado ao
         processo de ensino-aprendizagem. No entanto, ainda há poucos estudos que analisam os determinantes da atuação do
         diretor. O presente estudo avaliou o potencial efeito das políticas de seleção de diretores sobre a percepção do corpo
         docente em relação à liderança e ao clima escolar. Os fatores foram criados a partir das respostas aos questionários
         de contexto aplicados do Sistema Nacional de Avaliação da Educação Básica (Saeb) de 2013 e de 2015. Também
         foram analisadas as legislações de provimento ao cargo de diretor nos 26 estados e no Distrito Federal. Os resultados
         apontaram uma diferença estatisticamente significante entre o grupo de escolas que realizou o “concurso público
         apenas” e o “processo seletivo e eleição”, em relação ao grupo que adotou a modalidade de “indicação apenas”. Todavia, a
         alta variação observada nos coeficientes de clima e de liderança entre os entes federados evidencia que o contexto local
         afeta a percepção do corpo docente sobre estas variáveis. Isso demonstra que, além do processo seletivo, é importante
         considerar as características de cada localidade para a seleção dos profissionais com as competências e as habilidades
         apropriadas aos desafios do cargo, que possam vir a contribuir com melhores resultados educacionais dos estudantes.
         Palavras-chave: políticas educacionais; gestão escolar; provimento ao cargo de diretor; liderança; clima escolar.

Efecto de las políticas de selección de directores en la gestión escolar en Brasil
         El liderazgo del director escolar es uno de los factores centrales para asegurar un ambiente educativo apropiado
         al proceso de enseñanza-aprendizaje. Sin embargo, aún son pocos los estudios que analizan los determinantes del
         desempeño del director. El presente estudio evaluó el efecto potencial de las políticas de selección de directores
         sobre la percepción del profesorado en relación con el liderazgo y el clima escolar. Los factores se crearon a partir
         de las respuestas a los cuestionarios contextuales aplicados por el Sistema Nacional de Evaluación de la Educación
         Básica (Saeb) de 2013 y 2015. También se analizó la legislación que reglamenta el cargo de director en los 26 estados
         brasileños y el Distrito Federal. Los resultados mostraron una diferencia estadísticamente significativa entre el grupo
         de escuelas que realizó el “concurso público” y el “proceso de selección y elección”, en relación con el grupo que
         adoptó la modalidad de “nominación política”. Sin embargo, la alta variación observada en los coeficientes de clima
         y liderazgo entre las entidades federativas evidencia que el contexto local afecta la percepción del cuerpo docente
         sobre estas variables. Por lo tanto, además del proceso de selección, es importante considerar las características
         de cada localidad para la selección de profesionales con las competencias y habilidades adecuadas a los desafíos
         del puesto, que pueden contribuir a mejores resultados educativos para los estudiantes.
         Palabras clave: políticas educativas; gestión escolar; selección de directores; liderazgo; clima escolar.

DOI: http://dx.doi.org/10.1590/0034-761220190470                                                                          ISSN: 1982-3134
Article received on December 18, 2019 and accepted on February 06, 2021.
[Translated version] Note: All quotes in English translated by this article’s translator.

                     BRAZILIAN JOURNAL OF PUBLIC ADMINISTRATION           |   Rio de Janeiro 55(4): 881-922, July - Aug. 2021

                                                                       881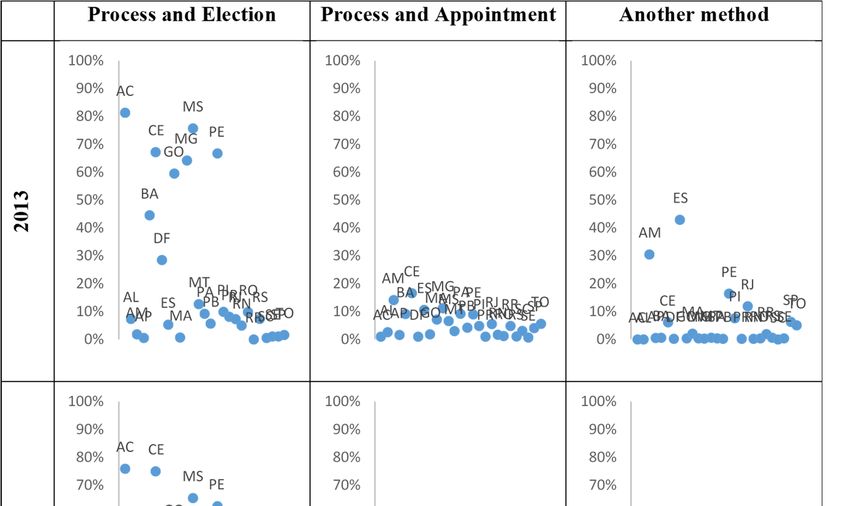
RAP   |   The effect of policies for filling school principal positions on school management in Brazil

ACKNOWLEDGMENTS
We are grateful for comments from Joyce Soares Rodrigues Petrus, Paula Baptista Jorge Louzano and
Pedro Feliú Ribeiro, which were essential to the development of this article.

1. INTRODUCTION
The objective of this study is to analyze whether the different principal selection modalities at state
public basic education schools affect teacher perceptions of principal leadership and the school
climate where they work. Both are considered key factors of effective schools, in order to ensure an
educational environment conducive to cooperation and pedagogical goals (Abrucio, 2010; Alves &
Franco, 2008; Teddlie & Reynolds, 2000). The selection process was chosen as the object of analysis
because it makes it possible — when it is well designed — to identify whether candidates have the
competencies and skills necessary to perform such a complex role. Microdata was obtained from
National Basic Education Assessment System (Sistema Nacional de Avaliação da Educação Básica
- Saeb) contextual questionnaires applied in 2013 and 2015, and the legislation for filling principal
positions in the 26 states and the Federal District was also consulted.
    The method used to create the principal leadership and school climate factors was Samejima’s
(1969) Item Response Theory (IRT), adapting the constructs developed by Oliveira and Waldhelm
(2016). The related questions on the Saeb were consolidated into one indicator for leadership and
another for school climate, which represent the average teacher perception per school. Next, a multiple
linear regression model (Wooldridge, 2011) was applied to determine whether “the method for filling
principal positions is associated with teacher perceptions of principal leadership and school climate”.
The effect observed in the two models confirmed the study’s initial hypothesis: there is a difference
in perceptions of leadership and climate between schools that adopted different principal selection
modalities.
     In the analysis of the legal frameworks for filling principal positions, it was possible to observe
which modalities are regulated by each Federated Unit (FU) as well as their correspondence with
the spontaneous responses on the Saeb questionnaires. A great disparity was found between the
formulation (evaluated through legislation) and implementation processes (evaluated through
microdata) of these policies in each locality, particularly due to the high incidence of the “appointment
only” criterion, even though other selection methods have been regulated. Furthermore, the two
analysis models suggest that adopting technical and/or participatory criteria for school principal
selection enhances the perception of leadership and climate, consistent with the provisions of the
National Education Plan of Brazil (Plano Nacional de Educação - PNE) (PNE, 2014). In the following
section, the theoretical framework will be presented, with an emphasis on the conceptions of school
management, leadership, climate, principal selection, and the relationship between those variables.
Next, the methodological procedures of the document research and the two models developed for
principal leadership and school climate will be described, followed by an analysis of the results and
conclusions about the object of study.

               BRAZILIAN JOURNAL OF PUBLIC ADMINISTRATION                     |   Rio de Janeiro 55(4): 881-922, July - Aug. 2021

                                                                          882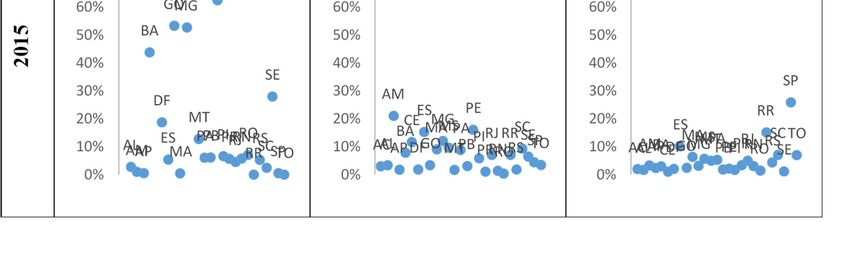
RAP   |   The effect of policies for filling school principal positions on school management in Brazil

2. THEORETICAL FRAMEWORK
Principals play a significant role in both learning and the educational environment (Abrucio, 2010).
Although academic performance is the central criterion of school quality, it is vital that the management
model acts to improve the organizational process as a whole, creating favorable conditions for all the
actors in this system. The British and American literature use the concept of School Effectiveness
Research to identify the factors associated with better academic outcomes for students, including
internal school policies and practices (Soares, 2004). To this end, according to Alves and Franco
(2008), it is necessary to control for the external influence of the socioeconomic and cultural level of
their families, including the educational path (age/grade mismatch) and the type of school in which
they studied (public or private).
    The importance of principal background to achieving good learning outcomes has been
evident since the earliest studies on school effects (Teddlie & Reynolds, 2000). As mentioned in the
introduction, we consider two important aspects of that background in our analysis in this article:
leadership and its influence on school climate. Accordingly, we will now discuss studies that analyze
the effect of the principal selection process on learning outcomes and, subsequently, the relationship
between the selection modality chosen and teacher perceptions of leadership and school climate,
with the latter as the focus of our study.

2.1 The relationship between the principal selection process and school performance
To justify the relevance of this study, we will begin the theoretical discussion by presenting a number
of articles that have analyzed the relationship between the methods for filling principal positions and
school performance. Oliveira and Carvalho (2015) argue that the high incidence of the “appointment
only” principal selection criterion is part of the Brazilian patrimonial tradition and runs the risk
of disregarding educational or management skills. In their analyses, this modality accounted for
approximately 20% of the negative change in the mathematics scores of 5th year students on three
editions of the Prova Brasil. Pereda, Lucchesi, Mendes and Bresolin (2015), in turn, observed higher
mathematics scores from 5th and 9th year students on the 2007 and 2011 Prova Brasil, in schools that
carried out “selection process and election,” “civil service examination only,” and “selection process
only,” compared to those with “appointment only.”
    Lück (2011) corroborates the critical view of selecting principals through “appointment only,”
to the detriment of other competencies essential to student education and learning, consistent with
the literature. According to the Brazilian Institute of Geography and Statistics (Instituto Brasileiro de
Geografia e Estatística [IBGE], 2015), this modality is the least recommended for advancing with the
PNE (2014), due to common clientelistic practices (individual privileges in exchange for votes), lacking
any consultation with the school community or assurance of the candidates’ technical qualifications.
Both authors reported similar problems with the “election only” criterion, whose risks are similar
to the electoral process. However, the proponents of this modality argue that it is possible to involve
different segments in the pursuit of more effective school leadership, a change in power, an improved
organizational climate and transparent relationships (Maia & Manfio, 2010).
    “Civil service examination only” is considered more technical and transparent according to

               BRAZILIAN JOURNAL OF PUBLIC ADMINISTRATION                     |   Rio de Janeiro 55(4): 881-922, July - Aug. 2021

                                                                          883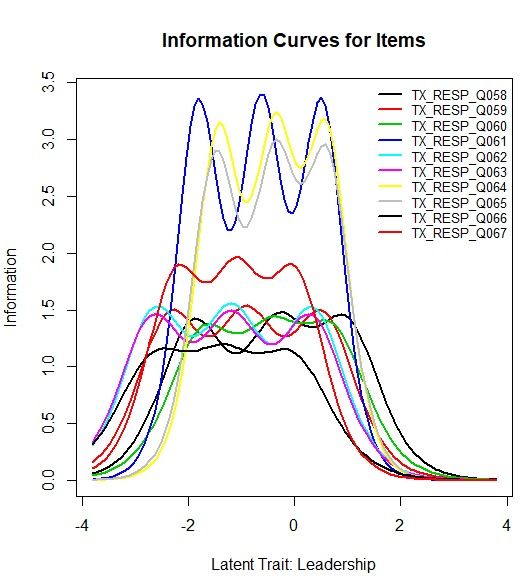
RAP   |   The effect of policies for filling school principal positions on school management in Brazil

Lück (2011), but it limits the possibility of replacements for the position, if necessary, as well as the
participation of the school community. “Selection process only” and “selection process and election,”
in turn, enable a better verification of the candidates’ competencies and skills through interviews,
a certification examination, proof of knowledge, proof of qualifications, a letter of intent, and
management plans for the evaluation of the school community. The latter is common in countries
with high-performing education systems and allows for greater accountability in management. The
advantages of the “selection process and election” mixed modality are also indicated by Ghanem
(1995) and Libâneo (2001).
    Although there is an apparent consensus on the negative consequences of “appointment only,”
Gremaud, Pazello and Maluf (2015) did not observe a relevant impact of this method on student
educational performance, despite the potential effect of that option on principals’ managerial skills.
The models analyzed showed little difference in the average mathematics scores between schools that
changed their selection modalities, based on microdata from the 2007 to 2011 Prova Brasil.
    Pereda et al. (2015) concluded that the selection process impacts learning and/or academic
performance based on the background of the principal selected. The principal’s time in the position
at the same school for between 05 and 15 years and the promotion of professional development for
teachers had more consistent results in different analyses. Accordingly, most of the studies cited support
the argument that in the Brazilian case, the principal selection method influences school performance.

2.2 The relationship between perceptions of leadership and school climate and the school principal
selection process
In the school management literature, principal leadership and school climate—as a cooperative
environment focused on the teaching-learning process—are prominent among the main characteristics
for differentiating student performance (Levine & Lezotte, 1990; Rutter, Maughan, Mortimore, Ouston
& Smith, 2008; Sammons, 2008; Teddlie & Reynolds, 2000).
    Leadership is synonymous with an effective school, and a good principal is capable of exercising
leadership in a firm, objective, stable, appropriate and academic way, in collaboration with his or her
staff (Mortimore, Sammons & Ecob, 1988; Rutter et al., 2008; Sammons, 2008; Teddlie & Stringfield,
1993). Leadership accounted for 25% of the total variance in student learning, when intraschool
factors were analyzed. When compared with interschool differences, the percentage was 3% to 5%
(Leithwood & Jantzi, 2009). In Brazil, principal leadership is also one of the common aspects associated
with good school performance (Abrucio, 2010; Alves et al., 2015; Alves & Franco, 2008; Lück, 2009).
    Alves et al. (2015) used three leadership constructs: administrative, pedagogical, and participative.
The results exhibited high consistency in relation to school performance. The first emphasizes financial
resources for the operation and maintenance of the school, as well as problems that affect its routine.
The second refers to the principal’s ability to design and implement shared goals and projects to
improve education, encourage teacher development and legitimize the pedagogical team. The third
includes the principal selection method, the composition of the school council, the frequency of class
council meetings and the way in which the political pedagogical project is developed.
    According to Oliveira (2015), discussions about school leadership typologies are frequent, although
there is no consensus. In the United States, transformational leadership (human and organizational

                BRAZILIAN JOURNAL OF PUBLIC ADMINISTRATION                     |   Rio de Janeiro 55(4): 881-922, July - Aug. 2021

                                                                           884
RAP   |   The effect of policies for filling school principal positions on school management in Brazil

development) and instructional leadership (interaction with teachers to guide curriculum compliance
and learning) are particularly prominent. Marks and Printy (2003) proposed to aggregate the
characteristics of the principal’s pedagogical and relational management, i.e., integrated leadership.
This concept was corroborated by Oliveira and Carvalho (2015) and Urick and Bowers (2014), who also
suggested considering interaction with the context and other school agents. This is because principals
tend to adapt their actions based on the needs of teachers and students as well as local accountability
policies and regulations, combining different types of leadership when performing their role.
    School climate, in turn, is considered by Abrucio (2010) to be the greatest explanatory factor
differentiating schools with better performance. The author emphasizes the importance of teamwork,
cohesion, commitment, participation, co-responsibility, and motivation, also indicated by Lück
(2009). For Sammons (2008), a school’s ethos is determined by the way its professionals work together,
common values and goals, and the learning environment among students. Teddlie and Reynolds (2000)
add a shared mission and vision, a sense of community, and consistency in curricular practices and
the application of rules and disciplinary punishments. In short, when norms and goals are agreed
upon and everyone’s participation is clearly defined, there is a positive school climate.
    In the view of some authors, school climate is the result of more effective leadership (Abrucio,
2010; Lück, 2009), such that the two variables are interconnected. A study by Oliveira (2015) identified
significant associations between leadership types and the principal’s managerial performance,
particularly in the construction and maintenance of an organizational climate conducive to teaching
and learning. The combination of these factors is in line with the institutional effect of Rutter et al.
(2008), with greater power of action. It is therefore necessary to reflect on the concepts of management,
leadership, and school climate in an integrated way, rather than in isolation, considering that it is a
social organization with people in constant interaction. The author also indicates that few studies in
the country have focused on understanding teacher perceptions of situations involving the work of the
school principal or relationships in the school environment.
    However, some of the empirical studies examined treat these factors differently. Analyzing
inequalities in learning in Brazilian schools, the United Nations Educational, Scientific and Cultural
Organization (Organização das Nações Unidas para a Educação, a Ciência e a Cultura [UNESCO],
2017) constructed four aggregate factors: leadership, climate, teaching and teacher characteristics,
and school infrastructure. With regard to leadership, administrative, pedagogical and participatory
factors were analyzed, as well as those related to human resources and the principal’s education and
experience; for school climate, factors such as the cohesion of the pedagogical team, the school’s
operating conditions, interventions for improvement (access, failure and dropout) and school violence
were considered. It was concluded that in schools where leadership and climate are favorable, there
are fewer chances of students experiencing exclusion and greater chances of them being at the
appropriate learning level.
    The school climate and principal leadership characteristics were also grouped into two different
factors by Oliveira and Waldhelm (2016), in order to establish a potential relationship between
intraschool factors and the mathematics performance of 5th year students on the 2013 Prova Brasil.
In this study, the authors used questions involving personal relationships between teachers and
principals and the pedagogical and administrative performance of principals in schools, resulting in

               BRAZILIAN JOURNAL OF PUBLIC ADMINISTRATION                     |   Rio de Janeiro 55(4): 881-922, July - Aug. 2021

                                                                          885
RAP   |   The effect of policies for filling school principal positions on school management in Brazil

the creation of the Average Principal Leadership Index. Thus, the variables analyzed, which identify
different leadership backgrounds, were grouped into a single factor in order to measure overall
teacher perceptions of the subject. Notably, however, not all of the school leadership dimensions are
included in this index.
     In the same study, questions related to teacher perceptions of factors that affect the construction of
a school environment conducive to student learning were added, in order to create the Average School
Climate/Teacher Collaboration Index, including information on cohesion among staff members,
generally related to the principal’s performance. However, it also does not consider all of the elements
of school climate, such as violence and discipline. The model developed was able to explain 15.9% of
the variation in student performance in Rio de Janeiro, reinforcing the importance attributed to
intraschool factors in the literature.
     The indicators discussed above enabled a differentiated analysis of the impacts of the method for
filling principal positions in relation to perceptions of leadership and school climate, which guided
the creation of the dependent variables in the empirical model adopted in this article. In the next
section, we will present our hypotheses and discuss the methodology adopted to test them.

3. HYPOTHESES AND METHODOLOGICAL PROCEDURES
Based on this initial theoretical analysis, we present the two main hypotheses of this paper:

1) There is a difference between the average teacher perceptions of principal leadership in schools
   that adopt different principal selection modalities; and
2) There is a difference between the average teacher perceptions of school climate in schools that
   adopt different principal selection modalities.

    To prove these hypotheses, the following methodological procedures were developed.
    The first stage of this study’s empirical analysis involved a survey of the regulations on state school
principal selection policies in Brazil’s 26 FUs and the Federal District, carried out in December 2016,
using the official internet channels of the legislative and executive branches. A rich body of laws and rules
was identified for analysis; these laws and rules were classified into three groups: State Education Plans
(Planos Estaduais de Educação - PEE); career plans and statutes for teachers or education professionals;
and state education systems, democratic management and specific laws on the subject. The selection
modalities chosen reproduce the same responses as those on the Saeb questionnaires, to ensure
comparison of the formulation and implementation stages of these policies. The summary of the
laws analyzed is available in Appendix.
    Next, microdata from the 2013 and 2015 Saeb contextual questionnaires was analyzed, answered
by principals and teachers at state public schools that taught mathematics or the Portuguese language
to 5th year and 9th year primary school classes, as well as 3rd year secondary school classes. Among the
40,792 eligible schools, 39,098 principals responded to the specific question about their access to
the position (96%). To ensure a representative sample, only data from teachers who responded to the
ten selected questions on leadership (191,073) or the four on school climate (192,108) were included,
representing an average of close to five teachers per school. Incomplete observations were maintained

                BRAZILIAN JOURNAL OF PUBLIC ADMINISTRATION                     |   Rio de Janeiro 55(4): 881-922, July - Aug. 2021

                                                                           886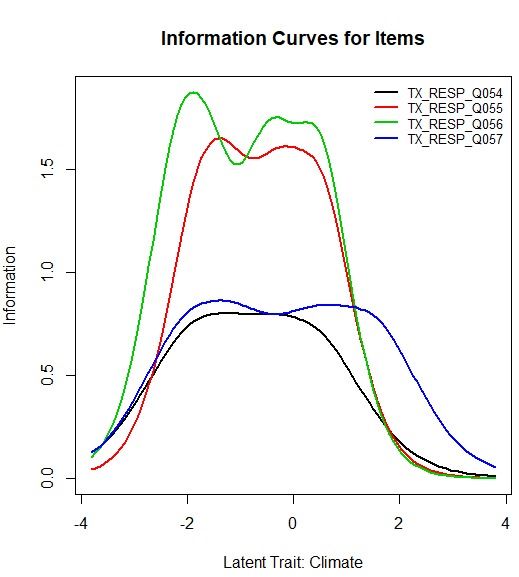
RAP   |   The effect of policies for filling school principal positions on school management in Brazil

for all the variables, for the purposes of descriptive analysis. A final sample of 39,456 schools was
thus obtained.
     In this study, IRT was used to construct the climate and leadership indicators, in order to obtain
measurements of latent constructs based on dichotomous or ordinal factors (Alves et al., 2015). These
models are often adopted in educational studies due to the need to evaluate test items and estimate
students’ abilities as well as to allow the use of questions with incomplete data, in order to estimate
the value of the score of interest, which is quite common in these questionnaires. For this reason,
they offer an advantage over conventional methods.
     Then, based on the set of variables selected from the contextual questionnaires, the teachers’
responses were synthesized into two different indicators: principal leadership and school climate.
Subsequently, these measurements were grouped at the school level by their average. As these variables
are ordinal, Samejima’s (1969) model was employed, which assumes the unidimensionality of the
data to produce a latent construct. The analysis of the eigenvalues and eigenvectors synthesizes the
polychoric correlation matrix, more appropriate for ordinal variables: “If the first eigenvalue accounts
for most of the variability present in the correlation matrix, this assumption is considered valid, which
justifies the synthesis of the variables into a single factor” (Alves et al., 2015, p. 61). Accordingly, the
parameters of the items and the distribution of responses were first estimated, in order to subsequently
define the factor scores.
     Next, a multiple linear regression model (Wooldridge, 2011) was applied, in order to measure
variations (in percentage terms) in teacher perceptions of the principal leadership and school climate
indicators when the principal selection method changes and the other factors remain constant.
Effects were estimated for the following modalities1: “civil service examination only”; “election only”;
“appointment only”; “selection process only”; “selection process and election”; “selection process and
appointment”; and “another method.” Each modality was transformed into a binary variable and
analyzed simultaneously in the leadership and climate models.
     For purposes of comparison, “selection process and appointment” was chosen as the standard
modality, as the coefficient values in the schools that adopted it are closer to the national average for
leadership and school climate. The results of the other modalities analyzed should thus consider this
reference. The “another method” responses were discarded due to their difficulty of interpretation,
as it is not possible to identify the evaluation mechanisms addressed in the response.
     The selection of the dependent variables was made based on their relevance in the literature in
terms of positive effects on learning. Specifically, the Principal Leadership and School Climate/Teacher
Collaboration constructs developed by Oliveira and Waldhelm (2016) were adapted, which proved to
be suitable in the test of association between variables. However, in the initial group of five questions
related to climate, the decision was made to exclude the first, as it exhibited a different behavior in
terms of polarity when compared to the others. This indicates that they may not be associated with
a single construct. The ten leadership variables were maintained according to the authors’ model.
Another difference, mentioned above, was the use of IRT rather than factor analysis, as it allows

1
    Question no. 14 from the Principal contextual questionnaire on the 2013 and 2015 Saeb.

                      BRAZILIAN JOURNAL OF PUBLIC ADMINISTRATION                      |   Rio de Janeiro 55(4): 881-922, July - Aug. 2021

                                                                                  887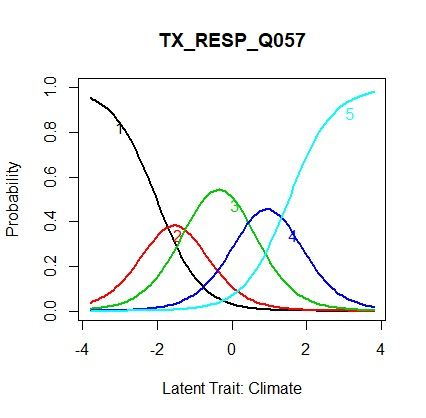
RAP   |   The effect of policies for filling school principal positions on school management in Brazil

incomplete profiles to be included in the estimation of these constructs, i.e., variables with missing
data are considered rather than excluded from the analysis. The results obtained are provided in
Appendix.
    Box 1 contains the questions used to construct the principal leadership and school climate factors.
In the former, the response options indicate the frequency per action and have 5 ordinal levels, which
were categorized into values from 0 to 4. In the latter, the questions have 4 ordinal levels, with values
from 0 to 3. After estimating the latent trait, using IRT, which returns the indicator on a normal
distribution scale with an average of zero and a variance of 1 (ranging from -3 to 3 points), the two
scales were transformed into a scale with an average of 50 and a standard deviation of 10, to facilitate
data interpretation.

BOX 1                           SCHOOL CLIMATE AND PRINCIPAL LEADERSHIP INDICATORS ON THE 2013 AND 2015 SAEB

 Factor                   No.                                                                    Questionnaire

                          53*     Did you participate in planning some or all of the school curriculum?
   School climate

                          54      Did you exchange teaching materials with your colleagues?
                          55      Did you participate in meetings with colleagues who teach the same grade (year) as you?
                          56      Did you participate in discussions about the learning development of particular students?
                          57      Were you involved in collaborative activities with different teachers (for example, interdisciplinary projects)?
                          58      The principal discusses educational goals with teachers at meetings.
                          59      The principal and teachers seek to ensure that educational quality is a collective responsibility.
                          60      The principal informs teachers about opportunities for professional development.
                          61      The principal gives special attention to aspects of student learning.
   Principal leadership

                          62      The principal gives special attention to aspects of administrative standards.
                          63      The principal gives special attention to aspects related to the school’s maintenance.
                          64      The principal encourages me and motivates me to work.
                          65      The principal encourages innovative activities.
                          66      I feel respected by the principal.
                          67      I have confidence in the principal as a professional.

Note: ‘*’ Question discarded in the construct due to polarity.
Source: Elaborated by the authors.

   The independent control variables selected refer to the characteristics of principal and management
background, such as education, time in the position at the same school, gross salary and gender.
The year of the Saeb and the school’s FU were also included (transformed into binary variables
and inserted simultaneously into the models analyzed). In this case, the state of Acre was used as a

                                 BRAZILIAN JOURNAL OF PUBLIC ADMINISTRATION                      |   Rio de Janeiro 55(4): 881-922, July - Aug. 2021

                                                                                             888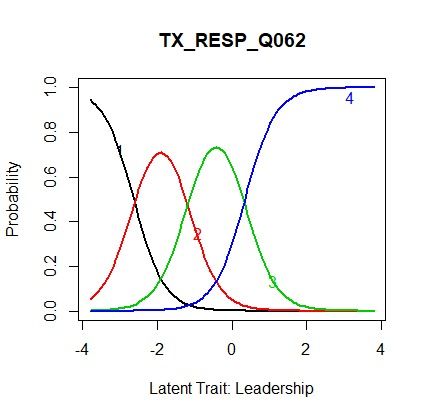
RAP   |   The effect of policies for filling school principal positions on school management in Brazil

baseline for comparison, as the climate and leadership indicators in this state’s schools are close to
the national average.
    In addition, four context indicators from the “Anísio Teixeira” National Institute for Educational
Studies and Research (Instituto Nacional de Estudos e Pesquisas Educacionais Anísio Teixeira - Inep)
were inserted: average socioeconomic level of students in basic education schools2; school management
complexity3; teacher retention4; and adequacy of teacher training5. Some of the variables were grouped
into different categories than the questionnaires, in order to follow the findings in the literature or
because they were a better fit in the models. For example, graduate studies consolidated four responses
into a binary variable, while time in the position adopted the categories of Pereda et al. (2015).
    The following equations are used in the models to be tested:

SCHOOL_CLIMATE = β0 + β1(FILL_POSITION) + β2(SALARY) + β3(WOMAN) + β4(GRAD)
+β5(REC_TRAINING) + β6(ORG_TRAINING) + β7(EXTERNAL_ACTIV) + β8(FINANCIAL_DIF) +
β9(YEARS_POSITION) + β10(MANAGEMENT_COMP) + β11(SEL_STUDENTS) + β12(TEACHER_
RET) + β13(TEACHER_TRAIN + β14(FU) + β15(YEAR) + u

PRINCIPAL_LEADERSHIP = β0 + β1(FILL_POSITION) + β2(SALARY) + β3 (WOMAN) + β4(GRAD)
+β5(REC_TRAINING) + β6(ORG_TRAINING) + β7(EXTERNAL_ACTIV) + β8(FINANCIAL_DIF) +
β9(YEARS_POSITION) + β10(MANAGEMENT_COMP) + β11(SEL_STUDENTS) + β12(TEACHER_
RET) + β13(TEACHER_TRAIN + β14(FU) + β15(YEAR) + u

       The complete table with the variables used is shown in Table 1.

TABLE 1              DESCRIPTIVE STATISTICS OF THE VARIABLES USED ON THE 2013 AND 2015 SAEB

                                                      No. of                                     Standard
    Variable                                                                Average                                   Minimum           Maximum    NA
                                                     Schools                                     Deviation

    School_climate                                    38,805               57.3921                9.7386              23.98866          79.12826   651
    Principal_leadership                              38,854               59.1359                9.5945              14.72490          78.58443   602
    Civil_service_examination_only                    39,098                0.1016                0.3022                    0              1       358
    Election_only                                     39,098                0.2630                0.4402                    0              1       358
    Nomination_only                                   39,098                0.2355                0.4243                    0              1       358
                                                                                                                                                   Continue

2
  Defined by family income, property ownership, employment of domestic help by the students’ family and the education level of their
parents or guardians.
3
  Calculated by the size (number of students enrolled); number of work (teaching) shifts; complexity of the stages offered; and number
of stages/modalities offered.
4
  Evaluates teacher retention in basic education schools in the last five years.
5
  Measures the number of teachers working in basic education whose teaching subject is in line with their academic training, according
to the legal standards and provisions.

                      BRAZILIAN JOURNAL OF PUBLIC ADMINISTRATION                     |   Rio de Janeiro 55(4): 881-922, July - Aug. 2021

                                                                                 889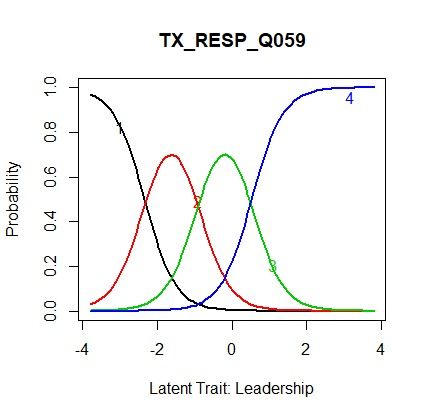
RAP   |   The effect of policies for filling school principal positions on school management in Brazil

                                                      No. of                                     Standard
 Variable                                                                   Average                                   Minimum           Maximum    NA
                                                     Schools                                     Deviation
 Selection_process_only                               39,098                0.0494                0.2168                    0              1      358
 Selection_process _and_election                      39,098                0.2033                0.4024                    0              1      358
 Selection_process _and_nomination                    39,098                0.0592                0.2360                    0              1      358
 Principal_gross_salary                               38,936                7.2863                1.9074                    0             10      520
 Principal_woman                                      39,252                0.7479                0.4341                    0              1      204
 Graduate_studies                                     38,966                0.8505                0.3564                    0              1      490
 Received_impact_training                             39,178                0.6815                0.4658                    0              1      278
 Organized_continued_training                         38,892                0.7404                0.4384                    0              1      564
 External_activity                                    39,131                0.2533                0.4349                    0              1      325
 School_financial_difficulty                          39,120                1.1928                1.0798                    0              3      336
 3_to_5_years_in_position                             39,165                0.4923                0.4999                    0              1      291
 6_to_10_years_in_position                            39,165                0.1849                0.3882                    0              1      291
 11_to_15_years_in_position                           39,165                0.0911                0.2878                    0              1      291
 More_than_15_years_in_position                       39,165                0.0397                0.1954                    0              1      291
 School_management_complexity                         37,651                4.0144                1.2385                    1              6      1,805
 Student_socioeconomic_level                          37,797                4.4363                0.9792                    1              7      1,659
 Teacher_retention                                    37,407                3.0310                0.5614                    0              5      2,049
 Adequacy_teacher_training                            37,663                3.9500                10.445                    0             100     1,823
 FU_(27)                                              39,456                     -                     -                    0              1       0
 Year_[T.2015]                                        39,456                     -                     -                    0              1       0

Note: NA = missing responses
Source: Elaborated by the authors.

    Additionally, an analysis of the legal frameworks for school principal selection in the FUs and the
Federal District revealed a very heterogeneous configuration in the scope of the specific or democratic
management legislation that includes the subject, compared to the guidelines established in the PEEs.
These were approved between 2014 and 2016, except in the states of Minas Gerais and Rio de Janeiro,
where they were still pending in the legislative bodies until December 2016. The continuity of the
modalities across the years was also evaluated. In some cases, a transition to “selection process and
election” is perceived, particularly in the most recent legal provisions. Others maintained their initial
orientation over different periods.
    The PEEs indicate the need to develop specific laws to regulate the subject within one or two
years. They thus represent an important step toward institutionalizing a new policy, although they
do not guarantee its implementation in practice. For this reason, the decision was made to disregard
those plans as a criterion for classifying the selection method adopted in each FU, except for those
that subsequently approved specific laws. This facilitated the comparison with the microdata from

                     BRAZILIAN JOURNAL OF PUBLIC ADMINISTRATION                      |   Rio de Janeiro 55(4): 881-922, July - Aug. 2021

                                                                                 890
RAP | The effect of policies for filling school principal positions on school management in Brazil
the 2013 and 2015 editions of the Saeb. Notably, the state policies do not always coincide with the
principals’ responses to the questionnaires, as will be seen below.
4. RESULTS AND ANALYSES
In this section, we will present the results of the analyses performed using the legal texts from the FUs
and the Federal District, the descriptive statistics based on the Saeb microdata, and the econometric
tests performed using that same database, in order to prove the hypotheses enumerated above.
4.1. Analysis of the current rules for filling school principal positions
The “election only” criterion is the most common modality and was observed in fourteen FUs and the
Federal District (56%). Their geographical distribution is quite comprehensive, with four located in
the Center-West region, four in the Northeast, three in the North, two in the South and two in the
Southeast. Seven of them appear to be in a stage of transition from the current policy to “selection
process and election,” as recommended by the PNE, in Guideline 19.1. There is also a broad spectrum
of evaluation mechanisms used in each of these systems. A detailed description of these rules and
criteria per FU can be found in Appendix.
Currently, only São Paulo regulates “civil service examination only,” while “selection process only”
was located only in Amazonas. Roraima was the only state classified as “appointment only,” due to the
absence of legal frameworks on the subject prior to the PEE6. However, it is also important to note
the high incidence of this modality in many states in the microdata analysis, despite the divergence
with the legislation.
Furthermore, according to an opinion of the Supreme Federal Court of Brazil (Supremo Tribunal
Federal - STF)7, the Chief Executive Officer is considered to have the exclusive authority to fill civil
service positions for public school principals, who should be freely appointed by the local government.
The STF considers unconstitutional any rules that provide for direct elections—with community
participation—for principals in schools administered by the government. Although it is mentioned
in legal provisions of subnational governments in Brazil and on the Saeb, it is not a standard electoral
process, as it does not ensure that principals will remain in their positions for the entire term. For this
reason, the term public consultation with the school community is used in the PNE.
“Selection process and election,” in turn, encompasses nine FUs (33%) and is the second most
popular modality in the country. Its geographical distribution is predominantly in the Northeast
region, with five occurrences, followed by two in the North, one in the South and one in the Southeast.
This category excludes the seven FUs whose PEEs indicate a movement toward the mixed method
but that have not yet been consolidated by other legal instruments.
In the analysis of the legislation and rules, it was not possible to identify any FU that established
the “selection process and appointment” criterion or the “another method” modality. Nevertheless,
6
This plan provides for the adoption of technical criteria of merit and performance but was disregarded due to the reasons explained
above. During the document research, no specific laws or rules with such regulations were identified, only a civil society movement
favoring “election only” over “appointment only.” It was therefore deduced that this method was a prevalent policy until 2016, which
was confirmed by the microdata, as analyzed in the following section.
7
Direct Action of Unconstitutionality (Ação Direta de Inconstitucionalidade - ADI) no. 2997, of August 12, 2009.
BRAZILIAN JOURNAL OF PUBLIC ADMINISTRATION | Rio de Janeiro 55(4): 881-922, July - Aug. 2021
891principals in these categories when the microdata were analyzed, which will take place in
the following section.
RAP | The effect of policies for filling school principal positions on school management in Brazil
4.2 Descriptive analysis of methods for filling school principal positions per FU
based
there was aon Saeb microdata
significant percentage of responses from principals in these categories when the microdata
were analyzed, which will take place in the following section.
After analyzing the legislation, the descriptive statistics on filling principal positions were
4.2 Descriptive analysis of methods for filling school principal positions per FU based on Saeb microdata
analyzed based on the principals’ responses to the 2013 and 2015 Saeb questionnaires.
After analyzing the legislation, the descriptive statistics on filling principal positions were analyzed
Once again, “election only” was the most popular modality among the schools, followed
based on the principals’ responses to the 2013 and 2015 Saeb questionnaires. Once again, “election
bywas
only” “appointment only”
the most popular and “selection
modality among the process and election.”
schools, followed Conversely,
by “appointment only” “selection
and “selection
process andonly”
process election.” Conversely,
had the lowest “selection
incidenceprocess
amongonly” had the
the FUs, lowest incidence
followed among
by “selection the FUs,
process
followed by “selection process and appointment.”
and appointment.”
The distribution percentages per modality are shown in Graph 1.
The distribution percentages per modality are shown in Graph 1.
GRAPH 1 FILLING PRINCIPAL POSITIONS PER MODALITY
Graph 1 ON THE 2013 AND 2015 SAEB
Filling Principal Positions per Modality on the 2013 and 2015 Saeb
Source: Elaborated by the authors.
Source: Elaborated by the authors.
From a territorial standpoint, there is great heterogeneity in terms of the distribution of the
modalities8From
. “Civilaservice
territorial standpoint,
examination only” there is great inheterogeneity
is concentrated in terms
São Paulo. “Selection of the
process only”
is most commonofinthe
distribution Espírito Santo.and
modalities 8 Rio service
“Civil de Janeiro (2015). “Election
examination only” isonly” predominates
concentrated in the
in São
Federal District and in seven FUs: Alagoas, Mato Grosso, Paraná, Piauí (2013), Rio Grande do Norte,
Paulo. “Selection process only” is most common in Espírito Santo and Rio de Janeiro
Rio Grande do Sul and Rondônia. Finally, “appointment only” predominates in eleven FUs: Amapá,
(2015). “Election
Amazonas, Maranhão,only” Pará,predominates
Paraíba, Piauí in the Federal
(2015), District(2013),
Rio de Janeiro and in Roraima,
seven FUs: Alagoas,
Santa Catarina,
Sergipe and Tocantins.
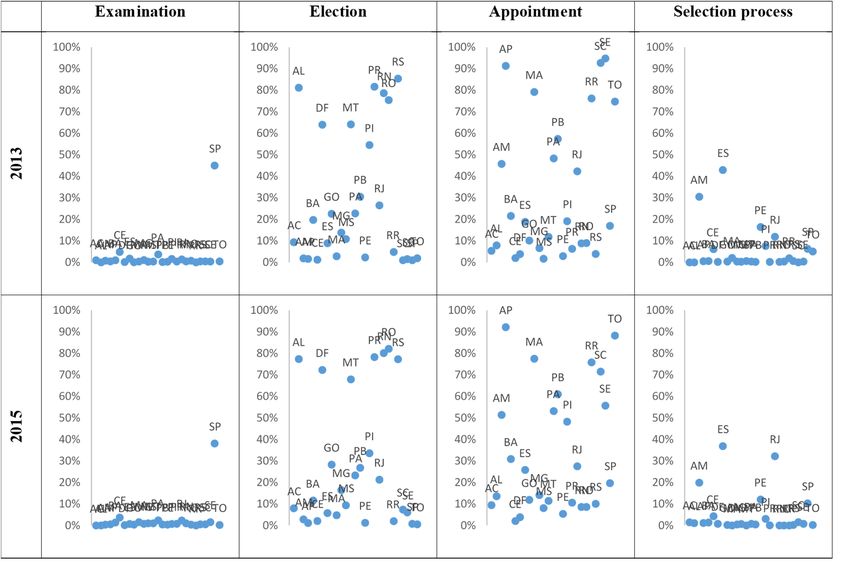
Graph 2 shows the distribution of these percentages per FU among the single selection
8
Rio de Janeiro
modalities. Thereandis aPiauí weredispersion
greater counted twice,
in as
thetheir most common
“election selection
only” and modalities changed
“appointment between
only” modalities,
2013 and 2015.
i.e., where the majority of the FUs are concentrated. In turn, the dispersion is low for “civil service
16
8
Rio de Janeiro and Piauí were counted twice, as their most common selection modalities changed between 2013 and 2015.
BRAZILIAN JOURNAL OF PUBLIC ADMINISTRATION | Rio de Janeiro 55(4): 881-922, July - Aug. 2021
892Rondônia. Finally, “appointment only” predominates in eleven FUs: Amapá, Amazonas,
Maranhão, Pará, Paraíba, Piauí (2015), Rio de Janeiro (2013), Roraima, Santa Catarina,
Sergipe and Tocantins.
Graph 2 shows the distribution of these percentages per FU among the single
RAP | The effect of policies for filling school principal positions on school management in Brazil
selection modalities. There is a greater dispersion in the “election only” and “appointment
only” modalities,
examination only” and where the
i.e.,“selection majority
process only,”ofinthe FUsallare
which the concentrated.
FUs are below In
50%turn, the great
and the
majority areisless
dispersion lowthan
for10%.
“civil service examination only” and “selection process only,” in
which all the FUs are below 50% and the great majority are less than 10%.
GRAPH 2 FILLING THE PRINCIPAL POSITION PER SINGLE MODALITY ON THE 2013 AND 2015 SAEB
Graph 2
Filling the Principal Position per Single Modality on the 2013 and 2015 Saeb
Source: Elaborated by the authors.
Source: Elaborated by the authors.
Among the mixed modalities, only “selection process and election” is noteworthy, with a high
dispersion and a the
Among greater concentration
mixed modalities,inonly
seven FUs: Acre,
“selection Bahia,and
process Ceará, Goiás, is
election” Mato Grosso do Sul,
noteworthy,
Minas Gerais and Pernambuco. “Selection process and appointment” and “another method” are not
with a high dispersion and a greater concentration in seven FUs: Acre, Bahia, Ceará,
predominant in any state, which is evident based on the low dispersion of these modalities.
Goiás,
GraphMato Grosso
3 shows do Sul,
the same Minas distribution
percentage Gerais and per
Pernambuco.
FU among the“Selection processmodalities.
mixed selection and
appointment” and “another method” are not predominant in any state, which is evident
based on the low dispersion of these modalities.
17
BRAZILIAN JOURNAL OF PUBLIC ADMINISTRATION | Rio de Janeiro 55(4): 881-922, July - Aug. 2021
893Graph 3 shows the same percentage distribution per FU among the mixed
selection modalities.RAP | The effect of policies for filling school principal positions on school management in Brazil
GRAPH 3 FILLING THE PRINCIPAL POSITION PER MIXED
Graph 3 MODALITY ON THE 2013 AND 2015 SAEB
Filling the Principal Position per Mixed Modality on the 2013 and 2015 Saeb
Source: Elaborated by the authors.
Source: Elaborated by the authors.
4.3 Tests for Model 1: Effects of the method for filling positions on school climate
4.3 Tests
Following thefor Model
legal 1: Effects
and empirical of theofmethod
analysis for filling
the methods positions
for filling onpositions,
principal school climate
econometric
tests were conducted to assess whether the school principal selection method influences perceptions of
school climate,the
Following based onand
legal the construct
empiricaladapted
analysisfrom Oliveira
of the and Waldhelm
methods for filling (2016) andpositions,
principal the equations
described in the methodological section. Before proceeding to the tests, the internal consistency of
econometric tests were conducted to assess whether the school principal selection method
the questionnaire applied for school climate was analyzed.
influences
The internalperceptions
consistency of reliability
school climate,
of this based on the
construct was construct
estimated adapted
using thefrom Oliveira
Cronbach’s alpha
coefficient, calculated
and Waldhelm based
(2016) andon thethe variancedescribed
equations in the individual items and the covariances
in the methodological between
section. Before
them. For the school climate indicator, the four items range from 0.77 to 0.81, and together, 0.83. This
proceeding to the tests, the internal consistency of the questionnaire applied for school
indicates its reliability, as a value of α ≥ 0.70 is considered satisfactory. In the polychoric correlation
climate
matrix, thewas analyzed.
values are positive and have a coefficient greater than 0.45, an indication that all these
items can The
be associated
internal with a single construct.
consistency reliability The eigenvalues
of this construct arewas
2.61 estimated
for the firstusing
item, the
almost
five times higher than the second (0.56), and the third and fourth are even lower. The assumption of
Cronbach’s alpha coefficient, calculated based on the variance in the individual items
unidimensionality is therefore considered valid.
and the covariances
Graph between them.
4 shows the distribution Foraverage
of the the school
valuesclimate indicator,
of the school the four
climate itemsper
indicator range
school,
ranging from 23.99 to 79.13. The parameters of the indicator were adjusted to an average of 50, with
18
BRAZILIAN JOURNAL OF PUBLIC ADMINISTRATION | Rio de Janeiro 55(4): 881-922, July - Aug. 2021
894have a coefficient greater than 0.45, an indication that all these items can be associated
with a single construct. The eigenvalues are 2.61 for the first item, almost five times
higher than the second (0.56), and the third and fourth are even lower. The assumption of
unidimensionality isRAP
therefore
| The effect considered valid.
of policies for filling school principal positions on school management in Brazil
Graph 4 shows the distribution of the average values of the school climate
a standard deviation of 10. Of the 39,456 observations, 7,565 were discarded because they did not
indicator per school, ranging from 23.99 to 79.13. The parameters of the indicator were
exhibit any response in the variables used.
adjusted to an average of 50, with a standard deviation of 10. Of the 39,456 observations,
7,565 were discarded because they did not exhibit any response in the variables used.
GRAPH 4 DISTRIBUTION OF THE AVERAGE VALUES FOR THE SCHOOL CLIMATE INDICATOR PER
SCHOOL
Graph 4
Distribution of the Average Values for the School Climate Indicator per School
Source: Elaborated by the authors.
Source: Elaborated by the authors.
By applying the multiple linear regression method, the estimation of the results of the equations
describedBy applying
in the the multiple
methodological section linear regression
identified that themethod,
principalthe estimation
selection variableof was
the results of
statistically
significant
the equationsfor explaining
described the in
behavior of the average school
the methodological climate
section variable.that
identified Thisthe is because
principal the
p-value of the hypothesis test, related to the selection modality coefficient, was estimated to be less than
selection
2.2e-16. Thevariable was statistically
interpretation of this resultsignificant
indicates thefor explaining
rejection of thethe
nullbehavior
hypothesis of(H0:
the Beta
average
= 0),
school climate
concluding variable.
that the adjustedThis is because
coefficient for thethe p-value
selection of theishypothesis
modality significantlytest, related
different to zero.
from the
“Civil service examination only” obtained the highest ceteris paribus elasticity on average school
selection modality coefficient, was estimated to be less than 2.2e-16. The interpretation
climate, with a coefficient of 1.36, indicating that there is greater collaboration among teachers in
of this result
day-to-day indicatesactivities.
pedagogical the rejection of the null
It is followed hypothesis
by “selection (H0:and
process Beta = 0), concluding
election” (0.80). Both that
were
statistically
the adjusted significant at a level
coefficient of 0.1%.
for the The modality
selection “selection is
process only” (0.59),
significantly “election
different fromonly”
zero.(0.48)
and “appointment only” (0.43) single modalities were significant at a level of 5%. Importantly, the
“Civil service examination only” obtained the highest ceteris paribus elasticity on
“selection process and appointment” variable was used as a baseline for comparison. The effects
average
can school
be observed climate,
in Table 2, in with a coefficient
the section of 1.36,
with the joint analysisindicating that
of the results for there is greater
the leadership and
school climate variables.
collaboration among teachers in day-to-day pedagogical activities. It is followed by
Although the selection modality contributes to explaining the variation in the average school
“selection process and election” (0.80). Both were statistically significant at a level of
climate, it is necessary to consider other explanatory variables included in the model, which proved
to be relevant. With regard to principal and management background, the following have positive
effects: between 11 and 15 years in the position at the same school (0.72), organizing training
activities (0.98), being a woman (0.91) and graduate studies (0.57). In the opposite direction 19
are principals who carry out external activities (-0.43). Among Inep’s school context indicators,
school management complexity showed the highest statistical relevance (-1.37). Consequently, the
BRAZILIAN JOURNAL OF PUBLIC ADMINISTRATION | Rio de Janeiro 55(4): 881-922, July - Aug. 2021
895RAP | The effect of policies for filling school principal positions on school management in Brazil
greater the size, number of classes and stages offered, the lower the average school climate. Teacher
retention, however, which measures the continuity of teachers in schools in the last five years, has
a positive effect (1.19).
In general, the FU variable exhibited the greatest change among the effects in this model, as
it adds other unobservable or unexplained factors, which exercise a controlling role to isolate the
effect of the selection modality on school climate. This corroborates the argument of Urick and
Bowers (2014), as a principal’s managerial performance and the climate are influenced by the school
context. Accordingly, the institutional characteristics of each Secretariat of Education should be
partially captured in this indicator, pointing to the need for future analysis on the state capacity of
the agencies and the processes to control and supervise teaching in schools, among other political
and economic factors.
The lowest values were observed in the states of Pará, Santa Catarina and Sergipe, with
coefficients above nine and a negative polarity. Although Pará was classified as “election only” in
the analysis of the legal frameworks and the others as “selection process and election,” the microdata
analysis indicates the predominance of “appointment only.” Ranging from -6.2 to -7.2 are Alagoas,
Paraná, Piauí and Rio Grande do Norte, which were categorized as “election only” (in transition
to “selection process and election”), in line with what we observed in the microdata analysis. Just
below are Maranhão and Rio de Janeiro (-5.86). The former regulated “selection process and
election,” but “appointment only” is predominant. The latter consolidated “election only” in specific
legislation in 2016, but microdata analysis suggests a tendency to replace “appointment only” with
“selection process only.”
The FUs that obtained the highest positive coefficients are Espírito Santo, Minas Gerais and São
Paulo, as well as the Federal District ranging from 2.96 to 3.71. In no case is “appointment only”
predominant. In the latter, there is a higher concentration of “election only” when observing the
microdata, which converges with the legislation. In São Paulo, there is convergence with “civil service
examination only” as well as a higher percentage of “another method” (26%) responses. Espírito Santo
has one of the earliest regulations on “selection process and election,” but principals indicate a higher
concentration of “selection process only.” Minas Gerais was classified as “election only,” although the
microdata analysis indicates the predominance of “selection process and election.” Ceará, Bahia and
Tocantins, in turn, also presented positive values, but with statistical relevance only at a significance
level of 10%.
It can be concluded, in general, that the highest averages for the school climate indicator were
found in schools where “civil service examination only” occurred, followed by “selection process
and election,” according to the responses on the questionnaires. Conversely, “appointment only”
had the smallest effect, close to the “election only” and “selection process only” modalities. When
analyzed by FUs, the highest coefficients were seen in the federal capital and in three states in the
Southeast region, where technical and/or participatory criteria are predominant in both the laws and
in the microdata. “Appointment only” is predominant in the three FUs with the lowest coefficients,
although their laws indicate other modalities. Among the other factors, those associated with the
school context are particularly noteworthy: school management complexity (with a negative effect)
and teacher retention (with a positive effect).
BRAZILIAN JOURNAL OF PUBLIC ADMINISTRATION | Rio de Janeiro 55(4): 881-922, July - Aug. 2021
896You can also read