The effects of salinity on changes in characteristics of soils collected in a saline region of the Mekong Delta, Vietnam
←
→
Page content transcription
If your browser does not render page correctly, please read the page content below
Open Chemistry 2021; 19: 471–480
Research Article
Lam Van Tan*, Tran Thanh
The effects of salinity on changes in
characteristics of soils collected in a saline
region of the Mekong Delta, Vietnam
https://doi.org/10.1515/chem-2021-0037 and land sinking [1,2]. It is forecasted that the combination
received July 3, 2020; accepted February 27, 2021 of reduced supply of water and sediments, compaction,
Abstract: Due to the impacts of climate change and the and thermosteric sea level rise may threaten the existence
reduction in the flow of the Mekong River, saline intru- of this region in possibly less than a century [3]. This
sion into the inland has been an emergent and pressing certainly spells disaster for the Vietnamese economy,
issue. The purpose of this study is to analyze the effects of given that the Mekong Delta plays a key role in agricultural
various saline conditions (0–25‰) on changes in some and aquatic production of Vietnam [4]. The delta is char-
soil properties under laboratory conditions. Ten topsoil acterized by the vast area of fertile, flat land with little to
samples were collected from a depth of 0–20 cm in the no forest coverage and approximately 65% of which is
dry seasons in the rice–corn rotation fields with low sali- reserved for rice farming.
nity, in Thanh Phu district, Ben Tre province, Vietnam. One of the main natural obstacles of the Mekong
The examined criteria consisted of soil pH, soil electrical Delta is the saline water intrusion in the dry season,
conductivity of the saturated paste extract (ECe), exchange- affecting not only agricultural production but also water
able Na, percentage of exchangeable Na, and content (%) of supply and daily life for millions of people. At the sea-
nitrogen and phosphorus. The results revealed that the pH shore, salt in saline soils can locally be generated from
range of soil decreased from 5.14–5.72 to 4.08–5.14 when sediments or by saline intrusion of seawater or supplied
the soil salinity increased from 0 to 25‰. At the salinity of using saline water [5]. According to ref. [6], the accumu-
10‰ and higher, the available nitrogen began to decline. lation of salt in the soil begins to occur when the evapora-
Meanwhile, the available phosphorus tended to decrease as tion of water exceeds the amount of water supplied to
the salinity increased past 12‰. Some measures are also the soil because most irrigation water contains an
discussed, with the aim of ensuring sustainable rice farming amount of dissolved salt. After irrigation, water in the
in the circumstances of increased salinity. soil is absorbed by the crop or evaporates directly,
leaving the salt in the soil.
Keywords: salinity intrusion, saline soils, sodicization, Saline soils mainly contain soluble salt components
Mekong Delta including calcium (Ca2+), magnesium (Mg2+), sodium
(Na+), potassium (K+), chloride (Cl−), bicarbonate (HCO3),
or sulfate (SO42−) [7,8]. High salinity in the soils usually
causes the phenomenon of sodicization. Saline sodic soil
1 Introduction with a high accumulation of salt hinders crops growth.
Other disadvantages include disturbance and imbalance
Despite the long-lasting morphological stability of the in water and nutrient uptake and unfavorable physical
Mekong Delta, the landscape of the region has recently properties [9]. The presence of salts in the soil is deter-
witnessed drastic changes in the form of water withdrawal mined by the concentration of Na+, Ca2+, Mg2+, and K+;
and the ability of sodicization of the soil is determined by
calculating the adsorption ratio of Na+ on clay glue
* Corresponding author: Lam Van Tan, NTT Hi‐Tech Institute, Nguyen (sodium adsorption ratio (SAR) and exchangeable sodium
Tat Thanh University, Ho Chi Minh City, Vietnam; Ben Tre
percentage (ESP) [10]. According to the US Department of
Department of Science and Technology, Ben Tre Province, Vietnam,
e-mail: lvtan@ntt.edu.vn
Agriculture, soil is considered saline when the electrical
Tran Thanh: NTT Hi‐Tech Institute, Nguyen Tat Thanh University, conductivity (EC) of the saturated soil extract (EC satura-
Ho Chi Minh City, Vietnam tion) is greater than 4 dS m−1 at 25°C. Therefore, higher
Open Access. © 2021 Lam Van Tan and Tran Thanh, published by De Gruyter. This work is licensed under the Creative Commons Attribution
4.0 International License.472 Lam Van Tan and Tran Thanh
dissolved salts in the soils will lead to higher conduc- system, alluvial soil of Mekong river system and other
tivity [11]. alluvial soil of other river systems; (3) faded gray soil
Saline soils with high salt concentration lead to unfa- includes faded gray soil on acid magma and sandstone
vorable physical, chemical, and biological properties [12]. and faded gray soil on ancient alluvial; (4) acid sulfate
Saline soils contain high levels of Na+ ions in the soil’s soil; (5) salty soil; and (6) coastal sandy soil. In each major
absorption complex, causing disturbance and imbalance group, the soil quality indicators of nonorganic contents
in the uptake of water and nutrients for crops and disad- include three main indexes, which are exchangeable cal-
vantages in soil physical properties [13]. Soil salinity can cium content (TCVN 9236-1-2012), exchangeable magnesium
also indirectly affect crops by causing nutrient deficiencies content (TCVN 9236-2-2012), and exchangeable sodium con-
or nutrient imbalances in plants, such as the imbalance tent (TCVN 9236-3-2012).
in ratio of Na+/Ca2+ [14] or directly exert toxicity in plants
by excessive absorption of ions such as Na+, Cl−, B+,
and SO42− [15–18]. On agricultural land, salinity hinders
water–plant interaction by introducing excess salt in the 2.2 Experimental
root, which reduces the amount of water available to the
plant and causes the plant to use more energy to remove The experiment was arranged at room temperature (30 ±
the salt and absorb water. 2°C). The soil is chopped to a size of about 2 cm and
Fluctuations of saline and flooding factors directly placed in a glass jar (1,000 mL) with a weight of 1.5 kg
affect the production and daily life of people. As a basis dry soil/jar. The soil was submerged in saline solutions
for future orientation of agricultural land use in the with different salinity of 0‰ (control sample), 2, 4, 6, 8,
Mekong Delta, assessing the impact of salinity on changes 10, 12, and 25‰, with four replicates, a depth of 5 cm. Saline
in soil properties under laboratory conditions is essential to water is made from artificial seawater (instant ocean) and
improve the efficiency of land use and ensure sustainable distilled water. A 2‰ saline solution is made from 2 g of
farming conditions. In this study, we assessed the influence instant salt (instant ocean) into 1 L of water. Other treat-
of salinity variations on essential soil nutrient indicators ments were identically prepared. Soil samples were collected
such as pH, EC, Na+ exchange, ESP, available nitrogen, by small hand drills at 1, 2, 4, 6, and 12 weeks after saltwater
and available phosphorus. The results are expected to aid intrusion, and the soil was dried in natural conditions and
in devising strategies that are appropriate to specific crops to minced through 0.5 mm sieve.
cope with different salinity levels in the region.
2.3 Measurement of soil indicators
2 Materials and methodology The soil analysis methods are detailed in Table 1, and the
main component of instant ocean water and natural is
2.1 Collection of soil samples shown in Table 2.
The standards used for the analysis of phosphorus,
Soil samples were collected in rice–corn rotation farming Na+, Mg2+, and Ca2+ were potassium dihydrogen phos-
fields located in the low salinity ecological zone in Thanh phate KH2PO4 (CAS 7778-77-0), sodium chloride NaCl (CAS
Phu district, Ben Tre province, Vietnam. The highest sali- 7647-14-5), magnesium chloride MgCl2·6H2O (CAS 7791-18-
nity of water in canals and ditches is around 4–5‰ in the 6), and calcium carbonate CaCO3 (CAS 471-34-1), respec-
dry season. Soil samples were taken in accordance with tively. All standards were purchased from Merck and their
ISO 10381-2:2002 and then stored and brought to the purity were in the range of 99.0–101.0%.
laboratory in accordance with ISO 11464:2006. Topsoil
is collected at a depth of 0–20 cm. Sampling points follow
the zigzag pattern, and 10 soil samples were collected for
an area of 0.1 Ha. Samples were then mixed well, and a 2.4 Statistical and data analysis
representative sample was taken for analysis.
Soil is classified into the following six major groups Mean and standard deviations were derived using
according to the Vietnam standards: (1) red and yellow Microsoft Excel. ANOVA and LSD analysis of 5% to com-
soil; (2) alluvial soils include alluvial soil of Red River pare the differences in soil chemistry properties ofSalinity on changes in characteristics of soils of the Mekong Delta, Vietnam 473
Table 1: Methods of analyzing soil parameters
Analytical indicator Reference method Standard method
pH, EC Extracted with distilled water, extract ratio 1:2.5 (soil:water) and measured by pH,
EC meter
Nitrogen Guabekki and Bremner (1986) [19] ISO 11261:1995
Phosphorus Olsen (1954) [20] ISO 18645:2016
Na+, Mg2+, Ca2+ Atomic absorption spectrum (AAS) ISO 11464: 2006
TOC (total organic carbon) Walkley-Black (1934) [21] ISO 10694:1995
CEC (cation exchange The measure is determined by a buffer of BaCl2 0.1 M [22] ISO 23470:2018
capacity)
ESP (exchange sodium The method is based on the ratio of Na+ adsorbed and cation exchange capacity of
percentage) [Na+]
the soil (CEC, cmol/kg). ESP (%) = CEC
× 100
treatments. Using the Duncan test, evaluate the differ- of soil from 6.5 to 7.5 is suitable for the growth and devel-
ence in soil and water parameters. The final data were opment of cultured shrimp and aquatic organisms [24].
processed on SPSS 20 statistical software. In the Mekong Delta region, soil having pH values
ranging from 6.5 to 8 are suitable for aquaculture, so it
Ethical approval: The conducted research is not related to is reasonable to see the pH values of the tested soil were
either human or animal use. at low levels [25], which can adversely affect fisheries and
require measures to raise the pH, such as lime adminis-
tration. The SAR determined by the concentrations of
Na+, Ca2+, and Mg2+ of the sodic soil was greater than
3 Results and discussion 13; thus, the soil in the area taken is suitable for crop
cultivation. Regarding soil nutrients, the P content in
common soil is in the range of 10–100 mgP/and in asso-
3.1 Comparison of typical properties of ciation with the insoluble soil composition [26]. There-
instant ocean, natural seawater, and soil fore, the nutrition of the tested soil could be concluded to
properties before experiment be at low level.
In Table 3, the initial salinity of the soil according to the
EC criteria can be evaluated as nonsaline if the electrical
conductivity (EC) of the extract at saturated soil is less
3.2 Effect of salinity on changes in some soil
than 4 mS/cm at 25°C [23]. According to Boyd, the pH value properties under laboratory conditions
Higher salinity in agricultural production land caused by
coastal saline intrusion induces drastic changes in soil
Table 2: Main component of instant ocean water and natural
(Unit: ppt) characteristics and affects the structure and crop plants
and animals. In this laboratory experiment, nonsaline
Ion Instant seawater Natural seawater soils, the soil on which rice and corn are currently grown,
+
were treated with varying salinity (from 2 to 25‰) to
Na 10.78 10.781
K+ 0.42 0.399
monitor the variations in soil characteristics. This treat-
Mg2+ 1.32 1.284 ment is to simulate 3 months of high salinity in the dry
Ca2+ 0.4 0.411 season.
Sr2+ 0.008 0.007
Cl− 19.29 19.353
SO42+ 2.66 2.712
HCO3− 0.2 0.126 3.2.1 Soil pH
Br− 0.056 0.067
B(OH)3 — 0.025
The results presented in Table 4 show that the soil pH is
F 0.001 0.001
low, ranging from 4.0 to 5.6 on average. With increasing474 Lam Van Tan and Tran Thanh
Table 3: Some soil properties before the experiment
EC (mS/cm) pH Na+ exchange (cmol/kg) Available N (mg/kg) Available P (mg/kg) CEC (cmol/kg)
2.41 6.15 1.85 8.41 1.67 12.7
salinity, high saline treatments of 12 and 25‰ resulted in solution was slightly higher than 4 mS/cm, reaching the
the pH values that are significantly different from those of threshold of saline soils [27]. When the salt concentration
the control and of lower salt concentrations. When sali- increases from 4 to 25‰ after 2 weeks of saltwater flooding,
nity is increased, cation exchange between Na+ and H+ the salinity of the soil also increases, the value of EC of the
can lead to increased concentration of H+ ions in soil saturated paste extract (ECe) ranged from 7 to 46 mS cm−1.
solution, in turn lowering the soil pH. Over the period Thus, when saline soils are inundated with a salt concen-
of 2–12 weeks of saltwater intrusion, soil pH tends to tration of 2‰, the soil can become saline. An inundation
increase slightly. This increase in pH is negligible and with the salt concentration higher than this value may
has not yet reached the neutral pH value. When the soil aggravate the salinity issue of the soil, thus impairing the
is flooded, reducing reactions occur with the participa-
tion of soil microorganisms. The reduction reaction con-
sumes H+ ions, contributing to an increase in soil pH.
However, under high salinity conditions, soil microbial
activity is reduced, causing very minor pH increases. On
the other hand, the buffering capacity of the soil may
contribute to limiting this increase in soil pH.
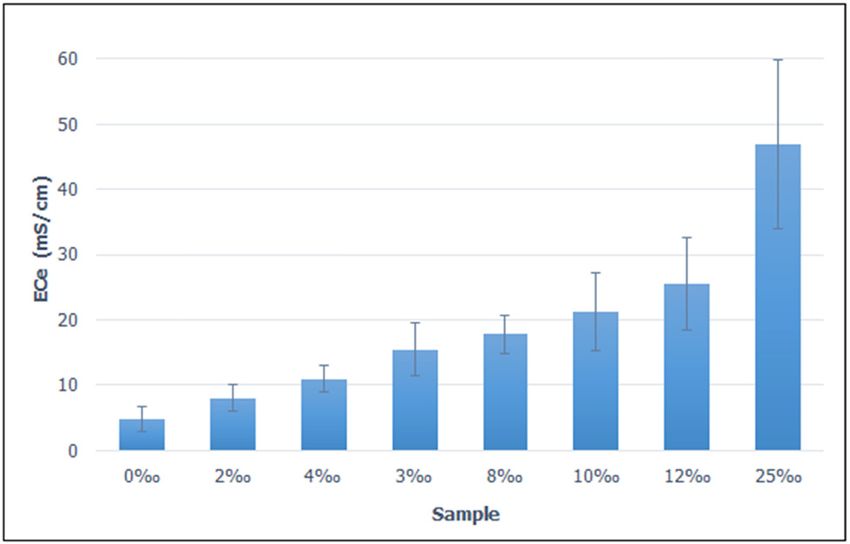
3.2.2 Conductivity of soil (EC)
The results presented in Figure 1 show that, when salinity
increases, conductivity of saline soils also increases sig-
nificantly (Table 5). In some treatments, the period in
which rapid acceleration in salinity occurred may be
lower than 2 weeks. However, after 2 weeks the salinity
is almost unchanged. When the soil was submerged for Figure 1: Effect of saltwater salinity on EC of the saturated paste
2‰ for 2 weeks, the EC of the saturated soil extract extracts (ECe) after 12 weeks of salinity treatment.
Table 4: Changes in soil pH over time due to saltwater intrusion and salt concentration
Experiments Time (weeks) F test LSD (5%) CV%
2 4 6 12
0‰ 5.21abB 5.14bA 5.64aAB 5.72A * 1.7 6.2
2‰ 5.32aB 5.46aAB 5.43abAB 5.78A * 1.6 8.7
4‰ 5.33a 5.27ab 5.34ab 5.49 ns 5.1 6.7
6‰ 5.06abB 5.07bAB 5.30abAB 5.56A * 1.4 10.7
8‰ 5.33a 5.10b 5.35ab 5.48 ns 5.2 4.8
10‰ 4.86b 5.11b 5.45ab 5.55 ns 3.4 11.3
12‰ 4.46b 4.53c 5.22b 5.34 ns 4.4 5.4
25‰ 4.08b 4.44c 5.14b 5.28 ns 7.9 8.8
F-test * * * ns
LSD (5%) 0.56 0.27 0.33 0.56
CV% 6.96 3.70 4.28 6.96
Notes: Lowercase letters indicate Tukey’s test between salinity treatments. Upper letters indicate Tukey’s test over time. The same letters in
the same column or row indicated no significant difference. ns: undifferentiated; (*): difference with significance level of 5%.Salinity on changes in characteristics of soils of the Mekong Delta, Vietnam 475
Table 5: The EC (1:2.5) change in soil according to salinity and salinity duration
Experiments Time (weeks) F test LSD (5%) CV%
2 4 6 12
Control 1.31g 1.48g 1.47h 1.28h ns 6.6 15.0
2‰ 2.19f 1.91g 2.12g 2.40g ns 11.2 13.9
4‰ 2.68f 2.49f 3.05f 3.10f ns 16.3 13.7
6‰ 3.17fA 3.54eA 3.72eAB 3.83eA * 2.4 9.1
8‰ 4.42d 4.35d 4.81d 4.49d ns 10.2 7.4
10‰ 5.41c 5.49c 5.56c 5.61c ns 3.4 4.4
12‰ 6.21b 6.57b 6.29b 6.60b ns 3.6 7.4
25‰ 11.52a 12.12a 11.75a 12.39a ns 11.9 4.9
F * * * *
LSD (5%) 0.51 0.55 0.37 0.39
CV% 8.31 8.41 5.69 5.37
Notes: Lowercase letters indicate Tukey’s test between salinity treatments. Upper letters indicate Tukey’s test over time. The same letters in
the same column or row indicated no significant difference. ns: undifferentiated; (*): difference with significance level of 5%.
growth and development of crops. Therefore, further mea- soil increases with salinity concentration and the dif-
sures should be taken to improve saline soils [28]. ference is statistically significant. An increase in Na+
exchange results in a higher ESP value. In saline soils,
the percentage of Na in the absorption system (ESP) is
3.2.3 Correlation of EC of soil extract EC (1:2.5) and ECe a numerical value that evaluates the soil sodicization.
When this value exceeds 15%, physicochemical and bio-
Plotting the data of EC (1:2.5) against ECe (Figure 2) logical properties of the soil could be compromised, and
shows a strong correlation (R2 = 0.95**) between two crop nutrition could be impaired. The analysis results
variables. The estimated equation was EC = 0.302 × ECe + show that when the soil is submerged with a salinity of
0.357. The graph shows that the ECe values are generally 2–4‰, the ESP in the soil was lower than 15%, thus the
higher than the EC values. This is possibly due to higher soil sample was not considered as sodicized. When the
salt concentration of the latter method, which is caused salinity treatment was 6‰, the ESP value of the soil
by involvement of water that led to a moisture of around exceeded the ESP threshold of sodicization, at above
70–80%. According to the evaluation scale of soil sali- 15% (Table 7). When salinity was higher than 6‰, soil pH
nity, ECe value is the standard value to evaluate. How- became lower than 8.5, ECe was higher than 4 mS cm−1, and
ever, to extract saturated soil, an air compression system
is needed to extract saturated water in the soil, which is
time-consuming and may present further difficulties to
the process. Therefore, the availability of a well-esti- 16
mated relationship between ECe and EC (1:2.5) could
14
help predicting ECe values using only EC (1:2.5). From
the data, it was shown that the EC/ECe ratio between 12
EC/ECe varies from 0.27 to 0.44, averaged at 0.32. This 10
EC (1:2,5)
result is consistent with a previous study where 603 acres
8
of saline-rice soil in the Mekong Delta were surveyed,
showing a strong correlation between ECe and EC 1:1.25 6
(R2 = 0.89), with an average EC/ECe ratio of 0.41 [29]. 4 y = 0.302x + 0.357
R² = 0.95**
2 n = 20
3.2.4 Exchangeable sodium and sodicization in soil 0
0 10 20 30 40 50
0
ECe
The results presented in Table 6 show that when the soil
is submerged in saline water, exchangeable Na+ in the Figure 2: Correlation between EC (1:2.5) and ECe saturation extract.476 Lam Van Tan and Tran Thanh
Table 6: Effect of salt concentration and treatment duration on percentage of exchangeable Na (ESP) in the soil
Experiments Time (weeks) F test LSD (5%) CV%
2 4 6 12
Control 2.66e 7.36h 7.08g 6.48g ns 11.30 36.89
2‰ 9.28d 12.74g 8.66g 7.87g ns 13.26 24.89
4‰ 10.86dAB 19.47fA 10.07gB 14.02eAB * 4.20 11.69
6‰ 18.64c 21.65e 14.40e 19.13de ns 15.30 8.16
8‰ 23.53b 24.70d 17.79d 21.54cd ns 12.53 9.19
10‰ 25.54b 27.72c 21.89c 26.50c ns 11.42 7.05
12‰ 25.77b 33.39b 24.64b 35.65b ns 16.20 15.09
25‰ 51.58a 53.05a 42.52a 55.31a ns 13.64 3.27
F * * * *
LSD (5%) 2.97 1.39 2.28 3.93
CV% 9.68 3.80 13.61 12.29
Notes: Lowercase letters indicate Tukey’s test between salinity treatments. Upper letters indicate Tukey’s test over time. The same letters in
the same column or row indicated no significant difference. ns: undifferentiated; (*): difference with significance level of 5%.
ESP (%) was higher than 15, indicating that the soil had nutrient uptake of crops, leading to significantly reduced
become saline sodic [30]. yields [32]. A high concentration of Na+ in the soil results
Thus, when the soil is intruded with salinity at 2‰, in high Na/K, Na/Ca, and Na/Mg ratios, which cause dis-
the soil becomes saline and its ECe will be higher than ruption in nutrient metabolism and protein synthesis.
4 mS/cm. At saltwater intrusion of 6‰, the soil begins to Therefore, it is necessary to take measures to reduce sali-
become saline sodic because its ESP reaches as high as nity through saline washing and reduce Na+ in soil as
18%, according to the classification sodic saline soils well as Na+ saturated in the absorption complex.
[12,31]. In general, plants are adversely affected by sali-
nity, and the detriment becomes especially worse in
saline sodic soils due to impeded absorption of water 3.2.5 Available nitrogen content in soil
and nutrients of plants, which is caused by the high
osmotic pressure of the soil solution. Crops that are The available nitrogen content in soil after 2 weeks
affected by salinity and saline sodic soils manifest as of saltwater treatment decreased significantly compared
dehydrated, drought-affected plants. High Na+ salt con- to that of the control sample. The protein content
centration causes nutrient imbalance and hinders the was increasing with salt concentration at low salinity.
Table 7: Effect of salt concentration and treatment duration on exchangeable Na (cmol/kg) in soil
Experiments Time (weeks) F test LSD (5%) CV%
2 4 6 12
Control 0.34eB 0.94hA 0.9gC 0.82gC * 0.40 54.4
2‰ 1.18dA 1.62gA 1.1gB 1.00gA * 1.50 26.3
4‰ 1.38dB 2.47fA 1.28gC 1.78eB * 0.60 30.8
6‰ 2.37cA 2.75eA 2.01dB 2.43deA * 0.46 9.8
8‰ 2.99bA 3.14dA 2.26dB 2.74deA * 0.32 7.1
10‰ 3.24bA 3.52cA 2.78cB 3.37cA * 0.41 7.5
12‰ 3.27bA 4.24bA 3.13bB 4.53bA * 1.30 15.2
25‰ 6.55aB 6.74aA 5.4aB 7.03aA * 0.42 1.8
F * * * *
LSD (5%) 0.38 0.14 0.29 0.49
CV% 9.99 3.16 13.62 12.29
Notes: Lowercase letters indicate Tukey’s test between salinity treatments. Upper letters indicate Tukey’s test over time. The same letters in
the same column or row indicated no significant difference. ns: undifferentiated; (*): difference with significance level of 5%.Salinity on changes in characteristics of soils of the Mekong Delta, Vietnam 477
However, as the salt concentration increases above 3.2.6 Content of available phosphorus in soil
10‰, the nitrogen content in saline soils significantly
decreases (Table 8). After 4–6 weeks of salinity treatment, The analytical results presented in Table 9 show that the
the available nitrogen content significantly increased. available phosphorus content in the soil is very poor. The
However, prolonging the treatment for more than 6 weeks phosphorus available in the soil tends to increase with
causes the available nitrogen content to decline. This extended saline period tends to decrease when the sali-
result shows that despite the salinity, microbiological nity increases more than 12‰. This shows that the phos-
activity in the mineralization process of nitrogen still phorus available in saline soils is very low because phos-
occurs over time and that soil microorganisms can adapt phate anions can be precipitated by reacting with Ca2+
to a change from fresh to saline stage of the soil environ- and Mg2+ cations, which are abundant in saltwater. From
ment, thus promoting the mineralization of nitrogen this result, it could be observed higher salinity seemed to
[33,34]. associate with lower phosphorus available in the soil,
It has been shown that increased salinity stress could which is nutritionally disadvantageous for crops.
lead to smaller microbial community, less metabolic effi- According to the Vietnamese standards of soils quality –
ciency, and worsened activity of extracellular enzymes index values of total phosphorus content in the soils of
such as b-glucosidase, alkaline phosphatase, and aryl- Vietnam (TCVN 7374: 2004) for each soil type is as follows:
sulfatase [35]. The exponentially negative relationships The results show that the study area consists of
between the number of microbial communities and con- mostly saline soil (65.1%) and acid sulfate soil (5.09%),
centrations of dissolved salts could be elaborated the rest belongs to insignificant alluvial soil (1.13%).
through two main mechanisms: the osmotic effect and Corresponding to the standards of phosphorus quality
the effect of specific ions. While the salinity-induced limit in soil, saline soil has phosphorus content of about
osmotic stress could reduce microbial mass mainly 0.08–0.20% (corresponding to 0.08–0.20 mg/kg of soil)
through cell drying and lysis, the effect of ion mainly and alkaline soil. The amount of phosphorus is about
involves higher energy consumption of microbes to 0.03–0.08 (0.03–0.08 mg/kg soil, respectively). From the
synthesize more organic osmolytes, such as proline and results of Table 10, it shows that the phosphorus content of
glycine betaine, which are required for ameliorating the the soil samples is at medium to fair level compared to the
stress effects [36]. Such energy waste might lead to Vietnamese standard for soil groups.
reduced microbial growth [37]. In addition, fungi tend According to the salinity scale described by Landon,
to be more susceptible than bacteria to salt stress [38,39]. the soil having ECe ranging from 8.22 to 13.11 mS cm−1
As a result, increased salinity may also affect the fungi– was classified as saline soil [41]. Generally, high ECe
bacteria community structure [38,40]. might impair the growth of most rice varieties, especially
Table 8: Changes in the value of available nitrogen (mg/kg) in the soil over the time of salinity and salt concentration
Experiments Time (weeks) F test LSD (5%) CV%
2 4 6 12
Control 26.43bC 77.68aA 72.54A 50.29bB * 0.50 40.5
2‰ 20.66cdC 73.74abA 73.71A 50.27bB * 0.30 40.0
4‰ 22.15bcdC 67.18bAB 81.17A 56.69aB * 0.43 41.9
6‰ 20.40cdC 69.95abA 70.37A 55.48abB * 0.12 39.6
8‰ 25.16bcC 68.53abA 78.64A 56.65aB * 0.30 37.1
10‰ 31.95aC 72.91abA 78.61A 56.90aB * 0.10 38.4
12‰ 17.39dC 72.92abA 75.15A 54.17abB * 0.40 42.5
25‰ 19.76dC 74.62abA 75.12A 53.76abB * 0.50 43.1
F * ns ns *
LSD (5%) 5.26 10.09 11.95 5.77
CV% 15.69 9.58 10.82 7.29
Notes: Lowercase letters indicate Tukey’s test between salinity treatments. Upper letters indicate Tukey’s test over time. The same letters in
the same column or row indicated no significant difference. ns: undifferentiated; (*): difference with significance level of 5%.478 Lam Van Tan and Tran Thanh
Table 9: Effect of salinity treatment duration and available phosphorus concentration (mg/kg) in soil
Experiments Time (weeks) F test LSD (5%) CV%
2 4 6 12
Control 0.13abC 0.34aAB 0.37aA 0.24aBC * 0.30 41.7
2‰ 0.20a 0.26ab 0.28bcd 0.23a ns 14.21 26.5
4‰ 0.08bB 0.21abA 0.29bA 0.22aA * 0.32 47.0
6‰ 0.12ab 0.23ab 0.29bc 0.16b ns 12.30 68.4
8‰ 0.15ab 0.14b 0.21d 0.17b ns 19.50 28.8
10‰ 0.15ab 0.18ab 0.22cd 0.16b ns 11.45 33.9
12‰ 0.10bB 0.16bAB 0.25bcdB 0.19abAB * 0.40 39.7
25‰ 0.11bB 0.18abAB 0.21cdA 0.19abAB * 1.30 34.1
F * * * *
LSD (5%) 0.07 0.06 0.06 0.04
CV% 44.13 53.42 18.11 14.41
Notes: Lowercase letters indicate Tukey’s test between salinity treatments. Upper letters indicate Tukey’s test over time. The same letters in
the same column or row indicated no significant difference. ns: undifferentiated; (*): difference with significance level of 5%.
at the young seedling the reproductive stage [42]. On the which phosphorus affects rice productivity is similar to
other hand, the response of rice plant to salinity might be that of nitrogen [53]. Therefore, the application of organic
different depending on the variety and the salinity level fertilizers, which are rich in nitrogen and phosphorus,
and maximum tolerable salinity might be high as much could be considered as a suitable salinity-coping mea-
as 4‰ [43]. Therefore, suggested strategies to improve sure in saline rice paddy fields.
the tolerance of rice might include adoption of salinity-
tolerant varieties and supplementation of Ca2+ or lime to
balance Na+ [44–46].
Available nitrogen and phosphorus are important 4 Conclusion
indicators in evaluating the capability of soil in providing
organic nutrients [47]. Previous reports have shown that This study simulated the effect of salinity intrusion on
the available nitrogen largely determines rice produc- some soil characteristics under laboratory conditions.
tivity [48,49], possibly via mediation of its demands for Obtained results indicate that prolonged exposure to sali-
macronutrients [50]. According to Wood and Lass, low nity caused evident consequences to soils. After 2 weeks
available nitrogen is indicative of limited organic nutri- of salinity treatment with a concentration of 4‰, the soil
ents, which is the main causes for low productivity of rice became saline. With 6 weeks of treatment, sodicization
growing in saline soils [51]. Elevated salinity also lowers occurred. For sustainable farming of rice and corn, the
available nitrogen through mineralization and increased soil salinity is recommended not to exceed 4‰; and
mortality of microorganisms, in turn leading to the defi- higher salinity might significantly cause deficiency in
ciency of rice nutrient intake [52]. The mechanism by nutrients, particularly available nitrogen and phosphorus.
The recommended measures for sustainable rice cultiva-
tion in the saline soil include adoption of salinity-tolerant
Table 10: The phosphorus content limitations for each soil type
varieties and administration of lime, which is a source of
Ca2+ that could indirectly balance Na+ in salted rice plants,
Soil group Total phosphorus (P2O5 %)
and organic fertilizers. In addition, the development of
Value range Average diversified farming model is advised to cope with different
1. Red soil From 0.05 to 0.60 0.30 salinity levels in the region.
2. Alluvial soil From 0.05 to 0.30 0.10
3. Faded gray soil From 0.03 to 0.06 0.04 Funding information: This research was funded by Nguyen
4. Acid sulfate soil From 0.03 to 0.08 0.04 Tat Thanh University, Ho Chi Minh City, Vietnam and
5. Salty soil From 0.08 to 0.20 0.09
Ben Tre Department of Science and Technology, Ben Tre
6. Coastal sandy soil From 0.03 to 0.05 0.04
Province, Vietnam.Salinity on changes in characteristics of soils of the Mekong Delta, Vietnam 479
Author contributions: Lam Van Tan is in charge of con- [15] Balba AM. Management of problem soils in arid ecosystems
ceptualization, investigation, writing of the original draft; [Internet]. 1st edn. Boca Raton, USA: CRC Press; 2018 [cited
and Tran Thanh was involved in investigation. 2020 Jul 3]. Available from: https://www.taylorfrancis.com/
books/9781351434218
[16] Bauder T, Waskom R, Davis J. Irrigation water quality criteria.
Conflict of interest: The authors declare no conflict of Colorado: Colorado State University; 2004. Available from:
interest. https://extension.colostate.edu/topic-areas/agriculture/
irrigation-water-quality-criteria-0-506/
Data availability statement: The data used to support the [17] Sheldon A, Menzies NW, So HB, Dalal R. The effect of salinity
on plant available water. SuperSoil 2004: 3rd Australian New
results in this study are available from the corresponding
Zealand Soils Conference. Australia: University of Sydney; 5–9
author upon request. December 2004.
[18] Bauder TA, Davis JG, Waskom RM. Managing saline soils. Fact
sheet (Colorado State University. Extension); 2004. Crop
series; no. 0.503. Available from: https://mountainscholar.
References org/bitstream/handle/10217/182968/AEXT_005032014.pdf
[19] Gianello C, Bremner JM. Comparison of chemical methods of
assessing potentially available organic nitrogen in soil.
[1] Schmidt C. Alarm over a sinking delta. Science. 2015 May Commun Soil Sci Plant Anal. 1986 Feb 1;17(2):215–36.
22;348(6237):845–6. doi: 10.1080/00103628609367709.
[2] Liu JP, DeMaster DJ, Nguyen TT, Saito Y, Nguyen VL, Ta TKO, [20] Olsen SR. Estimation of available phosphorus in soils by
et al. Stratigraphic formation of the mekong river delta and its extraction with sodium bicarbonate (No. 939). US Department
recent shoreline changes. Oceanography. 2017;30(3):72–83. of Agriculture; 1954.
[3] Li X, Liu JP, Saito Y, Nguyen VL. Recent evolution of the Mekong [21] Nelson DW, Sommers LE. Total carbon, organic carbon, and
Delta and the impacts of dams. Earth-Sci Rev. 2017 organic matter. In: Page AL, editor. Agronomy monographs
Dec;175:1–17. doi: 10.1016/j.earscirev.2017.10.008. [Internet]. Madison, WI, USA: American Society of Agronomy,
[4] FAO. Transboundary River Basin overview – Mekong. Rome, Soil Science Society of America; 2015 [cited 2020 Jul 3].
Italy: FAO; 2011. Available from: http://www.fao.org/ p. 539–79. Available from: http://doi.wiley.com/10.2134/
publications/card/en/c/CA2135EN/ agronmonogr9.2.2ed.c29
[5] Camberato J. Irrigation water quality: update from the 2001 [22] Houba V, Van der Lee J, Novozamsky I, Walinga I. Soil and
Carolinas Golf Course Superintendents Association. Clemson plant analysis, a series of syllabi, part 5, soil analysis
University Turfgrass Program; 2001. p. 1–13. Available from: procedures. Wageningen: Wageningen Agricultural
http://www.scnla.com/Irrigation_Water_Quality.pdf University; 1989.
[6] Brouwer C, Goffeau A, Heibloem M. Irrigation water manage- [23] Allison LE, Bernstein L, Bower CA, Brown JW, Fireman M,
ment: training manual no. 1-introduction to irrigation. Rome, Hatcher JT, et al. Diagnosis and improment of saline and Alkali
Italy: Food and Agriculture Organization of the United Nations; Soils. Washington: United States Salinity Laboratory Staff; 1954.
1985. p. 102–3. Available from: http://www.fao.org/tempref/ [24] Boyd CE, Tucker CS. Pond aquaculture water quality manage-
agl/AGLW/fwm/Manual1.pdf ment [Internet]. Boston, MA: Springer US; 1998 [cited 2020 Jul 3].
[7] Dubey RS. Photosynthesis in plants under stressful condi- Available from: http://link.springer.com/10.1007/978-1-
tions. Handb Photosynth. 1996;859–75. 4615-5407-3
[8] Hasegawa PM, Bressan RA, Zhu J-K, Bohnert HJ. Plant cellular [25] Thu TA, Guong VT. Surveying the quality of soil, water envir-
and molecular responses to high salinity. Annu Rev Plant onment in aquaculture and nutrient accumulation in aquacul-
Physiol Plant Mol Biol. 2000 Jun;51(1):463–99. doi: 10.1146/ ture ponds in two districts of Vinh Chau and My Xuyen in Soc
annurev.arplant.51.1.463. Trang Province. Can Tho: Can Tho University; 2010.
[9] Dudley LM. Salinity in the soil environment. Handbook of plant [26] Marschner H. Marschner’s mineral nutrition of higher plants
and crop stress. New York, USA: Marcel Dekker; 1994. [Internet]. Academic Press, Elsevier; 2012 [cited 2020 Jul 3].
p. 13–30. Available from: https://linkinghub.elsevier.com/retrieve/pii/
[10] McCauley A, Jones C, Jacobsen J. Basic soil properties. Soil C20090630439
Water Manag Module. 2005;1(1):1–12. [27] Brady NC, Weil RR. Soil organic matter. The nature and pro-
[11] USDA. Soil electrical conductivity – soil quality kit. perties of soils. Upper Saddle River, New Jersey: Prentice Hall;
Washington: United States Department of Agriculture; 2010. 1999. p. 446–90.
[12] Abrol IP, Yadav JSP, Massoud FI. Salt-affected soils and their [28] Ladeiro B. Saline agriculture in the 21st century: using salt
management. Rome: Food and Agriculture Organization of the contaminated resources to cope food requirements. J Botany.
United Nations; 1988. p. 131 (FAO soils bulletin). 2012 Aug 9;2012:1–7. doi: 10.1155/2012/310705.
[13] Ağar Aİ. Reclamation of saline and sodic soil by using divided [29] Hung NN. EC extraction method and conversion for the rice-
doses of phosphogypsum in cultivated condition. AJAR. 2011 shrimp saline soils assessment scale in the Mekong Delta
Sep 12;6(18):4243–52. doi: 10.5897/AJAR11.943. (Vietnamese Version). J Agric Rural Dev. 2010;5:45.
[14] Grattan SR, Grieve CM. Salinity–mineral nutrient relations in [30] NRCS. Soil survey division staff (1993) soil survey manual. Soil
horticultural crops. Sci Horticulturae. 1998 conservation service. US Department of Agriculture
Nov;78(1–4):127–57. doi: 10.1016/S0304-4238(98)00192-7. Handbook; 1993.480 Lam Van Tan and Tran Thanh
[31] Ayers RS, Westcot DW. Water quality for agriculture. Vol. 29, [41] Landon JR. Booker tropical soil manual: a handbook for
Rome: Food and Agriculture Organization of the United soil survey and agricultural land evaluation in the tropics
Nations; 1985. and subtropics. Routledge: Booker Agriculture International
[32] Otton JK, Zielinski RA. Characteristics and origins of saline Limited; 2016.
(alkalai) soil in the front range portion of the Western [42] Makihara D, Tsuda M, Morita M, Hirai Y, Kuroda T. Effect of
Denver Basin. Lakewood, Colorado: US Geological salinity on the growth and development of rice(Oryza sativa L.)
Survey; 2000. varieties. Japanese Society for Tropical Agriculture; 1999 [cited
[33] Takai Y, Wada H. Effects of water percolation on fertility of 2021 Feb 7]. doi: 10.11248/jsta1957.43.285.
paddy soils. Proceedings of the international seminar on soil [43] Khang DT, Dung TN, Thai LV, Nam HD, Be VT. Evaluation of alum
environment and fertility management in intensive agricul- tolerance of some MTL rice varieties (Oryza sativa L.)
ture; 1977. (Vietnamese Version). Sci J Can Tho Univ. 2016;44B:86–95.
[34] Kanke B, Kanazawa S. Effect of drainage on soil saccharides [44] Ashraf M, Foolad MR. Roles of glycine betaine and proline in
and microbial activities in poorly drained paddy fields. improving plant abiotic stress resistance. Environ Exp Botany.
Proceedings of the transactions of the 13th international 2007 Mar 1;59(2):206–16.
congress of soil science. Hamburg; 1986. [45] Yokoi S, Quintero FJ, Cubero B, Ruiz MT, Bressan RA,
[35] Rietz DN, Haynes RJ. Effects of irrigation-induced salinity and Hasegawa PM, et al. Differential expression and function of
sodicity on soil microbial activity. Soil Biol Biochem. 2003 Jun Arabidopsis thaliana NHX Na+/H+ antiporters in the salt stress
1;35(6):845–54. response. Plant J. 2002;30(5):529–39.
[36] Sagot B, Gaysinski M, Mehiri M, Guigonis J-M, Le Rudulier D, [46] Khattak SG, Haq IU, Malik A, Khattak MJ, Naveedullah MJ.
Alloing G. Osmotically induced synthesis of the dipeptide Effect of various levels of gypsum application on the recla-
N-acetylglutaminylglutamine amide is mediated by a new mation of salt affected soil grown under rice followed by wheat
pathway conserved among bacteria. Proc Natl Acad Sci USA. crop. Sarhad J Agric. 2007;23(3):675.
2010 Jul 13;107(28):12652–7. [47] Thu TA, Guong VT, Hoa NV. The mineralization of organic
[37] Oren A. The bioenergetic basis for the decrease in metabolic nitrogen in the bottom soil of the artemia pond in Vinh Chau,
diversity at increasing salt concentrations: implications for the Soc Trang. Sci J Can Tho Univ. 2007;7:176–82.
functioning of salt lake ecosystems. In: Melack JM, Jellison R, [48] Nambiar KKM, Ghosh AB. Highlights of research of a long-term
Herbst DB, editors. Saline Lakes: publications from the 7th fertilizer experiment in India (1971–1982). New Delhi, India:
international conference on Salt Lakes, held in Death Valley Indian Agriculture Institute; 1984 (No. REP-7203. CIMMYT).
National Park, California, USA, September 1999 [Internet]. [49] De Datta SK, Gomez KA, Descalsota JP. Changes in yield
Dordrecht: Springer Netherlands; 2001 [cited 2021 Feb 7]. response to major nutrients and in soil fertility under intensive
p. 61–72 (Developments in Hydrobiology). Available from: rice cropping. Soil Sci. 1988;146(5):350–8.
https://doi.org/10.1007/978-94-017-2934-5_6 [50] Dobermann A, Cassman KG. Precision nutrient management in
[38] Gros R, Poly F, Jocteur Monrozier L, Faivre P. Plant and soil intensive irrigated rice systems – the need for another on-farm
microbial community responses to solid waste leachates revolution. Better Crop Int. 1996;10(2):21.
diffusion on grassland. Plant Soil. 2003 Aug 1; [51] Wood GA, Lass RA. Cocoa. Oxford: Blackwell; 2008.
255(2):445–55. [52] Deurer M, Sivakumaran S, Ralle S, Vogeler I, McIvor I,
[39] Wichern J, Wichern F, Joergensen RG. Impact of salinity on soil Clothier B, et al. A new method to quantify the impact of soil
microbial communities and the decomposition of maize in carbon management on biophysical soil properties: the
acidic soils. Geoderma. 2006 Dec 31;137(1):100–8. example of two apple orchard systems in new zealand.
[40] Pankhurst CE, Yu S, Hawke BG, Harch BD. Capacity of fatty acid J Environ Qual. 2008;37(3):915–24.
profiles and substrate utilization patterns to describe differ- [53] Vien DM, Guong VT, Dong NM, Phuong NTK. Using organic
ences in soil microbial communities associated with increased fertilizers from bagasse to improve phosphorus nutrition and
salinity or alkalinity at three locations in South Australia. reduce AC toxicity to acid sulfate soils (Vietnamese Version).
Biol Fertil Soils. 2001 Mar 1;33(3):204–17. Sci J Can Tho Univ. 2006;118–25.You can also read