The importance of mineral determinations to PROFILE base cation weathering release rates: a case study - Biogeosciences
←
→
Page content transcription
If your browser does not render page correctly, please read the page content below
Biogeosciences, 16, 1903–1920, 2019
https://doi.org/10.5194/bg-16-1903-2019
© Author(s) 2019. This work is distributed under
the Creative Commons Attribution 4.0 License.

The importance of mineral determinations to PROFILE base cation
weathering release rates: a case study
Sophie Casetou-Gustafson1 , Cecilia Akselsson2 , Stephen Hillier4,3 , and Bengt A. Olsson1
1 Department of Ecology, Swedish University of Agricultural Sciences (SLU), P.O. Box 7044, 750 07 Uppsala, Sweden
2 Department of Physical Geography and Ecosystem Science, Lund University, Sölvegatan 12, 223 62 Lund, Sweden
3 The James Hutton Institute, Craigiebuckler, Aberdeen, AB15 8QH, UK
4 Department of Soil and Environment, Swedish University of Agricultural Sciences, P.O. Box 7014, 75007 Uppsala, Sweden

Correspondence: Sophie Casetou-Gustafson (sophie.casetou@slu.se)

Received: 21 December 2018 – Discussion started: 18 January 2019
Revised: 18 March 2019 – Accepted: 28 March 2019 – Published: 7 May 2019

Abstract. Accurate estimates of base cation weathering rates    mineralogy will improve the confidence in mineral data in-
in forest soils are crucial for policy decisions on sustain-    put to PROFILE was supported for Flakaliden. However, at
able biomass harvest levels and for calculations of criti-      Asa, site-specific mineralogies reduced the discrepancy for
cal loads of acidity. The PROFILE model is one of the           Na between WA2M and WXRPD but produced larger and sig-
most frequently used methods to quantify weathering rates,      nificant discrepancies for K, Ca and Mg. For Ca and Mg the
where the quantitative mineralogical input has often been       differences between weathering rates based on different min-
calculated by the A2M (“Analysis to Mineralogy”) program        eralogies could be explained by differences in the content of
based solely on geochemical data. The aim of this study was     some specific Ca- and Mg-bearing minerals, in particular am-
to investigate how uncertainties in quantitative mineralogy,    phibole, apatite, pyroxene and illite. Improving the accuracy
originating from modeled mineral abundance and assumed          in the determination of these minerals would reduce weath-
stoichiometry, influence PROFILE weathering estimate, by        ering uncertainties. High uncertainties in mineralogy, due for
using measured quantitative mineralogy by X-ray powder          example to different A2M assumptions, had surprisingly lit-
diffraction (XRPD) as a reference. Weathering rates were        tle effect on the predicted weathering of Na- and K-bearing
determined for two sites, one in northern (Flakaliden) and      minerals. This can be explained by the fact that the weather-
one in southern (Asa) Sweden. At each site, 3–4 soil profiles   ing rate constants for the minerals involved, e.g. K feldspar
were analyzed at 10 cm depth intervals. Normative quantita-     and micas, are similar in PROFILE. Improving the descrip-
tive mineralogy was calculated from geochemical data and        tion of the dissolution rate kinetics of the plagioclase mineral
qualitative mineral data with the A2M program using two         group as well as major K-bearing minerals (K feldspars and
sets of qualitative mineralogical data inputs to A2M: (1) a     micas) should be a priority to help improve future weathering
site-specific mineralogy based on information about mineral     estimates with the PROFILE model.
identification and mineral chemical composition as deter-
mined directly by XRPD and electron microprobe analysis
(EMPA), and (2) regional mineralogy, representing the as-
sumed minerals present and assumed mineral chemical com-        1   Introduction
positions for large geographical areas in Sweden, as per pre-
vious published studies. Arithmetic means of the weathering     The dissolution of minerals in soils and rocks during weath-
rates determined from A2M inputs (WA2M ) were generally         ering represents, together with deposition, the most impor-
in relatively close agreement with those (WXRPD ) determined    tant long-term supply of base cations for plant growth that
by inputs based on direct XRPD and EMPA measurements.           also acts as a buffer against soil and water acidification.
The hypothesis that using site-specific instead of regional     Quantifying weathering rates is therefore of key importance
                                                                to guide modern forestry demands on biomass removal by

Published by Copernicus Publications on behalf of the European Geosciences Union.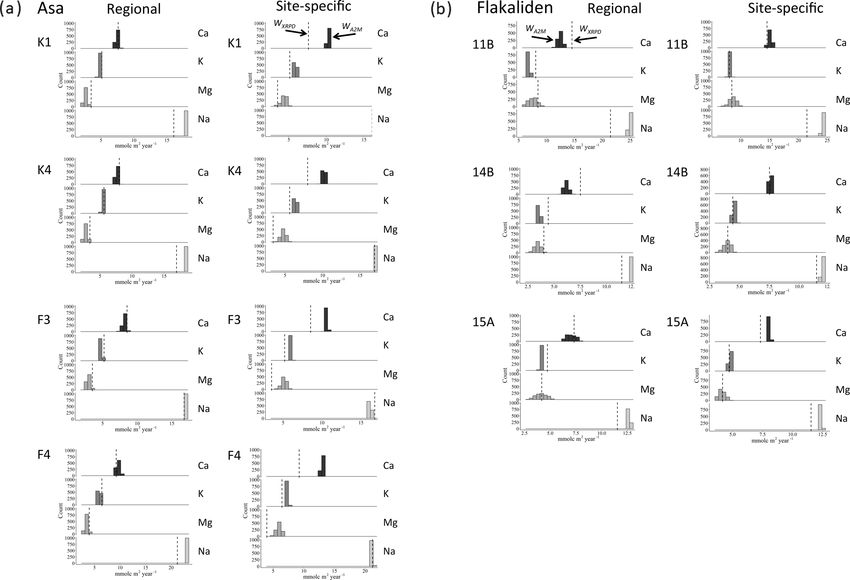
1904                                                                S. Casetou-Gustafson et al.: Base cation weathering rates

helping to identify threshold levels that are sustainable for       tion (i.e., the mineral budgeting approach of Andrist-Rangel
base cation removal from soils and waters. With the intro-          et al., 2006). Nonetheless, we should stress that like all an-
duction of the harvest of forest biomass for energy produc-         alytical methods the determined weight fractions of miner-
tion that includes whole-tree harvest and stump extraction,         als identified in a soil sample by XRPD will have an asso-
about 2–3 times more nutrients are exported from the for-           ciated uncertainty. Additionally, minerals present in minor
est compared to stem-only harvest. As a result, issues of           amounts, nominally < 1 % by weight, may fall below the
acidification and base cation supply are exacerbated and the        lower limit of detection of the XPRD method.
sustainability of this practice is questioned (Röser, 2008; de         Due mainly to the relative ease of measurement and conse-
Jong et al., 2017). Regional nutrient balance calculations for      quent ready availability of total element geochemical data on
Sweden have indicated that net losses of base cations from          soils, indirect methods of determining quantitative soil min-
forest soils can occur in stem-only harvest scenarios, and          eralogy, such as so-called “normative” geochemical calcula-
this trend would be substantially exacerbated and more fre-         tions have been widely used to generate mineralogical data
quent in whole-tree harvesting scenarios, largely due to low        for use in the PROFILE model. One such method is the nor-
weathering rates (Sverdrup and Rosén, 1998; Akselsson et            mative “Analysis to Mineralogy” (A2M) program (Posch and
al., 2007a, b). Furthermore, the same effect occurs both under      Kurz, 2007) that has commonly been used in PROFILE ap-
current and projected future climate conditions (Akselsson et       plications (Stendahl et al., 2013; Zanchi et al., 2014; Yu et al.,
al., 2016).                                                         2016, 2018; Kronnäs et al., 2019). Based on a quantitative
   The weathering rates included in these nutrient balance          geochemical analysis of a soil sample, typically expressed
calculations are in most cases based on the PROFILE model.          in weight percent oxides, as well as on some assessment of
This is a process-oriented model calculating steady-state           the available minerals in the soil sample (minerals present)
weathering rates using transition state theory and physical         and their stoichiometry (chemical compositions), A2M cal-
and geochemical properties of the soil such as temperature;         culates all possible mineralogical compositions for the soil
soil moisture; soil mineralogy and concentrations of base           sample. Thus the A2M output for a given soil sample in-
cation, hydrogen and organic acids (Sverdrup, 1996). This           put has multiple solutions and can be described as a multi-
model has been widely applied in Europe, Canada and the             dimensional mineralogical solution space. This necessitates
US during the last several decades or more of weathering            a choice when using A2M output in applications such as
research (Olsson et al., 1993; Langan et al., 1995; Kolka et        weathering rate studies, the convention for which has been
al., 1996; Starr et al., 1998; Sverdrup and Rosén, 1998; Whit-      to use the geometric mean mineralogical compositions (e.g.
field et al., 2006; Akselsson et al., 2007a; Koseva et al., 2010;   Stendahl et al., 2013). Casetou-Gustafson et al. (2018) com-
Stendahl et al., 2013). In some cases nutrient balance calcu-       pared the output of A2M with directly determined XRPD
lations have also been based on the depletion method (Olsson        mineralogies at two sites, applying A2M in two different
et al., 1993).                                                      ways. In the first case the information on available miner-
   Reliable weathering rate estimates are crucial for the ac-       als in the model input was obtained from direct XRPD min-
curacy of future nutrient budget calculations (Futter et al.,       eral identifications and information on mineral stoichiome-
2012). Regarding the accuracy of the PROFILE model, the             try from direct microprobe analysis of the minerals at the
importance of high accuracy in physical input parameters for        specific site (hereafter denoted “site-specific”). In the sec-
the modeled weathering rate outputs has been highlighted by         ond case the mineral stoichiometry and mineral identity were
Hodson et al. (1996) and Jönsson et al. (1995). Among the           both assumed based on an expert assessment of the proba-
various parameters Hodson et al. (1996) noted that the weath-       ble mineralogy at the regional scale as given by Warfvinge
ering response of the entire soil profile depends critically on     and Sverdrup (1995), hereafter denoted “regional”. Casetou-
its mineralogy and as such any choice of the model user about       Gustafson et al. (2018) concluded that using A2M in com-
mineralogical input data may affect the model outcome sig-          bination with regional input data yielded results with large
nificantly (Hodson et al., 1997). In most cases the mineralog-      deviations from directly (XRPD) measured quantitative min-
ical input to the PROFILE model is also derived by modeling         eralogy, particularly for two of the major minerals, K feldspar
yet little attention has been given to the influence of modeled     and dioctahedral mica. When site-specific mineralogical in-
versus directly measured mineralogical input data on calcu-         put data were used, measured and modeled quantitative min-
lated base cation release rates.                                    eralogy showed a better correspondence for most minerals.
   The most widely used method for direct quantitative min-         For a specific mineral and a specific site, however, the bias
eralogical analysis of soil samples is X-ray powder diffrac-        in determination of quantitative mineralogy might be signifi-
tion, and the accuracy that can be achieved has been demon-         cant depending on the accuracy of input data to A2M, i.e.,
strated in round robin tests, most notably in the Reynolds          total geochemistry and/or mineral stoichiometry (Casetou-
Cup competition (McCarty, 2002; Kleeberg, 2005; Omotoso             Gustafson et al., 2018). Potential errors like these in miner-
et al., 2006, Raven and Self, 2017). Casetou-Gustafson et           alogical input data might be assumed to affect the calculated
al. (2018) made some independent assessment of the accu-            weathering for different base cations significantly.
racy of their own XRPD data by geochemical cross valida-

Biogeosciences, 16, 1903–1920, 2019                                                      www.biogeosciences.net/16/1903/2019/
S. Casetou-Gustafson et al.: Base cation weathering rates                                                                                                   1905

Table 1. Characteristics of the study sites.

                  Site                                                 Asa                            Flakaliden
                  Coordinatesa                                         57◦ 080 N, 14◦ 450 E           64◦ 070 N, 19◦ 270 E
                  Elevation (m a.s.l.)a                                225–250                        310–320
                  Mean annual precipitation (mm)b                      688                            523
                  Mean annual air temperature (◦ C)b                   5.5                            1.2
                  Bedrockc                                             Acidic intrusive rock          Quartz-feldspar-rich sedimentary rock
                  Soil textured                                        Sandy loam                     Sandy loam
                  Type of quaternary depositd                          Sandy loamy till               Sandy loamy till
                  Soil moisture regime (Soil taxonomy)e                Udic                           Udic
                  Soil type (USDA soil taxonomy)e                      Spodosols                      Spodosols
                  Region/provincef                                     3                              1
                a Bergh et al. (2005). b Long-term averages of annual precipitation and temperature data (1961–1990) from the nearest SMHI
                meteorological stations (Asa: Berg; Flakaliden: Kulbäcksliden). c SGU bedrock map (1 : 50 000). d Soil texture based on own particle size
                distribution analysis by wet sieving according to ISO 11277. e USDA Soil Conservation service (2014). f Warfvinge and Sverdrup (1995).

   In the present study, we used the different mineralogical                                   tity and mineral stoichiometry, are more similar to
data from Casetou-Gustafson et al. (2018) to model weath-                                      the reference weathering rates than PROFILE runs ob-
ering rates of soils with the PROFILE model. Rates calcu-                                      tained with normative quantitative mineralogy calcu-
lated based on measured mineral abundances using quantita-                                     lated based on regional information only.
tive XRPD in combination with measured mineral elemen-
                                                                                            2. Over- and underestimations of weathering rates of dif-
tal compositions are taken as “reference” weathering rates to
                                                                                               ferent base cations by the PROFILE model can be ex-
which other rates are compared. Samples for this study were
                                                                                               plained by over- or underestimations of mineral con-
collected from podzolized till soils from eight soil profiles
                                                                                               tents of a few specific minerals.
at two forest sites in northern and southern Sweden, respec-
tively.
   The primary objective of this study was to describe and                              2     Materials and methods
quantify the effect of differences in mineralogy input on
PROFILE weathering rates, leaving all other input parame-                               2.1     Study sites
ters of the PROFILE model constant to isolate the effects of
variation in input of mineral stoichiometry and abundance.                              Two experimental forest sites, Asa in southern and Flakali-
The first specific aim was to determine the uncertainties in                            den in northern Sweden, were used for the study (Table 1).
weathering rates caused by uncertainties in normative quanti-                           Both sites have Norway spruce (Picea abies (L.) Karst)
tative mineralogy. This was approached by comparing PRO-                                stands of uniform age, but differ in climate. Flakaliden is
FILE runs using modeled mineralogies based on the presence                              located in the boreal zone with long cold winters, whereas
of minerals of a specific site or a larger geographic region                            Asa is located in the hemiboreal zone. The soils have similar
(i.e., site-specific and regional mineralogy) with PROFILE                              texture (sandy loamy till), soil types (Spodosols) and mois-
runs using the directly measured mineralogy. The latter was                             ture conditions. According to the geographical distribution
assumed to represent the “true” mineralogy at each site. The                            of mineralogy types in Sweden the sites belong to different
comparison of PROFILE weathering rates, based on XRPD                                   regions (Warfvinge and Sverdrup, 1995). The experiments,
versus A2M mineralogy, was done using 1000 random solu-                                 which started in 1986, aimed at investigating the effects of
tions per sample from the entire multidimensional A2M min-                              optimized water and nutrient supply on tree growth and car-
eralogical solution space. In the following, weathering rates                           bon cycling in Norway spruce forests (Linder, 1995; Albaugh
calculated by PROFILE based on XRPD and A2M mineralo-                                   et al., 2009). The sites are incorporated in the Swedish Infras-
gies are denoted WXRPD and WA2M , respectively.                                         tructure for Ecosystem Science (SITES).
   A second specific aim was to investigate how the over- or
                                                                                        2.2     Soil sampling and stoniness determination
underestimation of WA2M in relation to WXRPD mirrors the
over- or underestimation of mineral contents estimated with                             Soil sampling was performed in October 2013 and
A2M.                                                                                    March 2014 in the border zone of four plots each of the sites.
   The following hypotheses were made:                                                  Plots selected for sampling were untreated control plots (K1
  1. PROFILE weathering rates obtained with normative                                   and K4 at Asa, 10B and 14B at Flakaliden) and fertilized “F”
     quantitative mineralogy, calculated based on site-                                 plots (F3 and F4 at Asa, 15A and 11B at Flakaliden). A ro-
     specific mineralogical information about mineral iden-                             tary drill was used in order to extract one intact soil core per

www.biogeosciences.net/16/1903/2019/                                                                                   Biogeosciences, 16, 1903–1920, 2019
1906 S. Casetou-Gustafson et al.: Base cation weathering rates
plot (17 cm inner diameter) expect for plots K4, F3 and F4 identified mineral components. The chemical composition of
at the Asa site. A 1 m × 1 m soil pit was excavated at each the various minerals present in the soils was determined by
of the three latter plots due to inaccessible terrain for forest electron microprobe analysis (EMPA) (Table S6).
machinery. The maximum mineral soil depth varied between
70 and 90 cm in Flakaliden and between 90 and 100 cm in 2.5.2 Calculated mineralogy
Asa.
The volume of stones and boulders was determined with The A2M program (Posch and Kurz, 2007) was used to cal-
the penetration method by Viro (1952), and by applying pen- culate quantitative mineralogical composition (MA2M ) from
etration data to the functions by Stendahl et al. (2009). A geochemical data. Based on a set of pre-determined data
metal rod was penetrated at 16 points per plot into the soil on mineral identity and stoichiometry, the model outcome
until it was not possible to penetrate the underground any fur- is a range of equally possible mineralogical compositions.
ther, or to the depth 30 cm. There was a higher average stoni- The multidimensional structure of this normative mineral-
ness at Flakaliden than Asa (39 % vol compared to 29 % vol ogy model is a consequence of the number of minerals larger
in Asa) that could partially explain the lower maximum sam- than the number of analyzed elements, where a specific el-
pling depth at Flakaliden. ement can often be contained in several different minerals.
A system of linear equations is used to construct an M–N
2.3 Sample preparation dimensional solution space (dimension M = number of min-
erals, dimension N = number of oxides). In this study we
Soils samples for chemical analyses were taken at 10 cm used 1000 solutions to cover the range of possible quantita-
depth intervals in the mineral soil. Prior to analysis all soil tive mineralogies that may occur at a specific site.
samples were dried at 30–40 ◦ C and sieved at 2 mm mesh. A2M was used to calculate 1000 quantitative mineralo-
Soil chemical analyses were performed on the fine-earth frac- gies each for two different sets of mineral identity and ele-
tion (< 2 mm). ment stoichiometry, MA2M-reg (regional) and MA2M-site (site-
specific). Regional mineralogy refers to the mineral identity
2.4 Analysis of geochemistry, total carbon and soil and stoichiometry for the four major mineralogical provinces
texture in Sweden as suggested by Warfvinge and Sverdrup (1995),
of which Asa and Flakaliden belong to different regions (Ta-
Total carbon was determined using a LECO elemental ana-
ble S5). Site-specific mineralogy refers to the measured min-
lyzer according to ISO 10694. Analysis of total geochemical
eral identity and stoichiometry determined by the XRPD and
composition, conducted by ALS Scandinavia AB, was car-
electron microprobe analyses of the two sites (Table S6)
ried out by inductively coupled plasma spectrometry (ICP-
(Casetou-Gustafson et al., 2018).
MS). Prior to analyses, the samples were ignited at 1000 ◦ C
to oxidize organic matter and ground with an agate mor-
2.6 Estimation of weathering rates with PROFILE
tar. Particle size distribution was analyzed by wet sieving
and sedimentation (Pipette method) in accordance with ISO
2.6.1 PROFILE model description
11277. More detail about the analytical procedure was given
by Casetou-Gustafson et al. (2018).
The biogeochemical PROFILE model can be used to study
2.5 Determination of quantitative mineralogy the steady-state weathering (i.e., stoichiometric mineral dis-
solution) of soil profiles, as weathering is known to be pri-
A detailed description of methods used to quantify mineral- marily determined by the physical soil properties at the inter-
ogy of the samples was given by Casetou et al. (2018) and face of wetted mineral surfaces and the soil solution. PRO-
these are described in brief below. FILE is a multilayer model, and thus, for each soil layer,
parameters are specified based on field measurements and
2.5.1 Measured mineralogy estimation methods (Warfvinge and Sverdrup, 1995). Fur-
thermore, isotropic, well mixed soil solution conditions are
Quantitative soil mineralogy was determined with the X-ray assumed to prevail in each layer as well as surface limited
powder diffraction technique, XRPD (MXRPD ) (Hillier, 1999, dissolution in line with early views by Aagard and Helge-
2003) (Table S1a, b). Preparation of samples for determina- son (1982) and Cou and Wollast (1985) (Sverdrup, 1996).
tion of XRPD patterns was made from spray-drying slurries Based on these major assumptions, PROFILE calculates
of micronized soil samples (< 2 mm) in ethanol. Quantita- chemical weathering rates from a series of kinetic reactions
tive mineralogical analysis of the diffraction data was per- that are described by laboratory-determined dissolution rate
formed using a full pattern fitting approach (Omotoso et al., coefficients and soil solution equilibria (i.e., transition state
2006). In the fitting process, the measured diffraction pat- theory) (Sverdrup and Warfvinge, 1993). The PROFILE ver-
tern is modeled as a weighted sum of previously recorded sion (September 2018) that was used in this study is coded to
and carefully verified standard reference patterns of the prior produce information on the weathering contribution of spe-
Biogeosciences, 16, 1903–1920, 2019 www.biogeosciences.net/16/1903/2019/S. Casetou-Gustafson et al.: Base cation weathering rates 1907
Table 2. PROFILE parameter description .
Parameter Description Unit Source
Temperature Site ◦C Measurements from nearby SMHI stations
Precipitation Site m yr−1 Measurements from nearby SMHI stations
Total deposition Site mmolc m−2 yr−1 Measurements of open field and throughfall deposition available from
nearby Swedish ICP Integrated Monitoring Sites
BC net uptake Site mmolc m−2 yr−1 Previously measured data from Asa and Flakaliden: element concentra-
tion in biomass from Linder (unpublished data); biomass data from
Heureka simulations
N net uptake Site mmolc m−2 yr−1 Previously measured data from Asa and Flakaliden: element concentra-
tion in biomass from Linder (unpublished data); biomass data from
Heureka simulations
BC in litterfall Site mmolc m−2 yr−1 Literature data for element concentrations from Hellsten et al. (2013)
N in litterfall Site mmolc m−2 yr−1 Literature data for element concentrations from Hellsten et al. (2013)
Evapotranspiration Site Fraction Own measurements and measurements from nearby Swedish Integrated
Monitoring Sites
Mineral surface area Soil m2 m−3 Own measurements used together with Eq. (5.13) in Warfvinge and
Sverdrup (1995)
Soil bulk density Soil kg m−3 Own measurements
Soil moisture Soil m3 m−3 Based on paragraph 5.9.5 in Warfvinge and Sverdrup (1995)
Mineral composition Soil Weight fraction Own measurements
Dissolved organic Soil mg L−1 Previously measured data from Asa and Flakaliden: measurements for
carbon B horizon from Harald Grip and previously measured data from
Fröberg et al. (2013)
Aluminum solubility Soil kmol m−3 Own measurements for total organic carbon and oxalate extractable alu-
coefficient minum together with function developed from previously published
data (Simonsson and Berggren, 1998)
Soil solution CO2 Soil atm Based on paragraph 5.10.2 in Warfvinge and Sverdrup (1995)
partial pressure
cific minerals, which allowed us to test our second hypothe- 2014). This simplification was done in order to avoid hav-
sis. This version is based on the weathering rates of 15 min- ing a number of minerals containing different amounts of Ca
erals. Of these, apatite, pyroxene, illite, dolomite and calcite and Na, as a result of plagioclase forming a continuous solid
were not found at the two study sites according to XRPD data solution series, since it would not affect the weathering rates.
(Table S1). The physical soil-layer-specific parameters, which were
kept constant between different profile runs, were exposed
2.6.2 PROFILE parameter estimation mineral surface area, stoniness, soil bulk density and soil
moisture (Table 2). Exposed mineral surface area was esti-
The only parameter that was changed between differ- mated from soil bulk density and texture analyses in com-
ent PROFILE runs was the quantitative mineralogy for bination with an algorithm specified in Warfvinge and Sver-
each soil layer, as described above. Hence, PROFILE esti- drup (1995) and critically discussed in Hodson et al. (1998).
mated weathering rates (W ) based on measured mineralogy The volumetric field soil water content in Flakaliden and
(WXRPD ), and the two versions of A2M calculated mineral- Asa was estimated to be 0.25 m3 m−3 according to the mois-
ogy, regional (WA2M-reg ), and site-specific (WWA2M-site ). In ture classification scheme described in Warfvinge and Sver-
the regional mineralogy, plagioclase is assumed to occur as drup (1995). It was used to describe the volumetric water
pure anorthite and pure albite for simplification, as has been content for each soil pit.
done in previous studies (Stendahl et al., 2013; Zanchi et al.,
www.biogeosciences.net/16/1903/2019/ Biogeosciences, 16, 1903–1920, 20191908 S. Casetou-Gustafson et al.: Base cation weathering rates
Another group of parameters kept constant was chemical tree biomass (i.e., bark, stemwood, living and dead branches,
soil-layer-specific parameters. The aluminum solubility co- needles) was estimated as the average accumulation rate over
efficient needed for solution equilibrium reactions, defined a 100-year rotation length in Flakaliden compared to a 73-
as log{Al3+ } + 3 pH, was estimated by applying a function year rotation length in Asa. These calculations were based on
developed from previously published data (Simonsson and Heureka simulations using the StandWise application (Wik-
Berggren, 1998) to our own total carbon and oxalate ex- ström et al., 2011) for biomass estimates in combination with
tractable aluminum measurements. The function is based on measured nutrient concentrations in above-ground biomass
the finding that the Al solubility in the upper B horizon of (Sune Linder, unpublished data, 2019).
podzols is closely related to the molar ratio of aluminum to
carbon in pyrophosphate extracts, and that below the thresh- 2.7 A definition of significant discrepancies between
old value of 0.1, Al solubility increases with the Alp /Cp ra- WA2M and WXRPD
tio (Simonsson and Berggren, 1998). Thus, a function was
developed for application to our own measurements of Alox A consequence of the mathematical structure of the A2M
and Ctot based on the assumption that it is possible to use the program is that the final solution space of possible quanti-
Alox /Ctot ratio instead of the Alp /Cp ratio. Data on soil so- tative mineralogies produces an uncertainty range of weath-
lution dissolved organic carbon (DOC) were available from ering estimates, but in a different sense than the uncer-
lysimeters installed at 50 cm depth for plot K4 and K1 in tainty caused by uncertainties in chemical analyses for ex-
Asa and 10B and 14B in Flakaliden, and these values were ample, because all mineralogies produced within this range
also applied to soil depths below 50 cm (Harald Grip, un- are equally likely. Thus, here we define a significant discrep-
published data, 2019). The E horizon (0–10 cm at Flakali- ancy between WXRPD and WA2M as occurring when the for-
den) and A horizon (0–10 cm at Asa) were characterized by mer is outside the range of the latter, as illustrated in Fig. 1a.
higher DOC values based on previous findings (Fröberg et The opposite case is a nonsignificant discrepancy, when the
al., 2013) and the classification scheme of DOC in Warfvinge weathering rates based on XPRD are contained in the weath-
and Sverdrup (1995). Partial CO2 pressure values in the soil ering range based on A2M (Fig. 1b).
were taken from the default estimate of Warfvinge and Sver- The uncertainty range of WA2M can potentially be reduced
drup (1995). by reducing uncertainties in analyses of soil geochemistry
Other site-specific parameters that were kept constant be- but most particularly by definitions of available minerals
tween PROFILE runs were evapotranspiration, temperature, and their stoichiometry. Furthermore, some discrepancies be-
atmospheric deposition, precipitation, runoff and nutrient up- tween WXRPD and WA2M might also arise due to limitations
take. Temperature is one of the important factors that reg- of the XRPD method, particularly when minerals occur near
ulate the weathering rate, and for steady-state calculations or below the detection limit.
in PROFILE the mean annual temperature is used. Kronnäs
2.8 Statistical analyses
et al. (2019) demonstrates how weathering rates varies be-
tween seasons, due to variations in temperature for exam- In order to quantify the effect of mineralogy on PROFILE
ple. Precipitation is used in PROFILE to calculate vertical weathering rates two statistical measures were used to de-
water flow through the soil profile. The main effect of pre- scribe the discrepancies between WXRPD and WA2M . Firstly,
cipitation on weathering rates is its impact on soil moisture, root mean square errors (RMSEs) of the differences between
but in PROFILE soil moisture is not internally modeled, but WXRPD and the arithmetic mean of weathering rates based
given as input. An estimate of the average evaporation per on regional and site-specific mineralogy, i.e., WA2M-reg and
site was derived from annual averages of precipitation and WA2M-site , were calculated:
runoff data using a general water balance equation. Depo-
sition data from two sites of the Swedish ICP Integrated
r
1 n 2
Monitoring catchments, Aneboda (for Asa) and Gammtratten RMSE = 6i=1 WXRPDi − WA2Mi . (1)
n
(for Flakaliden) (Löfgren et al., 2011), were used to calcu-
late the total deposition. The canopy budget method of Stae- RMSEs were calculated individually for each element, soil
lens et al. (2008) was applied as in Zetterberg et al. (2014) layer and soil profile for two data sets. An RMSE express-
for Ca2+ , Mg2+ , K+ and Na+ . The canopy budget model is ing the error of the aggregated, total weathering rates in the
commonly used for elements that are prone to canopy leach- 0–50 cm soil horizon was calculated to test our first hypoth-
ing (Ca2+ , Mg2+ , K+ , Na+ , SO2− +
4 ) or canopy uptake (NH4 , esis (RMSE of total weathering). In addition, an RMSE ex-
−
NO3 ) and calculates the total deposition (TD) as the sum of pressing the errors originating from discrepancies between
dry deposition (DD) and wet deposition (WD). Wet deposi- WXRPD and WA2M for individual minerals was also calcu-
tion was estimated based on the contribution of dry deposi- lated (RMSE of weathering by mineral). In the latter case,
tion to bulk deposition, both for base cations and anions, us- sums of RMSEs by mineral were calculated for each element
ing dry deposition factors from Karlsson et al. (2012, 2013). and soil profile by analogy with the summing up of weather-
Base cation and nitrogen accumulation rate in above-ground ing rates for the whole 0–50 cm soil profile.
Biogeosciences, 16, 1903–1920, 2019 www.biogeosciences.net/16/1903/2019/S. Casetou-Gustafson et al.: Base cation weathering rates 1909
Figure 1. The first scenario for describing the effect of mineralogy on weathering rates in the upper mineral soil for a specific soil profile (a)
happens when the PROFILE weathering rate based on XRPD (reference weathering rates) is not contained in the weathering range produced
using PROFILE in combination with the full A2M solution space. There are two possible explanations of why a significant discrepancy
introduces an uncertainty range, i.e., (1) due to uncertainties related to the mineralogical A2M input and (2) due to uncertainties related to the
limitation of the XRPD method itself (i.e., detection limit). The second scenario (b) occurs when the reference weathering rate is contained
in the full A2M weathering span. In this case we speak of “nonsignificant discrepancies”.
Secondly, relative discrepancies (i.e., average percentage with Na > Ca > K > Mg (Table S2). On average, weathering
of over- or underestimation of WA2M compared to WXRPD ) rates of Na, Ca, K and Mg at Asa were 17.7, 8.4, 5.6 and
were calculated as the absolute discrepancy divided by the 3.6 mmolc m−2 yr−1 , respectively. Corresponding figures for
measured value. Flakaliden were of similar magnitude, i.e., 14.8, 9.8, 5.7 and
5.6 mmolc m−2 yr−1 . The variation in weathering rates be-
WA2Mi − WXRPDi tween soil profiles was smaller at Asa than at Flakaliden, as
Relative error = 100 (2)
WXRPDi the standard deviation in relation to the means for different
elements ranged between 0.2 and 2.3 at Asa, and between 2.0
Relative errors were calculated for each site by comparing and 5.7 at Flakaliden (Table S2).
the average sum of WA2M in the upper mineral soil (0–50 cm)
with the sum of WXRPD in the upper mineral soil.
3.2 Comparison between weathering rates based on
Statistical plotting of results was performed using R (ver-
XRPD and A2M mineralogy
sion 3.3.0) (R Core Team, 2016) and Excel 2016.
At Flakaliden, WA2M-site was generally in closer agreement
3 Results with WXRPD than WA2M-reg (Fig. 2b), in line with the first hy-
pothesis. The discrepancies between WXRPD and WA2M were
3.1 Weathering rates based on XRPD mineralogy small and nonsignificant for Mg regardless of the mineral-
ogy input used in A2M, although the estimated discrepan-
Weathering estimates with PROFILE are hereafter presented cies were reduced when site-specific mineralogy was used.
as the sum of weathering rates in the 0–50 cm soil horizon, The use of regional mineralogy in A2M underestimated K
since this soil depth is commonly used in weathering rate release rates compared to WXRPD , and the discrepancy was
studies. Information on individual and deeper soil layers (50– significant. Using site-specific mineralogy resulted in smaller
100 cm) is given in Table S2. and nonsignificant discrepancy for K release rates. A similar
Weathering rates of the base cations based on quantita- response to different mineralogies was revealed for Ca, al-
tive XRPD mineralogy (WXRPD ), i.e., the reference weath- though the result varied more among soil profiles. In contrast
ering rates, were ranked in the same order at both sites, to K and Ca, the release of Na was overestimated by both
www.biogeosciences.net/16/1903/2019/ Biogeosciences, 16, 1903–1920, 20191910 S. Casetou-Gustafson et al.: Base cation weathering rates Figure 2. Comparison of PROFILE weathering rates of base cations (mmolc m−2 yr−1 ) at Asa (a) and Flakaliden (b) sites in the 0–50 cm horizon based on XRPD mineralogy (vertical dashed lines) with PROFILE weathering rates based on 1000 random regional A2M mineralo- gies versus 1000 random site-specific A2M mineralogies. Data presented are from four different soil profiles per site. Regional graph for soil profile 10B at Flakaliden is missing since A2M did not calculate 1000 solutions for soil layer 20–30, due to a “nonpositive solution”. WA2M-site and WA2M-reg compared to WXRPD . The discrepan- base cations at this site. For K, Ca and Mg, WA2M-site overes- cies were significant regardless of the mineralogy input used timated weathering rates and resulted in significant discrep- in A2M, although using site-specific mineralogy slightly re- ancies and larger RMSEs, whereas the discrepancies for Na duced the discrepancy. The generally closer agreement be- were reduced and nonsignificant (Fig. 3a). At Asa, the high- tween WA2M-site and WXRPD than WA2M-reg at Flakaliden est relative RMSEs of total weathering occurred for Ca and was also indicated by the lower RMSEs of total weathering Mg with WA2M-site (> 30 %) (Fig. 3a). Large standard devi- for all base cations when site-specific mineralogy was used ations were due to a single soil profile, F4. The better con- (Fig. 3a). Relative RMSEs were below 20 % for WA2M-reg , sistency with WA2M-reg was indicated by RMSE below 10 % but below 10 % for WA2M-site . However, RMSE for Na was for Ca and Mg, and that RMSE for Mg was half of the error only slightly smaller for WA2M-site than WA2M-reg (16 % for with WA2M-site . Only for Na was RMSE lower for WA2M-site WA2M-site ). than with WA2M-reg . PROFILE weathering rates for Asa revealed a different A complementary illustration of the relationships between pattern compared to Flakaliden, and the results for Ca, Mg weathering rates based on XRPD and A2M is shown in Fig. 4 and K were contradictory to hypothesis one. WA2M-reg was and provided as Tables S3 and S4, which includes all data in close agreement with WXRPD for K, Ca and Mg, and the from individual soil layers 0–50 cm. A general picture is small discrepancies were nonsignificant (Fig. 2a). However, that WA2M-site was less dispersed along the 1 : 1 line than WA2M-reg for Na was consistently overestimated compared WA2M-reg , in particular for Flakaliden. On the other hand, for to WXRPD and the discrepancies were significant. Using site- weathering rates in the lower range (< 5 mmolc m−2 yr−1 ) specific mineralogy improved the fit between WXRPD and site-specific mineralogy tended to generate both over- and WA2M for Na but had rather the opposite effect on the other underestimated weathering rates. In most soil profiles, devi- Biogeosciences, 16, 1903–1920, 2019 www.biogeosciences.net/16/1903/2019/
S. Casetou-Gustafson et al.: Base cation weathering rates                                                                           1911

                                                                    Table 3. Mineral dissolution rate coefficients (kmolc m−2 s−1 ) used
                                                                    in PROFILE for the reactions with H+ , H2 O, CO2 and organic lig-
                                                                    ands (R− ) (Warfvinge and Sverdrup, 1995).

                                                                         Mineral                 pkH     pkH2 O    pkCO2     pKR
                                                                         Pyroxene                12.3      17.5      15.8    14.4
                                                                         Apatite                 12.8      15.8      15.8    19.5
                                                                         Hornblende              13.3      16.3      15.9    14.4
                                                                         Epidote                   14      17.2      16.2    14.4
                                                                         Plagioclase             14.6      16.8      15.9    14.7
                                                                         K feldspar              14.7      17.2      16.8      15
                                                                         Biotite                 14.8      16.7      15.8    14.8
                                                                         Chlorite                14.8        17      16.2      15
                                                                         Vermiculite             14.8      17.2      16.2    15.2
                                                                         Muscovite and illite    15.2      17.5      16.5    15.3

                                                                    calcic and sodic plagioclase in estimating Na release rates,
                                                                    but WA2M-site gave stronger weight to calcic versus sodic pla-
                                                                    gioclase at Asa, and vice versa at Flakaliden (Fig. 5). In spite
                                                                    of these differences, the resultant release rates of Na accord-
                                                                    ing to WA2M-site and WXRPD were rather similar (Fig. 5).
                                                                       Total Na release rates of WA2M-reg compared to WXRPD
                                                                    were moderately overestimated. The relative RMSE of
                                                                    weathering by specific Na-containing minerals were of more
                                                                    similar magnitude for Na at Flakaliden compared to Asa
                                                                    (Fig. 3b). However, the standard deviations of RMSE were
                                                                    relatively large at Flakaliden, due to large RMSE for albite in
                                                                    one specific soil profile (11B) (Table S7). Contrary to relative
                                                                    RMSE of total weathering, the relative RMSE of weathering
Figure 3. Root-mean square error (RMSE) of average PROFILE          by specific minerals was lower for Na at Asa with regional
weathering rates (mmolc m−2 yr−1 ) of 1000 A2M mineralogies per     than site-specific mineralogy.
soil layer, compared to weathering rates based on XRPD mineral-        According to WXRPD , calcic plagioclase weathering was
ogy per soil layer. Comparisons are based on the total weathering   the most important source to Ca release at Flakaliden, and the
per element (a) and on the sum of mineral contributions to total    second most important source at Asa after epidote (Fig. 5).
weathering per element (b). RMSE describes the prediction accu-
                                                                    As for Na, WA2M-site gave stronger weight to calcic pla-
racy for a single soil layer.
                                                                    gioclase than WXRPD at Asa. It was the other way around
                                                                    for WA2M-site at Flakaliden and the regional mineralogy
ations from the 1 : 1 line were frequent in soil layers below       (i.e., WXRPD gave stronger weight to calcic plagioclase than
20 cm. For Na, under- and overestimations occurred in the           WA2M-site ). Another important Ca source in weathering esti-
whole range of weathering estimates.                                mates based on A2M was apatite. This mineral was not de-
                                                                    tected in the XRPD analyses but was included in both A2M
3.3   Mineral-specific contribution to weathering rates             mineralogies as a necessary means to allocate measured total
                                                                    phosphorus content to a specific mineral (Casetou-Gustafson
In spite of its intermediate dissolution rate, plagioclase was,     et al., 2018).
due to its abundance, the most important Na-bearing mineral            Similar to Na, relative RMSE of weathering by Ca-
determined in this study (Table 3 and Fig. 5). Plagioclase is a     containing minerals were several magnitudes larger than
variable group of minerals with different stoichiometric pro-       RMSE of the total weathering of Ca. In other words, although
portions of Ca and Na, from the purely sodic albite on the          an overall similar weathering rates might be generated by
one hand to the purely calcic anorthite on the other hand (Ta-      the PROFILE model based on different quantitative miner-
ble S5) as well as with intermediate compositions (Table S6).       alogies, the underlying modeled contributions from differ-
For simplicity, they will be referred to in this study as sodic     ent minerals can be markedly different. At Flakaliden, the
and calcic plagioclase. Based on the same quantitative min-         mean relative RMSE by specific minerals were larger for re-
eralogy (i.e., same elemental compositions and identity of          gional than site-specific mineralogy at Flakaliden (Fig. 3b).
minerals), WXRPD and WA2M-site gave strong weight to both           However, the difference was not significant since the stan-

www.biogeosciences.net/16/1903/2019/                                                         Biogeosciences, 16, 1903–1920, 2019
1912 S. Casetou-Gustafson et al.: Base cation weathering rates
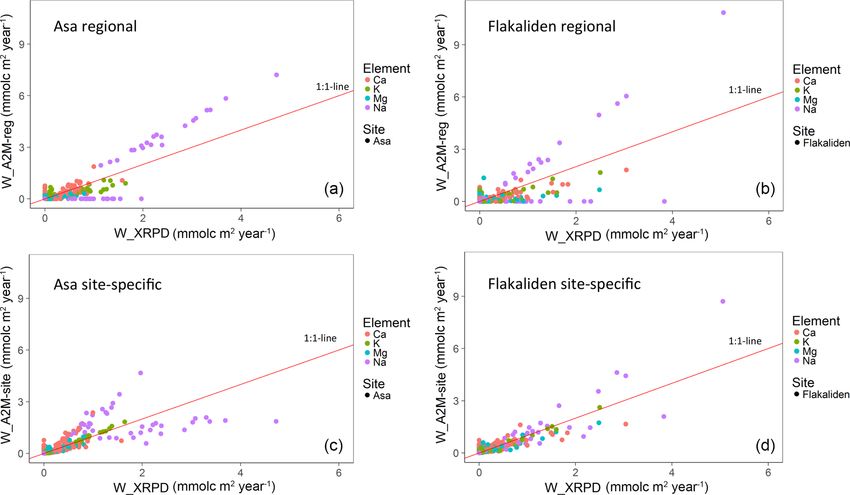
Figure 4. Comparison of PROFILE weathering rates based on XRPD mineralogy (mmolc m−2 yr−1 ) with PROFILE weathering rates based
on regional A2M mineralogy (a, b) versus site-specific mineralogy (c, d). Each data point represents a mean of 1000 PROFILE weathering
rates for a specific soil depth of one of four soil profiles per site.
dard deviations were high, probably due to larger RMSE for weathering (Table S7). The two A2M mineralogies resulted
Ca-bearing minerals in soil profile 11B (Table S7). in the same RMSEs for Mg-bearing minerals at Asa (Fig. 3b).
A general picture of the mineral contribution to Mg release Potassium release rates were largely dominated by
is that WXRPD placed most weight to amphibole whereas, in K feldspar weathering in both WXRPD and WA2M-site . How-
WA2M , Mg release was more equally distributed among other ever, K release by WA2M-reg (Fig. 5) was largely determined
minerals, notably hydrobiotite, trioctahedral mica and vermi- by micas at both sites. Together with Mg, these elements had
culite. At Asa, and to an even larger extent at Flakaliden, Mg also the lowest weathering rates, indicating that differences
release by A2M mineralogies was determined by a higher between WA2M-reg and WXRPD in relative terms were not cor-
contribution of minerals with high dissolution rates (Fig. 5 related with the magnitude of weathering. Unlike the other
and Table 3) (i.e., in WA2M-site , hydrobiotite and trioctahedral base cations, relative RMSEs of K-bearing minerals were
mica; in WA2M-reg , muscovite and vermiculite at Asa and bi- lower at both sites when site-specific mineralogy was used
otite and illite at Flakaliden). At Asa, less weight was given instead of regional (Fig. 3b), and the mineral-specific RM-
to amphibole by WA2M-site compared to WXRPD . At Flakali- SEs were also of similar magnitude to the RMSE of the total
den, the WA2M-site was close WXRPD in spite of the very dif- weathering (Fig. 3a). WA2M-site of K (Fig. 3b) was not sev-
ferent allocations of weathering rates to different minerals. eral magnitudes larger than RMSE of the total weathering
The underestimation of Mg release by WA2M-reg was largely (Fig. 3a). The largest relative RMSEs of K-containing min-
explained by the lower weight given to amphibole in both erals were reached by WA2M-reg at Flakaliden in soil profile
A2M scenarios (Fig. 5). However, A2M gave larger weight to 11B, indicated by the high standard deviation.
other minerals. The sums of RMSEs of weathering from spe-
cific Mg-bearing minerals were much larger for regional than
site-specific mineralogy at Flakaliden and reached a maxi- 4 Discussion
mum value of 156 %. A contributing factor was generally
larger RMSE for the mineral contribution of amphibole to 4.1 General range of weathering rates in relation to
Mg weathering and the fact that pyroxene contributed to the expectations from other sensitivity studies, and the
RMSEs of the total weathering of Mg. Furthermore, a large range of discrepancies between WXRPD and WA2M
standard deviation for the sum of RMSE of specific minerals
(Fig. 3b) was caused by soil profile 11B, where more weight To our knowledge, the present study is the first to have ex-
was placed on amphibole and biotite in contributing to Mg amined the sensitivity of the PROFILE model on real case
study differences of directly measured mineralogy versus in-
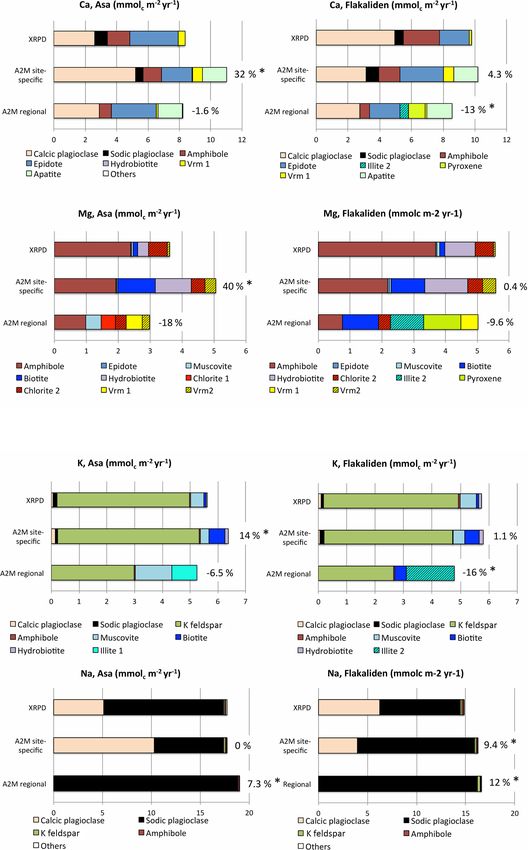
Biogeosciences, 16, 1903–1920, 2019 www.biogeosciences.net/16/1903/2019/S. Casetou-Gustafson et al.: Base cation weathering rates 1913 Figure 5. Comparison of sums of PROFILE base cation weathering rates for different minerals in the upper mineral soil (0–50 cm) based on XRPD mineralogy and the average PROFILE base cation weathering rate (i.e., based on 1000 input A2M mineralogies per mineral) according to the two normative mineralogical methods and for each study site (i.e., Asa site-specific, Flakaliden site-specific, Asa regional, Flakaliden regional). For WA2M , relative error (percentage of WXRPD estimate) is given at the end of each bar to illustrate the average deviation of WA2M and WXRPD in the upper mineral soil. The asterisk (∗ ) denotes a significant discrepancy as defined in Sect. 2.7. Vrm1 = trioctahedral vermiculite; Vrm2 = dioctahedral vermiculite. Information on chemical compositions of minerals are given in Tables S5 and S6. www.biogeosciences.net/16/1903/2019/ Biogeosciences, 16, 1903–1920, 2019
1914                                                               S. Casetou-Gustafson et al.: Base cation weathering rates

directly determined normative mineralogy. However, a few           4.3     How are discrepancies between WA2M and WXRPD
systematic studies have been made previously to test the in-               correlated to bias in determinations of quantitative
fluence of mineralogy inputs, amongst other input param-                   mineralogy
eters, to PROFILE weathering rates. Jönsson et al. (1995)
concluded that uncertainty in quantitative mineralogy could        The version of the PROFILE model used in this study al-
account for a variation from the best weathering estimate of       lowed a close examination of the per-element weathering rate
about 20 %, and that variations in soil physical and chemical      contributions obtained from different minerals that provide
parameters could be more important. The sensitivity analysis       some insight into the causes to the total WA2M discrepancies.
of Jönsson et al. (1995) was made by a Monte Carlo sim-
ulation where mineralogical inputs were varied by ±20 %            4.3.1    Sodium release rates
of abundant minerals, and up to ±100 % of minor miner-
als. Shortly after, Hodson et al. (1996) examined the sensitiv-    A biased determination of mineralogy may not necessar-
ity of the PROFILE model with respect to the sensitivity of        ily result in a corresponding bias of PROFILE weather-
weathering of specific minerals and concluded that large un-       ing estimates if the discrepancies are canceling each other
certainties, especially in soil mineralogy, moisture, bulk den-    out, and if dissolution rates of the different minerals are
sity, temperature and surface area determinations, will have a     rather similar. This was probably the case for Na. At both
larger effect on weathering rates than was reported by Jöns-       study sites and for both WXRPD and WA2M , Na release
son et al. (1995).                                                 rates were largest for plagioclase minerals. The Na release
   Compared with the sensitivity analyses by Jönsson et            from WA2M-site and WA2M-reg were close to WXRPD at both
al. (1995), the range of uncertainty in dominating mineral         study sites (i.e., all weathering rates were in the range of
inputs used in the present study was of similar order of mag-      17–19 mmolc m−2 yr−1 ); nonetheless WA2M-site placed more
nitude. For this study we used the XRPD-measured (MXRPD )          weight on calcic plagioclase and WA2M-reg more weight on
and A2M-estimated mineralogies (MA2M ) determined by               albitic plagioclase (Fig. 5). Contrary to our second hypoth-
Casetou-Gustafson et al. (2018). For example, they con-            esis, the relatively high precision in total release rates (i.e.,
cluded that MA2M-reg produced a low relative RMSE of to-           < 10 %; Fig. 3a) of Na was not correlated to the actual low
tal plagioclase (7 %–11 %) but higher relative RMSE for less       precision in mineral contribution to the total Na release rates
abundant minerals, such as dioctahedral mica (90 %–106 %).         (i.e., > 30 %; Fig. 3b). The latter can be explained by the fact
They also showed that when regional mineral identity and           that in PROFILE all types of plagioclase have the same disso-
assumed stoichiometry was replaced by site-specific miner-         lution rate coefficients (Table 3). Due to this, and in combina-
alogy (MA2M-site ), the bias in quantitative mineralogy was        tion with the fact that plagioclase-type minerals are a major
reduced.                                                           source for Na, the mineralogical uncertainty in estimating Na
   Thus, given this bias in quantitative mineralogy input to       release rates with PROFILE was relatively low in this study
PROFILE, discrepancies of WA2M from WXRPD at our study             (i.e., < 20 %). In context, however, we note that it is gener-
sites should have been on the order of 20 % or less, and site-     ally accepted that under natural conditions different plagio-
specific mineralogy inputs should produce weathering rates         clase minerals weather at different rates (Allen and Hajek,
with lower discrepancies than regional mineralogy. The re-         1989, Blum and Stillings, 1995).
sult of this study was in agreement with this expectation for
all elements at Flakaliden but only for Na at Asa. The dif-        4.3.2    Calcium release rates
ferent quantitative mineralogies resulted in discrepancies be-
tween WA2M and WXRPD that differed by site (Figs. 3a, 5).          According to WXRPD and WA2M , a key mineral for Ca re-
                                                                   lease rates was calcic plagioclase at Flakaliden and epidote
4.2    Is WA2M-site more consistent than WA2M-reg ?                at Asa. In line with our second hypothesis, the overestima-
                                                                   tion of calcic plagioclase in MA2M-site at Asa at the expense
Our first hypothesis, that using site-specific mineralogy in the   of epidote and amphibole (Casetou-Gustafson et al., 2018)
PROFILE model compared to regional mineralogy should re-           was directly reflected in the significant discrepancy and over-
sult in weathering rates closer to XRPD-based mineralogy           estimated weathering rates of Ca by WA2M-site compared to
and thus be more consistent, was generally supported for           WXRPD (Figs. 5 and 1a). This discrepancy was due to dif-
Flakaliden, but only for Na at Asa. This result was revealed       ferences between WA2M-site and WXRPD in the mineral stoi-
from both the occurrence of significant discrepancies as well      chiometry of calcic plagioclases, and not in geochemistry, as
as the RMSE of the total weathering rates. Thus, the results       the same geochemical analyses were also used for WA2M-reg .
did not support our first hypothesis in a consistent way. The         At Flakaliden, A2M based on site-specific mineralogy
possible reasons for this outcome are discussed below, based       overestimated epidote at the expense of amphibole (Casetou-
on the analysis of how different minerals contributed to the       Gustafson et al., 2018), leading to an underestimation of
overall weathering rates.                                          Ca weathering rates from amphibole compared to epidote
                                                                   (Fig. 5). On the other hand, at Asa, it was the regional min-

Biogeosciences, 16, 1903–1920, 2019                                                     www.biogeosciences.net/16/1903/2019/
S. Casetou-Gustafson et al.: Base cation weathering rates 1915 eralogy input to A2M that resulted in overestimated amounts et al., 2018) resulted in an underestimation of Ca release by of epidote at the expense of dioctahedral vermiculite and am- WA2M-reg at Flakaliden, since less Ca was allocated to the phibole, and this bias was directly reflected in the under- more weatherable minerals, although it should also be noted estimated release of Ca from amphibole in WA2M-reg . Con- parenthetically that Ca can only occur as an exchangeable versely, the relatively small and nonsignificant discrepancies cation in illite; it is not an element that occurs as part of the of Ca release by WA2M-site at Flakaliden and by WA2M-reg illite crystal structure, such that the “illite” composition used at Asa did not depend on a high precision in estimating the in PROFILE is in need of some revision. contribution from different minerals, since the precision was actually low. In these cases, the good fits seem to be sim- 4.3.3 Magnesium release rates ply coincidental. Owing to differences in dissolution rates, Ca-bearing minerals tend to compensate each other in terms At both study sites, a large number of Mg-containing min- of the total weathering rate that is calculated. This compen- erals contributed to the release of Mg, but amphibole was satory effect is perhaps the reason why by coincidence, both the predominant mineral according to WXRPD and WA2M-site . WA2M-reg and WA2M-site discrepancies for Ca diverge in dif- The only significant discrepancy in the Mg release rates was ferent directions at Asa compared to Flakaliden. revealed for WA2M-site at Asa, which resulted in an overes- Another source of uncertainty associated with the release timation by 41 %. This overestimation was an effect of an of Ca is the role of minerals with high dissolution rates that underestimated contribution from amphibole in combination occur in low abundance, for example apatite, pyroxene and with overestimated contributions from hydrobiotite and tri- calcite. Apatite was included in MA2M , but if present in the octahedral mica. This result for Asa supported our second soils studied it was below the detection limit of 1 wt % in hypothesis. At Flakaliden, WA2M-site produced the same shift the XRPD analyses as were pyroxene and calcite (Casetou- in the contribution of Mg by minerals, but the net effect was a Gustafson et al., 2018). Additionally, the assumption made in very small and nonsignificant discrepancy to WXRPD . As was the A2M calculations that all P determined in the geochem- noted for Ca, the different outcomes of using site-specific ical analyses is allocated to apatite will likely overestimate mineralogies at Asa and Flakaliden has no systematic under- the abundance of this mineral, since soil P can also bind to lying pattern. Fe and Al oxides and soil organic matter in acidic mineral Using PROFILE based on regional mineralogy resulted in soils (Weil and Brady, 2016). The relatively high abundance surprisingly low and nonsignificant discrepancies in Mg re- of paracrystalline Fe-oxyhydroxide and Al-containing allo- lease rate, despite both the qualitative and quantitative min- phane and imogolite at Flakaliden indicates that this could eralogies being very different from XRPD, particularly at be the case, at least at Flakaliden. Flakaliden. For example, both pyroxene and illite were in- Regarding pyroxene, XRPD might also have failed to de- cluded in MA2M-reg , but not in MXRPD . Thus, at Flakaliden, tect and quantify pyroxene due to low abundance at Flakali- the overestimation of illite in MA2M-reg caused an underesti- den (Casetou-Gustafson et al., 2018). Analytical limitations mation of Mg release rates comparable to the underestima- of XRPD would thus imply that WXRPD of Ca might be un- tion of Ca release rates. derestimated at Flakaliden and Asa. However, in the absence of XRPD detection it is also possible that MA2M-reg overesti- 4.3.4 Potassium release rates mated the pyroxene contents at Flakaliden. Thus, apatite and pyroxene added relatively large uncertainties to the weather- Weathering of K feldspar was the most important source of ing estimates of Ca at Flakaliden due to the fact that they have K release by PROFILE regardless of the different types of a low abundance in combination with very high dissolution mineralogy input. Casetou-Gustafson et al. (2018) showed rates. In terms of other reactive trace mineral phases, White a strong negative correlation between MA2M-reg and MXRPD et al. (1996, 2017) has highlighted the importance of small for two of the major K-bearing minerals observed at both amounts of calcite in intact granitoid rocks and its signifi- study sites, i.e., illite (or dioctahedral mica, muscovite) and cance for Ca found in watershed studies. They also noted that K feldspar. Contrary to our second hypothesis, the results in laboratory leaching experiments on the rocks they stud- of the present study demonstrate that over- or underestima- ied, reactive calcite became exhausted after just 1.5 years. tion of WA2M-reg compared to WXRPD cannot be explained Given the trace concentrations involved and the high solu- by significant negative correlation of illite and K feldspar bility of calcite, it is doubtful that calcite is or has been of in MA2M-reg . However, this is likely related to the fact that any long-lived significance in the soil profiles studied, even illite and K feldspar have the lowest and also quite similar though they are derived largely from rocks of granitic com- dissolution rates among minerals included in PROFILE (i.e., position. Despite this, the results of White et al. (1996, 2017) the highest dissolution coefficients, Table 3). Although very do suggest that calcite present in the in situ granitoid rocks different inputs in relation to K-bearing minerals produced underlying the soils may well contribute to Ca export from very similar outputs, we note that this appears contradictory the catchment. Additionally, the overestimation of the slowly to differences in the behavior of K feldspars and K micas as weatherable mineral illite by MA2M-reg (Casetou-Gustafson sources of K via weathering to plants, as reviewed for exam- www.biogeosciences.net/16/1903/2019/ Biogeosciences, 16, 1903–1920, 2019
You can also read