The Renewable Energy Policy Dilemma in India: Should Renewable Energy Certificate mechanism compete or merge with the Feed-in-Tariff Scheme?
←
→
Page content transcription
If your browser does not render page correctly, please read the page content below
The Renewable Energy Policy Dilemma in
India: Should Renewable Energy Certificate
mechanism compete or merge with the
Feed-in-Tariff Scheme?

                                                             Sushanta K Chatterjee
                                                                           (sushanta_chat@yahoo.com)

                                                                                   August 2017

M-RCBG Associate Working Paper Series | No. 79

The views expressed in the M-RCBG Associate Working Paper Series are those of the author(s) and do
   not necessarily reflect those of the Mossavar-Rahmani Center for Business & Government or of
Harvard University. The papers in this series have not undergone formal review and approval; they are
presented to elicit feedback and to encourage debate on important public policy challenges. Copyright
              belongs to the author(s). Papers may be downloaded for personal use only.

                                                        Mossavar-Rahmani Center for Business & Government
                                            Weil Hall | Harvard Kennedy School | www.hks.harvard.edu/mrcbg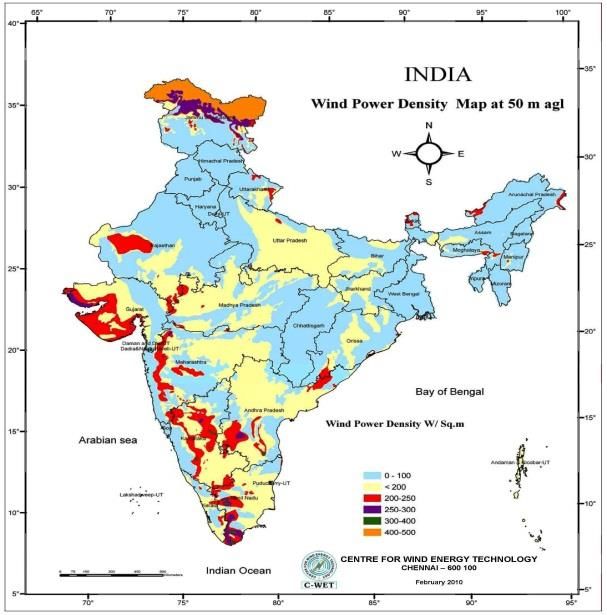
The Renewable Energy Policy Dilemma in India:
               Should Renewable Energy Certificate mechanism compete
                      or merge with the Feed-in-Tariff Scheme?

I.     INTRODUCTION

India has taken a giant stride in its endeavor to mitigate energy security concerns by
announcing an ambitious target of 175 GW of renewable energy (RE) capacity by 2022 –
ambitious in that it implies five-fold increase in RE capacity vis a vis year 2015 when the
policy announcement was made.          Several policy instruments have been tried to
promote renewable energy resources in India, for instance, renewable purchase
obligation (RPO), regulated fixed contract Feed-in-Tariff (FIT) and the market-based
Renewable Energy Certificate (REC) mechanism. The instruments of FIT and REC are
mutually exclusive to each other, in that an investor can choose either the FIT or REC
route for investment. A buyer, on the other hand, can meet renewable purchase
obligation by either or both of these two policy instruments.

2.     Renewable energy certificates are potentially more efficient because they allow
the obligated entities to meet renewable purchase obligations without buying power
themselves. The obligated entities in states without renewable resources and having
surplus contracted power, as also the obligated entities that are too small and
consequently have the requirement of procuring only small quantum of RE (like open
access consumers) can comply RPO much more cheaply, than if they each had to
procure renewable generating capacity. Because renewable power can be bought at the
cheapest price from all India under an REC mechanism, the overall cost of meeting the
175 GW target would be lower under an REC, if properly enforced, than under another
mechanism.

3.     Despite its fundamental advantage over competing mechanisms, the REC
segment of the market is in a serious crisis. It is this dilemma that this paper seeks to
probe. Why has REC performed poorly, despite strong theoretical advantages of

                                            1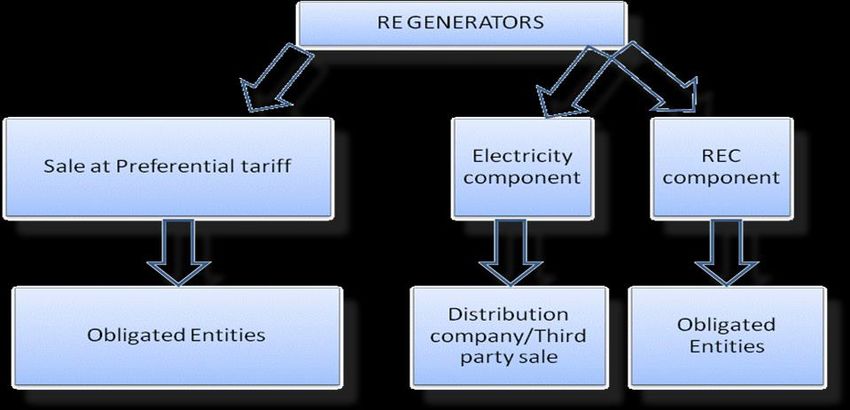
market-based mechanisms – is the question this paper seeks to answer and for this
delves into the policy philosophy behind both FIT and REC mechanisms, to understand
the tension between the two, analyze their impact, and suggest a way forward based
inter alia, on review of international experiences.

II.      RENEWABLE ENERGY POLICY IN INDIA: HISTORICAL PERSPECTIVE

4.       ‘India supports 17% of the world’s population but only possesses 0.6%, 0.4% and
7% of world’s gas, oil and coal reserves, respectively. This imbalance has meant that we
heavily depend on energy imports’ (IESS 2047). The current coal production in the
country is less than 800 million tonnes per annum and power sector alone is consuming
approximately 546 million tonnes (2015-16). The average quality of the Indian coal is not
very high and this necessitates import of high quality coal to meet the requirements of
certain other industries such as steel plants. There has been an increasing trend in the
import of coal. Net Import of coal has steadily increased from 36.60 million tons during
2005-06 to 199.88 million tons during 2015-161.

5.       The estimated reserves of crude oil in India as on 31.03.2014 stood at 762.74
million tons. There was increase of 0.57% in the estimated reserve of crude oil for the
country as a whole by 31st March, 20142 as compared to the position a year ago.
However, this is not sufficient to meet the demand. Net imports of crude oil have
increased from 99.41MTs during 2005-06 to 189.24 MTs during 2013-143. Petroleum
imports as a share of gross imports during FY 2014-15 stood at 30.11%4 and total import
dependency on petroleum products was 77.6%. All this rises about energy security and
influences policy decision for the future.

6.       Apart from energy security, climate change concerns have also been driving
India’s energy policy.            India declared a voluntary goal of reducing the emissions

1
  http://coal.nic.in/content/production-supplies accessed on 10.9.2016 at 14.40 hrs.
2
  Para 1.2, Energy Statistics 2015, Central Statistics Office, MoSPI, GoI
3
  Table 4.1, Energy Statistics 2015, Central Statistics Office, MoSPI, GoI
4
  Table 1.4, Indian Petroleum & Natural Gas Statistics, 2014-15, MoPNG, GoI

                                                          2
intensity, despite having no binding mitigation obligations. As part of the United
Nations Framework Convention on Climate Change (UNFCCC), India communicated
its Intended Nationally Determined Contribution (INDC) for the period from 2021 to
2030, keeping in view its development agenda, particularly the eradication of poverty
coupled with its commitment to following the low carbon path to progress and being
sanguine about the unencumbered availability of clean technologies and financial
resource from around the world. The commitment included inter alia the following: (i)
to put forward and further propagate a healthy and sustainable way of living based on
traditions and values of conservation and moderation; (ii) to adopt a climate friendly
and a cleaner path than the one followed hitherto by others at corresponding level of
economic development; (iii) to reduce the emissions intensity of its GDP by 33 to 35
percent by 2030 from 2005 level5.
7. It is in this context that the country has taken a conscious call on promoting
renewable energy sources. The Government has set a very ambitious target of adding
175 GW of renewable energy by 20226. While this is a recent policy announcement, it
would be pertinent to highlight the progress of renewable energy sources over the last
two decades. The following graph depicts the journey of renewable energy
development in the country since 1991:-
5
http://www4.unfccc.int/Submissions/INDC/Published%20Documents/India/1/INDIA%20INDC%20TO%20UNFC
CC.pdf
6
http://pib.nic.in/newsite/PrintRelease.aspx?relid=133220
3Figure 1: Growth of Renewable Energy Installed Generation Capacity (MW)
8. As can be seen (from the Figure 1), there has been moderate growth in the initial
years beginning 1990. It is only around 2001-2002 and especially after 2003 that the
growth has been exponential. Several facilitative policies and regulatory interventions
have contributed to this phenomenon. To start with, the focus was on incentive by way
of capital subsidy, or in the form of fiscal incentives like accelerated depreciation
benefit, tax exemptions / holidays, etc. These instruments no doubt gave fillip to the
growth of renewable energy sources but actual deployment was possibly not on
expected lines. The investors made investments primarily for tax savings and were not
truly interested in making sure that the projects operate on longer time horizon.
9. This led to a shift in the strategy and the Government of India started focusing
on generation based incentive as a substitute for accelerated depreciation benefit. The
Electricity Act, 20037 which provided for two specific instruments for promotion of
7
The Electricity Act, 2003 promulgated on 2 June, 2003
4renewable energy source and cast the responsibility on the regulators to take the vision
of green energy forward - these instruments were the Feed in Tariff (FIT) and
Renewable Purchase Obligation (RPO). The Act also empowered the regulators to
promote development of market in electricity and in pursuance of this mandate the
regulators created another instrument viz., Renewable Energy Certificate (REC) for
promotion of renewable energy in the country. The focus of this paper being on these
specific instruments, the next section seeks to examine their objectives and performance
so far.
III. POLICY INSTRUMENTS OF – RPO, FIT AND REC: VISION AND REALITY
Renewable Purchase Obligation (RPO)
10. The Electricity Act, 2003 entrusted on the Regulatory Commissions the specific
responsibility of promotion of renewable energy sources. The State Commissions were
empowered to specify renewable purchase obligation for the obligated entities. Section
86(1)(e) of the Act mandated the state regulators to promote cogeneration and generation of
electricity from renewable sources of energy by providing suitable measures for connectivity with
the grid and sale of electricity to any person, and also specify, for purchase of electricity from
such sources, a percentage of the total consumption of electricity in the area of a distribution
licensee;”
11. The obligated entities include distribution companies, open access consumers
and captive power producers. This mandatory requirement of purchase of power from
renewable energy source was meant to create demand and address market risk for the
investors.
Feed in Tariff (FIT)
12. While Renewable Purchase Obligation was meant to boost demand side of the
renewable energy segment, Feed in Tariff was aimed at giving supply side push. The
regulators were called upon to fix FIT on the basis of which the generators would enter
5into a long term Power Purchase Agreement (20 – 25 years) with the load serving
entities (distribution companies). It also provided a must run status, i.e., guaranteed
despatch of generation from renewable energy sources. Such a comfort was considered
essential for attracting investments.
13. The Electricity Act, 2003 mandated that the regulators while specifying the terms
and conditions of tariff shall be guided inter alia by promotion of cogeneration and
generation of electricity from renewable energy sources. So far, the regulatory
authorities have been fixing Feed in Tariff based on cost plus approach. It is a detailed
exercise where the regulators go into capital cost structure of the renewable energy
technologies and thereafter determine the levelized tariffs for the electricity generated
from such technologies based on the normative financial and operational norms. While
the norms are set for a five- year period, the exercise of determining levelized tariff is
annual in periodicity.
14. In recent past, auction has been introduced to discover tariff. This has been tried
mostly for procurement of solar power so far. Jawaharlal Nehru National Solar Mission
(JNNSM) in 2010 introduced for the first time the reverse auction for solar PV and solar
Thermal projects. Since then auction has become a norm for procurement of solar
capacity.
15. Both regulated FIT and auction tariff result in a fixed levelised tariff for the
useful life of the projects ranging between 20-25 years. The RE projects are guaranteed
network access and given must run status under the relevant regulations. Hence, for the
purpose of this paper both have been clubbed together.
Renewable Energy Certificate (REC)
16. In 2010, another new instrument, namely, Renewable Energy Certificate (REC)
was introduced8 in India to add to the efforts at accelerating growth of renewable
8
http://www.cercind.gov.in/2015/regulation/GZT49.pdf
6energy sources. This was envisaged as an alternate mechanism to FIT for both investors
and buyers. For the investors, this was conceived as an additional avenue for
investment whereas for the buyers, it was meant to serve as an alternate mechanism for
RPO compliance.
Box 1: REC – Conceptual Framework
17. Under this mechanism, the investor could set up a plant and sell the electricity
component and the green attribute separately. Given the infirm nature of renewable
energy source and constraints in transmission of electricity from such infirm source, it
was expected that the renewable energy generators would generate and sell electricity
locally at an average power purchase cost of the local load serving entities or at
mutually decided rate to other buyers. Assuming that the revenue from such sale of
electricity component might not be adequate to recover the cost of investment, the
renewable energy generators under this scheme were given green attribute in the form
of Renewable Energy Certificate which they could sell in the market to recover their full
cost of investment. At the same time, it sought to enable the obligated entities,
7especially, the entities located in renewable energy resource poor region to buy such
certificates from the market to fulfill their RPO.
18. Renewable Energy Sources are dispersedly located in India and it was expected
that the obligated entities in the region not endowed with renewable energy resources
would not be disadvantaged and would be able to meet their RPO by purchasing
Renewable Energy Certificate instead of procuring renewable energy all the way from
projects located in renewable energy resource rich region, which could impose
additional cost for them.
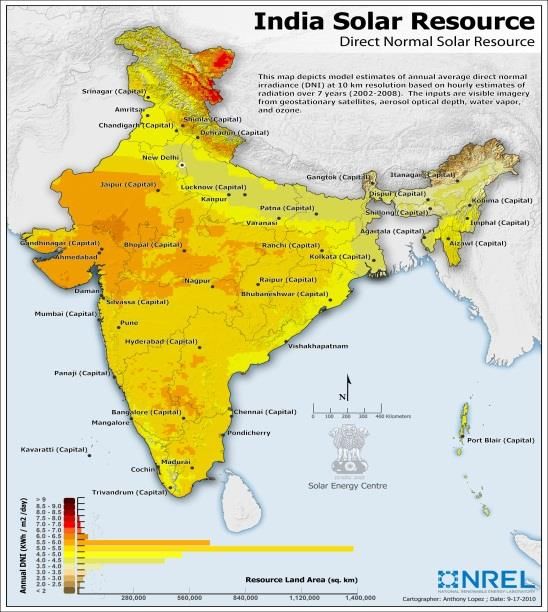
Figure 2: Unevenly Distributed Generation
Wind Potential in India Solar Potential in India
Source: Ministry of New and Renewable Energy, 2013, Centre for Wind Energy
Technology, 2013
Performance of the Policy Instruments so far
19. The question that faces India today is as to whether the vision in terms of
promotion of RE through various policy and regulatory instruments has been realized.
The country is reported to have wind power potential of more than 300 GW at 100
8meter above ground. But the cumulative wind power installed capacity operational as
on 31.01.2017 was only 28.7 GW9 (9.495%10 of the potential achieved so far). Similarly,
biomass based generation capacity achieved so far is only about 4.7 GW as against the
potential of 18 GW reported (MNRE). So is the case with other RE technologies like
Solar, Small Hydro etc. (MNRE).
20. India is a federal polity with the centre and the states having differing but
complementary responsibilities on governance. Different states are at different stages of
development and hence the priorities of the centre do not necessarily always match
with those of the States. On the renewable energy front as well, we find a significant
gap in vision between the centre and the states. In 2008 the centre launched the National
Action Plan for Climate Change (NAPCC) articulating the resolve to have, starting
2009-10 the national renewable standards at a minimum of 5% of total grids purchase,
to increase by 1% each year for 10 years11. Then came the Jawaharlal Nehru National
Solar Mission in 2010 when the centre set the target of deploying 20,000 MW grid
connected solar capacity by 202212. These targets were further enhanced in 2015 to set
the revised target of adding 175 GW of renewable generation capacity by 2022,
consisting of 100 GW of solar, 60 GW of wind, 10 GW of bio-power and 5 GW small
hydro generation capacity13.
21. The Revised Tariff Policy issued by the Government of India in 2016 stated that
the long term RPO trajectory will be indicated by the Ministry of Power in consultation
with the Ministry of New and Renewable Energy and it also set the target of solar
purchase obligation at 8% in energy terms (excluding hydro) by 202214. Subsequent to
issue of the Revised Tariff Policy, the Ministry of Power notified the pan India RPO
trajectory as reflected in Table-1.
9
Monthly Executive Summary for January, 2017 pp 14
(http://www.cea.nic.in/reports/monthly/executivesummary/2017/exe_summary-01.pdf)
10
http://mnre.gov.in/file-manager/UserFiles/State-wise-wind-power-potential-utilized.pdf
11
http://www.moef.nic.in/sites/default/files/Pg01-52_2.pdf
12
http://www.mnre.gov.in/solar-mission/jnnsm/introduction-2/
13
http://pib.nic.in/newsite/PrintRelease.aspx?relid=133220
14
http://powermin.nic.in/sites/default/files/webform/notices/Tariff_Policy-Resolution_Dated_28012016.pdf
9Table-1: RPO Trajectory notified by the Ministry of Power15
Long term trajectory 2016-17 2017-18 2018-19
Non – solar 8.75% 9.50% 10.25%
Solar 2.75% 4.75% 6.75%
Total 11.50% 14.25% 17.00%
22. Similarly, the Ministry of New and Renewable Energy indicated State wise
renewable capacity to be achieved to meet the goal of 175 GW by 2022 – as indicated in
Table-216
Table-2 Tentative State-wise break-up of Renewable Power target to be achieved by the
year 2022 So that cumulative achievement is 1,75,000 MW
State/UTs Solar Power (MW) Wind (MW) SHP (MW) Biomass
Power (MW)
Delhi 2762
Haryana 4142 25 209
Himachal Pradesh 776 1500
Jammu & Kashmir 1155 150
Punjab 4772 50 244
Rajasthan 5762 8600
Uttar Pradesh 10697 25 3499
Uttrakhand 900 700 197
Chandigarh 153
Northern Region 31120 8600 2450 4149
Goa 358
Gujarat 8020 8800 25 288
Chhattisgarh 1783 25
Madhya Pradesh 5675 6200 25 118
Maharashtra 11926 7600 50 2469
D. & N. Haveli 449
Daman & Diu 199
Western Region 28410 22600 125 2875
Andhra Pradesh 9834 8100 543
15
Ministry of Power Order No. 23/3/2016-R&R, dated 22.7.2016
16
http://mnre.gov.in/file-manager/UserFiles/Tentative-State-wise-break-up-of-Renewable-Power-by-2022.pdf
10Telangana 2000
Karnataka 5697 6200 1500 1420
Kerala 1870 100
Tamil Nadu 8884 11900 75 649
Puducherry 246
Southern Region 26531 28200 1675 2612
Bihar 2493 25 244
Jharkhand 1995 10
Orissa 2377
West Bengal 5336 50
Sikkim 36 50
Eastern Region 12237 135 244
Assam 663 25
Manipur 105
Meghalaya 161 50
Nagaland 61 15
Tripura 105
Arunachal Pradesh 39 500
Mizoram 72 25
North Eastern 1205 615
Region
Andaman & 27
Nicobar Islands
Lakshadweep 4
Other ( New States) 600 120
All India 99533 60000 5000 10000
23. As is evident, the center has been proactive in articulating the long term vision
for promotion of renewable energy sources for the country. But the reality is different at
the state level, wherein lies the real decision on procurement of power from renewable
sources. This is borne out by the difference between the RPO targets indicated by the
centre and those by the States (State Electricity Regulatory Commissions) (Table 3).
Table 3: RPO Targets set under NAPCC, Recommended by FOR, Determined by SERCs
and Achieved by Discoms
11Sl. State 2011-12 2012-13 2013-14 2014-15 2015-16 2016-17
No RPO RPO RPO RPO RPO RPO RPO RPO RPO RPO RPO RPO
. set by Ach- set by Ach- set by Ach- set Ach- set by Ach- set by Ach-
SERC ieved SERC ieved SERC ieved by ieve SERC ieved SERC ieved
SER d
C
NAPCC 7.00 8.00 9.00 10.00 11.00 12.00
1 Andhra Pradesh 5.00 5.00 1.75 5.00 5.00 5.00 5.00
2 Arunachal Pradesh 4.20 8.41 5.60 8.87 7.00
3 Assam 2.80 4.02 4.20 3.44 5.60 7.00
4 Bihar 3.00 2.10 4.00 2.90 4.50 1.89 5.00 1.00 1.25
5 Chattisgarh 5.25 2.76 5.75 2.96 5.75 5.75
6 Gujarat 6.00 4.73 7.00 6.50 7.00 6.72 8.00 9.00 10.00
7 Haryana 1.50 1.07 2.05 0.97 3.10 0.94
8 Himachal Pradesh 10.01 15.73 10.25 17.26 10.25 16.69 10.25 11.25 12.25
9 Jammu & Kashmir 3.00 5.00 5.00 6.00 7.50 9.00
10 Jharkhand 3.00 0.28 4.00 0.39 4.00 0.42 4.00 4.00
11 Karnataka 7.25 10.73 7.25 9.93 7.25 10.97
12 Kerala 3.60 2.85 3.90 2.47 4.20 4.50 4.80 5.10
13 Madhya Pradesh 2.50 4.00 5.50 7.00
14 Maharashtra 7.00 7.15 8.00 7.05 9.00 7.66 9.00 9.00
15 Meghalaya 0.75 3.41 1.00 5.00 1.00 3.80
16 Mizoram 6.00 7.76 7.00 14.45 11.99
17 Nagaland 7.00 8.00
18 Odiaha 5.00 5.50 6.00 6.50 7.00
19 Punjab 2.40 1.69 2.90 2.59 3.50 3.08 4.00
20 Rajasthan 6.00 5.16 7.10 6.30 8.20 7.25
21 Tamil Nadu 9.00 20.09 9.00 26.13 9.00 20.04 11.00 11.00
22 Uttar Pradesh 5.00 6.19 6.00 4.68 6.00 4.45
23 Uttarakhand 4.53 5.05 3.78 6.05 3.15 7.08 8.10 9.30
24 West Bengal 1.47 4.00 2.54 5.00 6.00 7.00
24. As is evident from Table 3, Himachal Pradesh and Tamil Nadu are the only
States that consistently matched the NAPCC target. Karnataka, Maharashtra and
Nagaland are the good performers in terms of target setting. Most of the other States
have lagged behind the national target. So is the case with RPO compliance. Except for
Himachal Pradesh, Karnataka and Tamil Nadu, most of the other States have fallen
short on RPO compliance.
25. What has then worked for India so far? As on date there are three broad routes of
investment in RE segment – viz FIT/Auction, Captive generation and REC. For the
purpose of this paper, FIT and auction have been grouped together because both lead to
‘long term procurement of power’ at pre-specified tariff. Data show that there is a clear
preference for FIT/Auction over REC route. Of the total 50,018 MW17 RE capacity as on
17
http://www.cea.nic.in/reports/monthly/executivesummary/2017/exe_summary-01.pdf pp 14 accessed on 9.3.2017
at 16.36 Hrs
1231.1.2017, only 4397 MW18 are though REC route (registered with Renewable Energy
Certificate Registry of India). The rest are either under FIT/Auction or captive route as
reflected in the Table 4.
Table 4: Total RE Generation and the RE capacity registered with REC Registry of India
Year Units Registered with RE Capacity RE Generation Total RE Generation
REC Registry of India8 Registered with REC Capacity Addition Capacity as per CEA
Registry of India19 Executive Summaries
(MW)
2011-12 278 1527 4529 24503.4520
2012-13 305 1108 3038.26 27541.7121
2013-14 232 789 4150.43 31692.1422
2014-15 153 550 0 31692.1423
2015-16 94 378 11157.24 42849.3824
2016-17(till 31.1.2017) 69 229 7168.62 5001825
26. One could argue that FIT has been in existence for almost two decades now and
that REC has been in place only since the last five years and hence there is pre-
dominance of FIT projects compared to REC based projects. However, the trend of
investments under these two routes since the last five years (since 2010 when REC was
introduced) also indicates pre-dominance of FIT over REC route. In fact, after initial
enthusiasm, there has been a consistent decline in investment under the REC route. In
2016 there has been an increase in the registered RE capacity with REC Registry. A
huge inventory of Renewable Energy Certificates is lying thereby denting the
confidence of the investors. Questions are being raised on the desirability and
18
https://www.recregistryindia.nic.in/index.php/general/publics/State_Source_Wise_Accr_Status accessed on
9.3.2017 at 16.41 Hrs.
19
https://www.recregistryindia.nic.in/index.php/general/publics/State_Source_Wise_Accr_Status accessed on
10.9.2016 at 15.26 Hrs.
20
http://www.cea.nic.in/reports/monthly/executivesummary/2012/exe_summary-03.pdf pp1 table A, accessed on
10.9.2016 at 15.47 Hrs.
21
http://www.cea.nic.in/reports/monthly/executivesummary/2013/exe_summary-03.pdf pp 2 table A, accessed on
10.9.2016 at 15.46 Hrs.
22
http://www.cea.nic.in/reports/monthly/executivesummary/2014/exe_summary-04.pdf pp 19 accessed on
10.9.2016 at 15.43 Hrs.
23
http://www.cea.nic.in/reports/monthly/executivesummary/2015/exe_summary-04.pdf pp 19 accessed on
10.9.2016 at 15.40 Hrs.
24
http://www.cea.nic.in/reports/monthly/executivesummary/2016/exe_summary-04.pdf pp 14 accessed on
10.9.2016 at 15.37 Hrs.
25
http://www.cea.nic.in/reports/monthly/executivesummary/2017/exe_summary-01.pdf pp 14 accessed on 9.3.2017
at 16.36 Hrs.
13continuance of this instrument in future. It is believed that non-compliance of RPO is
one of the major reasons for the current state of REC framework
27. The Comptroller and Auditor General of India (CAG), the supreme audit
institution of the country in its report (No.34 of 2015) on Performance Audit on
Renewable Energy Sector in India (http://www.cag.gov.in/content/report-no-34-2015-
performance-audit-renewable-energy-sector-india-union-government-ministry#Chapter 2)
analyzed the status of RPO compliance in 24 States between 2010-11 and 2013-2014 and
observed that only six out of the twenty four States were reported to have complied
with RPO set by the respective State Commissions. Non-compliance was predominant
amongst the RE resource deficit States, which indicated general reluctance to meet
renewable targets.
28. Some associations of wind and small hydro projects filed an appeal before the
Appellate Tribunal for Electricity (APTEL) highlighting instances of non-compliance of
RPO by the obligated entities and prayed to issue directions to the State Commissions
to enforce RPO compliance in their States. The APTEL after hearing the State
Commissions and other stakeholders passed its judgment in April 201526. The
submissions made by the State Commissions revealed instances of non-compliance of
RPO or of carry forward of RPO compliance in case of several States. SERCs have not
been imposing penalty for non-compliance despite having provisions to this effect in
their regulations. Based on the review of the status in States, the APTEL drew up a road
map and directed the State Commissions to monitor and enforce RPO compliance in a
structured manner.
29. What could be the reason for such apathy at the State level! One obvious reason
is the poor financial health of the distribution companies. The State level distribution
companies are reeling under severe losses. In most cases, purchase of renewable energy
26
(http://www.aptel.gov.in/judgements/OP%20No.%201%20of%202013%20&%20IA%20No.%20291%20of%2020
13%20&%20IA%20No.%20420%20of%202013%20&%20OP%20No.%202%20of%202013%20&%20OP%20No.
%204%20of%202013.pdf)
14or for that matter Renewable Energy Certificates for renewable purchase obligation
compliance is seen as more expensive compared to the cost of procurement of
conventional power.
30. Another reason is the comparison of the total cost of renewable energy with the
total cost of conventional power, unlike in other markets where the marginal cost of the
renewable energy is treated as zero and as such fits in the merit order prior to
conventional energy source whose marginal cost is always greater than zero. At a
macro level, these issues around market design need to be resolved.
31. While non-compliance of RPO is a major bottleneck, the paradox is that even in
States where there is a fair degree of RPO compliance, FIT/auction rather than REC
appears to be the preferred route for such compliance. Further, economic analysis
(being discussed in detail in subsequent sections) shows that the load serving entities
are not going in for REC for RPO compliance even if cost of compliance is lower under
this route compared to that under FIT/Auction route. The reason for this is believed to
be the reluctance of the buyers as it (REC) does not come with energy. The load serving
entities do not seem to be enthused to buy REC because of psychological barriers and it
being an electronic certificate not accompanied by the energy. Historically they have
been used to procuring real energy and making payment thereof. As purchasing REC
does not get them real power, they are possibly not inclined to go in for such purchases
for RPO compliance. High floor price, especially in case of solar REC, is also seen as one
of the reasons for distribution companies not choosing REC for RPO compliance.
32. Given these realities, what is the way forward? Should REC as an instrument
wither away or should it be merged with FIT? The next section seeks to find answers to
these questions through economic analysis.
IV. ECONOMIC ANALYSIS
1533. In this section an attempt has been made to assess the impact of REC scheme on
the buyers and the sellers. Their behavioral response has also been analysed. The REC
market participants include - on the buy side the obligated entities viz., the distribution
companies, open access consumers, captive generators, and the voluntary buyers; and
on the sell side the REC registered generation projects (as bilateral and OTC trades of
REC are not allowed in India). Given the substantially higher volume of electricity
purchases/consumption covered by the distribution companies, their RPO (which is a
function of consumption) in volume terms is the highest amongst the obligated entities.
Logically therefore, the distribution companies are expected to be the major buyers in
the REC market as well. The data reveals that the distribution companies have a clear
preference of FIT/Auction route over the REC route for RPO compliance. Is it because
the cost of compliance under the former (FIT/Auction route) less than that under the
latter (REC route)? This section seeks to probe into this question by undertaking an
economic analysis through a cost model - by comparing the RPO compliance costs
under both routes viz., FIT/Auction route and REC route, for RE resource rich States
(Rajasthan, Gujarat, Tamil Nadu and Madhya Pradesh) as well as RE resource deficit
States (Delhi, Uttar Pradesh and Haryana). The economic analysis also involves
revenue estimation from sellers’ perspective to assess how the revenues for an RE
generator under the two routes (FIT/Auction route and REC route) compare and
whether they influence the behavior in terms of investment. Appendix-I presents the
spreadsheet detailing in respect of the selected States, the component wise costs - of
procurement of brown energy under different scenarios; of procurement of solar and
non-solar REC; as also of procurement of RE power under FIT/Auction route.
Appendix-II presents details of possible revenue streams under the two routes
(FIT/Auction route and REC route) for the RE generators. Other supporting figures
have been presented in Appendix-III (Various charges like transmission, wheeling
charge and losses etc), Appendix-IV (marginal cost of power procurement), Appendix-
V (Short term market price), Appendix-VI (procurement of brown power under
16competitive bidding routes), and Appendix-VII (RPO requirement). The data as in these
Appendices have been analyzed in the following sections.
34. The plots below compare the costs to distribution companies of Delhi, Haryana
Uttar Pradesh and Assam (RE resource deficit States), of procuring renewable energy
(RE) through two routes: (i) purchasing brown energy and renewable energy certificates
(RECs) separately at their respective market prices; or (ii) purchasing RE directly
through a Feed-in-Tariff (FIT) or a long-term power purchase agreement (PPA)
concluded through competitive bidding. Because REC prices have been fixed/are
traded at the floor price, this comparison depends on energy cost, i.e., the cost of
procuring brown and green power through alternative means. In the plots, these
alternatives are represented as “Cost scenarios" on the horizontal axis, while the height
of the bars represents the total cost of RE procurement in Rupees on a per kilowatt hour
basis.
35. Scenarios have been built around assumptions based on a State being power
deficit or power surplus. This is because cost of RPO compliance varies depending on
whether a State is power deficit or surplus.
36. Case study of Delhi
Delhi: Power Deficit Scenario
37. In the context of Delhi, the option of purchasing RE power by the utilities
through FIT route, has been analyzed first. In this case under Solar RPO segment, the
solar power could be purchased form solar rich states viz. Haryana, Rajasthan, Gujarat
& Madhya Pradesh. Similarly under Non-Solar RPO segment, the non-solar power
could be purchased from non-solar rich states viz. Madhya Pradesh, Rajasthan, Gujarat
& Tamil Nadu.
17As depicted in Figure-3, the range of per unit cost of Solar power sold by these states (at
discom periphery), varies from Rs. 5.16 to Rs. 7.69. Similarly, as illustrated in Figure-3a,
the range of per unit cost of non-solar power sold by the States (at discom periphery),
varies from Rs. 3.62 to Rs. 5.93.
38. The second option is to meet RPO target through purchase of RECs. In such
case, the utilities will have to incur costs towards purchase of RECs as well as
conventional energy.
18Figure-4 depicts the total cost per unit i.e. cost of solar REC (pre-revised) plus the per
unit marginal cost of conventional power under various scenarios. The per unit
marginal cost of power varies based on assumptions of procurement at top 10% / 20% /
30% of power on the margin. Under this option, it is observed that the range of per unit
cost of RPO compliance varies from Rs. 5.65 to Rs. 10.73, which includes the cost of solar
REC (pre-revised) as well as the cost of conventional power. Similarly, as illustrated in
Figure-4a, the range of per unit cost of non-solar RPO compliance varies from Rs. 3.65 to
Rs. 8.73, which includes the cost of non-solar REC (pre-revised) as well as the cost of
conventional power. Figure-3 when compared to Figure-4 or for that matter Figure-3a
when compared with Figure-4a lead to an inference that REC route is more expensive
than RE procurement at FIT for Delhi. However, the analysis as above does not cover
full truth and hence we need to hold on before concluding.
39. The utilities while exercising the option of purchasing RE power to meet RPO
targets (case represented by Figure-3 & Figure-3a) cannot totally rely on the supply of
RE power, due to its variability and uncertainty. Therefore, they have to arrange for
back-up power based on conventional sources.
19In Figure-5, it has been assumed that capacity equivalent to minimum 50% of the RE
capacity contracted would need to be procured from conventional sources. In such a
case, the range of per unit cost of solar RPO compliance varies from Rs. 8.49 to Rs. 11.30.
Similarly, as illustrated in Figure-5a, the range of per unit cost of non-solar RPO
compliance varies from Rs. 6.77 to Rs. 9.54. The cost of compliance under these
circumstances, therefore, appears to be higher in case of FIT route compared to that
20under REC route (compare Figure-4 with Figure-5; and compare Figure-4a with Figure-
5a). Further, as depicted in Figure-6 and Figure-6a, REC route is expected to be all the
cheaper going forward as the floor and forbearance prices of REC have since been
revised (On 30 March, 2017, CERC revised the floor price of Solar REC from Rs. 3.50 to
Re. 1 in per kWh terms and that of Non-Solar REC from Rs. 1.50 to Re. 1 in per kWh
terms).
40. Despite these facts (REC being less expensive than RE procurement for RPO
compliance), Delhi discoms are reported to be not participating in REC market. In so far
as solar REC is concerned, one reason so far could have been high solar REC floor price
(which was more than the recently discovered solar power procurement price). But
what about non-solar REC, where the floor price was not as far from current market
realities as in case of solar. Why is it that the discoms were not buying non-solar RECs
despite their being less expensive than the RE procurement cost! This question assumes
the proportion of a paradox when we treat Delhi as a surplus State – it is not an
assumption, rather it is a fact that Delhi is power surplus, and the cost of RPO
compliance for a power surplus State (as described in the succeeding paras) is much less
under REC route as compared to that under FIT route. This reinforces the
21understanding that the discoms are not enthused to this instrument because it does not
come with energy.
Delhi: Power Surplus Scenario
41. In the event of the utilities being power surplus, they do not need to procure
energy and can meet RPO target through purchase of RECs only.
Figure-7 depicts that cost for meeting solar RPO target through purchase of RECs (pre-
revised) at the floor price of solar REC i.e. Rs. 3.50. Similarly, Figure-7a illustrates that
cost for meeting non-solar RPO target through purchase of RECs (pre-revised) at the
floor price of non-solar REC i.e. Rs. 1.50
42. Due to downward revision in floor and forbearance price of solar and non-solar
RECs, the financial impact for complying with RPO targets is further reduced.
22Figure-8 depicts that cost for meeting solar RPO target through purchase of RECs
(revised) at the floor price of solar REC i.e. Re. 1. Similarly, Figure-8a illustrates that
cost for meeting non-solar RPO target through purchase of RECs (revised) at the floor
price of non-solar REC i.e. Re. 1.
43. One can possibly pin hope that going forward, the discoms would undertake
analysis on above lines, compare the cost of RPO compliance under different routes and
take informed decision.
44. Case study of Haryana. Similar analysis has been done for the State of Haryana.
Haryana: Power Deficit Scenario
45. In order to meet RPO target, the option of purchasing RE power by the utilities
through FiT route, has been analyzed first. In this case under Solar RPO segment, the
solar power could be purchased form solar rich states viz. Rajasthan, Gujarat & Madhya
Pradesh. Similarly under Non-Solar RPO segment, the non-solar power could be
purchased from non-solar rich states viz. Madhya Pradesh, Rajasthan, Gujarat & Tamil
Nadu.
23As depicted in Figure-9, the range of per unit cost of Solar power sold by these states (at
discom periphery), varies from Rs. 5.60 to Rs. 7.74. Similarly, as illustrated in Figure-9a,
the range of per unit cost of non-solar power sold by the States (at discom periphery),
varies from Rs. 4.01 to Rs. 6.33.
46. The second option is to meet RPO target through purchase of RECs. In such
case, the utilities will have to incur costs towards purchase of RECs as well as
conventional energy (which in this case could be procured at marginal cost).
24Figure-10 depicts the total cost per unit i.e. cost of solar REC (pre-revised) plus the per
unit marginal cost of conventional power under various scenarios. The per unit
marginal cost of power varies based on assumptions of procurement at top 10% / 20% /
30% of power on the margin. Under this option, it is observed that the range of per unit
cost of RPO compliance varies from Rs. 5.65 to Rs. 9.80, which includes the cost of solar
REC (pre-revised) as well as the cost of conventional power. Similarly, as illustrated in
Figure-10a, the range of per unit cost of non-solar RPO compliance varies from Rs. 3.65
to Rs. 6.21, which includes the cost of non-solar REC (pre-revised) as well as the cost of
conventional power. Figure-9 when compared to Figure-10 or for that matter Figure-9a
when compared with Figure-10a lead to an inference that REC route is more expensive
than RE procurement at FIT in most cases for Haryana. However, the analysis as above
does not cover full truth. The succeeding paras bring other dimensions not covered
above.
47. The utilities while exercising the option of purchasing RE power to meet RPO
targets (case represented by Figure-9 & Figure-9a) cannot totally rely on the supply of
RE power, due to its variability and uncertainty. Therefore, they have to arrange for
back-up power based on conventional sources.
25In Figure-11, it has been assumed that capacity equivalent to minimum 50% of the RE
capacity contracted would need to be procured from contractual sources. In such a
case, the range of per unit cost of solar RPO compliance varies from Rs. 7.37 to Rs. 9.69.
Similarly, as illustrated in Figure-11a, the range of per unit cost of non-solar RPO
compliance varies from Rs. 5.79 to Rs. 8.28. The cost of compliance under these
circumstances, therefore, appears to be higher in case of FIT route compared to that
under REC route (compare Figure-10 with Figure-11; and compare Figure-10a with
Figure-11a). Further, as depicted in Figure-12 and Figure-12a, REC route is expected to
be all the cheaper going forward as the floor and forbearance prices of REC have since
been revised (On 30 March, 2017, CERC revised the floor price of Solar REC from Rs.
3.50 to Re. 1 in per kWh terms and that of Non-Solar REC from Rs. 1.50 to Re. 1 in per
kWh terms).
2648. Despite these facts (REC being less expensive than RE procurement for RPO
compliance), Haryana discoms are reported to be not participating in REC market.
Haryana: Power Surplus Scenario
49. In the event of the utilities being power surplus, they do not require to procure
energy and can meet RPO target through purchase of RECs only.
27Figure-13 depicts that cost for meeting solar RPO target through purchase of RECs (pre-
revised) at the floor price of solar REC i.e. Rs. 3.50. Similarly, Figure-13a illustrates that
cost for meeting non-solar RPO target through purchase of RECs (pre-revised) at the
floor price of non-solar REC i.e. Rs. 1.50
50. Due to downward revision in floor and forbearance price of solar and non-solar
RECs, the financial impact for complying with RPO targets is further reduced.
Figure-14 depicts that cost for meeting solar RPO target through purchase of RECs
(revised) at the floor price of solar REC i.e. Re. 1. Similarly, Figure-14a illustrates that
cost for meeting non-solar RPO target through purchase of RECs (revised) at the floor
price of non-solar REC i.e. Re. 1.
51. Case study of Uttar Pradesh. Similar analysis has been done for the State of Uttar
Pradesh.
Uttar Pradesh Power Deficit Scenario:
52. Figure-15 and Figure-15a represent the cost of RPO compliance through
procurement of RE power under FIT.
2853. Figure-16 and Figure-16a depict the cost of RPO compliance through REC route
with pre-revised REC price.
54. Figure-17 and Figure-17a include the cost of back-up power in addition to the
cost of procurement of RE under FIT.
29Uttar Pradesh Power: Surplus Scenario
55. Figures 18 and 18a represent the cost of RPO compliance under power surplus
scenario at pre-revised REC price whereas Figures 19 and 19a depict the case with
revised REC price.
3056. Clearly, under all these scenarios, REC is definitely a cost effective means of RPO
compliance, more so in a situation of the State being power surplus and RECs being
available at reduced rate of Re 1 in per kWh term. It is not out of place to imagine that
with these emerging realties, the apathy of the buyers against REC is likely to wane and
the REC market bodes to fair well in future.
57. REC is generally understood to be an instrument meant for RE deficit states.
However, with increasing instances of states being power surplus and REC prices being
31reduced, REC is poised to be a more viable proposition even for RE resource rich States
as is evident from the case studies below.
3233
34
Figures 20 to 26 indicate the per unit cost towards RPO compliance in respect of
Rajasthan, Madhya Pradesh, Gujarat and Tamil Nadu. In the context of reduced rate of
Solar REC to Re. 1, the cost of compliace of Solar RPO varies in the range of Rs.1 to Rs.
9.22 (Rajasthan), Rs. 1 to Rs. 7.23 (Madhya Pradesh) and Rs. 1 to Rs. 11.05 (Gujarat).
Similarly, in the context of reduced rate of Non-Solar REC to Re. 1, the cost of compliace
of Non-Solar RPO varies in the range of Rs.1 to Rs. 8.22 (Rajasthan), Rs. 1 to Rs. 6.71
(Madhya Pradesh), Rs. 1 to Rs. 9.56 (Gujarat) and Rs. 1 to Rs. 8.16 (Tamil Nadu).
Analysis indiates that compliance of Solar and Non-Solar RPO through REC at the
revised cost of Rs. 1, stands out as the cheapest option.

Revenue Model: Seller Perspective

58.    The plots below compare the revenues for RE generators from supplying power
through three routes: (i) selling to a local distribution utility via a FIT; (ii) selling to an
in-state third party at the market price for brown energy and selling RECs separately;
and (iii) selling to an out-of-state third party at the market price for brown energy and
selling RECs separately. The “Revenue scenarios" on the horizontal axis represent costs

                                              35
under alternative assumptions about whether RE generators are subject to concessional
open access charges. Revenue is shown on the vertical axis in Rupees on a per kilowatt
hour basis. Energy charges are represented net of the open access charges.
3659. Figures 27 to 32 explain the cases of Solar REC & Non-Solar REC registered
projects respectively, in Rajasthan, Madhya Pradesh and Gujarat. The red bar indicates
the revenue generated if the green energy is sold at FIT in the State. The other two blue
bars indicate the revenue from sale of brown power and REC separately. The brown
power is sold to a third party i.e. to an open access consumer inside the State, at a price
equivalent to or discounted energy charge rate (- generally an open access consumer
continues to pay the demand charge to the local distribution company and tries to save
on the energy charge under open access by procuring brown power, from the REC
registered generator at a price equal to or less than this energy charge rate otherwise
payable to the distribution company under normal scenario). The revenue for the RE
generator from the sale of brown power has been considered net of open access charges
and varies depending on whether concessions are allowed or not.
60. The above figures demonstrate that the returns from FIT or REC route vary from
State to State and are also dependent on the prevailing FIT or consumer tariff in a
particular State.
3761. The analysis as above reveals the following:
62. Demand for RE / Analysis from Discom side: Cost of RPO compliance through
REC route is less than that via FIT/RE procurement route, for several discoms - still
they do not choose REC for RPO compliance. There is a psychological barrier in that
purchase of REC is seen as giving away of money without any tangible benefit like
getting energy / power) and hence FIT/auction route involving RE procurement is
preferred, for RPO compliance.
63. Supply of RE / Analysis from RE generators' perspective: REC route might be
more viable (based on quantitative analysis) but they have huge market and business
risks (demand risk, electricity component off take risk, absence of concessional benefits
etc). Hence there is dip in investment under this route.
64. These inferences are further corroborated by the analysis of the performance of
the REC market in the following section.
V. REC MARKET PERFORMANCE ANALYSIS
65. Currently about 4,488.613 MW of renewable generation projects are registered
under REC scheme, out of which 3600.133 MW are new capacities commissioned post
promulgation of the REC scheme i.e. post September, 2010. Of this, 1,334.261 MW are
under captive route and the rest are either under APPC or under Open Access route.
66. Thus, only about 2265.872 MW new renewable generation capacities can be
stated to have been set up under the new policy instrument of REC during the period
from 2010 to 2017. This is only 6.75 % of the total RE capacity added during the same
period (33588.58 MW during October 2010 – March 2017) in the country as a whole.
38The number of REC projects getting registered has also been on the decline over the
period.
67. During the last two financial years approx 8,964,802 RECs have been issued on
an average on annual basis (9,733,840 RECs in 2015-16 and 8,195,763 RECs in 2016-17)
against which 4,955,153 RECs in 2015-16 and 6,487,739 RECs in 2016-17 were redeemed,
leaving a surplus of 4,778,687 in 2015-16 and 1,708,024 RECs in 2016-17. On the supply
side, the current inventory of RECs stands at 17,834,679 by the end of March, 2017.
With the captive generators having been made ineligible, approximately on an average
2,107,099 RECs (average of FY 2015-16 and 2016-17) per annum are expected to be out of
the market27. Thus, going by the current trend, and other factors remaining constant
approximately 6,900,000 RECs (9,000,000-2,100,000) will be issued annually and
approximately 6,000,000 RECs (approximate average of RECs redeemed through power
exchanges during 2015-16 to 2016-17) are anticipated to be purchased annually from the
current financial year 2017-18 onwards. The gap between the supply and demand is
therefore, likely to shrink more so if the number of buyers increase going forward. In
this context, it would be pertinent to make an analysis of the buy side to understand as
to whether there is any prospect of increase in the number of REC buyers in future.
68. An analysis of the buy side indicates an increasing trend of Open Access /
captive buyers in the REC market and a decreasing trend of purchase by distribution
companies. In 2014-15, 73.71% (2,257,090 RECs) of the total RECs (3,061,922) redeemed
were purchased by distribution companies, whereas in 2015-16 only about 38.06%
(1,885,778 RECs) of the total RECs redeemed (4,955,153 RECs) and in 2016-17 about
52.6% (3412651 RECs) of the total RECs redeemed (6,487,739 RECs) were purchased by
the distribution companies. During the same periods, Open Access / CPP buyers
recorded a share of 26.29% (in 2014-15), 61.94% (in 2015-16) and 47.4% (2016-17) in the
REC purchase respectively. This trend has been illustrated in the following figure.
27
https://www.recregistryindia.nic.in
39Figure 33: REC Issuance and Redemption
The Figure above shows how the composition of REC redemptions has changed over
time. The top line of the figure, bounding the blue area above, shows the total issuance
of RECs in the fiscal years ending 2012 through 2017. The yellow area at bottom shows
the total redemption of RECs by discoms, and the orange area the total redemption of
RECs by OA/CPP or voluntary parties. The blue area then shows the total share of the
REC issuance that was not redeemed by any party. The Figure shows two important
trends. First, as seen in the rising blue area, the share of RECs issued and not redeemed
increased dramatically from 2013 to 2015 before falling back in the last two years.
Second, amongst those RECs redeemed (orange and yellow areas together), the share of
RECs being redeemed by parties other than discoms (orange areas) has grown over
time. Initially discoms accounted for roughly three-quarters of all redemption, but for
FY 2016-17 this share fell to about half.
69. Further, a look at the profile of the distribution companies purchasing RECs
reveals that primarily the private distribution companies namely Reliance
Infrastructure Ltd., Torrent Power Limited Ahmedabad Distribution and Torrent Power
40Limited Surat Distribution constitute the major buyers. Amongst the other distribution
companies participating on the buy side in the REC market, majority are electricity
departments of various Union Territories. The Government owned distribution
companies are conspicuous by their absence in the REC market. This clearly shows
apathy of the major distribution companies towards REC route for RPO compliance.
VI. FINDINGS
70. Given the state of affairs in the current REC market, therefore, there are serious
doubts as to whether the REC segment will be able to sustain itself in the current design
and with current state of RPO compliance in the country. The policy dilemma therefore,
is as to whether to draw up a sunset trajectory for this scheme or tweak the scheme to
align with the ground market realities. The following section seeks to explore this
question and suggest feasible alternatives.
71. From the above analysis, two questions follow – (i) Is there a way to induce the
distribution companies to come to REC market? (ii) If yes, how and if no, can the open
access consumers and CPPs (the other categories of obligated entities) alone sustain the
REC market? The obvious answer to the first question is that RPO compliance should be
enforced strictly. This is definitely a sine qua non but given the current state of financial
health of the distribution companies, this will happen only gradually. Coupled with this
is also the psychological factor (of REC not being accompanied with real power)
restraining the distribution companies from opting for REC for RPO compliance. Then
what is the alternative solution?
72. One possible solution could be to allow sale of green power in both bundled and
un-bundled form. All RE generation irrespective of the type of contract that the RE
41project enters into, should qualify for REC, and REC should be the only instrument for
RPO compliance. What are the advantages of this proposition -
o This would help overcome the inherent resistance of the distribution
companies against REC, as with this scheme they can get both REC and
power together, and the surplus if any can be sold in the market to earn
revenue.
o REC being the only instrument for RPO compliance, the distribution
companies would be induced to go to the REC market to meet the
shortfall in RPO target, if any.
o RPO compliance monitoring would also be easier and more robust (with
REC remaining the only instrument for RPO compliance) than in the
present mechanism.
o Going forward, open access and captive consumers (who are also
obligated entities other than discoms) would create the real demand for
REC – for them procurement of REC is easier and involves less transaction
cost than that in case of procurement of power to meet RPO compliance.
o Distribution companies will come to REC market primarily to meet their
shortfall or sell their surplus REC. Eventually, as we move towards power
surplus scenario, distribution companies might find REC route cheaper
and the present mindset (of RE power procurement) might change, and
they can give further fillip to REC market. This is corroborated by the fact
that the major private distribution companies participating in the REC
market today are energy surplus and for them REC purchase for RPO
compliance involves less cost compared to procurement of RE power
under FIT/Auction.
73. Let us now look at how the suggested framework would work and what would
be its impact in the RE market in general and REC scheme in particular.
42Treatment of existing projects under FIT/Auction Route under the proposed
framework:-
74. The analysis in the preceding section revealed that majority of the RE projects are
under FIT/Auction route as of now. The arrangements would continue to remain as
they are, even under the proposed scheme. The only difference would be in that the
entire generation from such projects would earn REC credits which would get
transferred to the distribution companies who in turn would place these RECs (as
against the current practice of notifying the quantum of RE power purchase in million
units) for RPO compliance.
75. In other words, the State Commissions would indicate every year in advance the
number of RECs required to be submitted by the obligated entities for demonstrating
RPO compliance and the obligated entities would have the option of procuring RECs in
the bundled or un-bundled form for such compliance. For instance, if an obligated
entity procures renewable energy through FIT/Auction route, it will get both RE power
and RECs. If the total number of RECs so earned by an obligated entity is more than
the target RPO (i.e. more than the number of RECs notified for RPO compliance by the
State Commission for such entity), the excess RECs could be traded by the entity
through the power exchanges. In the event of short fall the obligated entity would buy
RECs to that extent from the market.
Treatment of the existing projects under REC Route:-
76. The existing projects under REC route would continue to operate in the same
manner as at present. They could also be given the option to switch over to FIT Route
with the approval of the appropriate Commission. Such projects could also participate
in the auction invited by any obligated entity for procurement of RE power in bundled
form. In the event of their switching over to FIT or auction route they would be treated
at par with the existing FIT/auction route projects. The electricity generated from the
43projects in such an event would earn RECs which would get transferred to the obligated
entity with whom they enter into contract.
Treatment for New Projects:-
77. The new projects would have the option of choosing either the FIT/Auction
route and sell the green power in bundled form (i.e. sell both electricity component and
RECs together) to the obligated entities or to sell them in un-bundled form i.e. sell the
electricity component and REC credits separately.
Impact Analysis
78. The next question that arises is, what is going to be the impact of such a proposal
on the existing RE projects, on the buyer and on the REC market? First let us examine
the impact on the existing RE projects. For the RE projects which are under
FIT/Auction Route, this arrangement would not bring about any change/impact as
they would continue to sell the RE power and get paid at the agreed FIT/auction rate.
Only the RECs that notionally get generated for electricity generation from such
projects would be transferred to the obligated entities. The obligated entities would
continue to pay to such RE generators for the quantum of power generated as under the
existing system.
79. The existing projects under REC scheme would also not be affected as they
would continue to sell the electricity component and RECs separately in the same
manner as at present. Rather they would have the option of converting their projects, if
they so choose to FIT Route or they could also participate in the auction invited by the
obligated entities.
4480. For the buyers also there would not be any change. The only difference will be in
terms of the manner in which they demonstrate their RPO compliance. As against
accounting RE power in million units they would demonstrate RECs as proof for RPO
compliance. This will surely simplify and ease the process of monitoring and
compliance of RPO which is one of the weakest links at present – a clear positive over
the existing system. The REC registry is already automated and a simple link from the
registry (the POSOCO, a statutory organization) to the SERCs could streamline the
process of monitoring and compliance of RPO.
81. Let us now examine the impact on REC market. The REC market would
definitely be impacted by the proposed arrangement. The supply side will depend on
whether the existing REC projects choose to convert themselves to FIT/Auction Route
as also whether the new investors evince interest in investment under REC Route.
Given the current state of REC market, it is likely that a few of the REC projects,
especially the new investments having contract for sale of electricity component at
average pooled power purchase cost, would initially tend to exercise this option and
shift to FIT/Auction Route. This together with the recent amendment made by the
CERC making captive power plants ineligible for REC might reduce the supply of RECs
in the market. What is expected to remain on the supply side is (i) the surplus RECs
available with the obligated entities after meeting their RPO requirement; (ii) the RECs
generated by the CPPs set up between September, 2010 and March, 2016 (Pertinently,
as per the regulations of CERC the RE resource based CPPs set up between September,
2010 and March 2016, alone are eligible for REC. In other words, the CPPs set up prior
to September, 2010 and those set up after March, 2016 are not eligible for REC); (iii) the
RECs generated by the existing REC projects which do not switch to FIT/Auction route;
and (iv) the RECs from the new projects.
82. The analysis in the previous section revealed that under the existing framework
of REC market, there would be an annual turnover of approximately 82,00,000 RECs
45You can also read