The Warehouse Group FY22 Interim Results - 22 March 2022

Page created by Rafael Henderson
 
CONTINUE READING
The Warehouse Group FY22 Interim Results - 22 March 2022
The Warehouse Group
FY22 Interim Results
22 March 2022
The Warehouse Group FY22 Interim Results - 22 March 2022
Contents
       CHAIR’S UPDATE, Joan Withers            3

       GROUP UPDATE, Nick Grayston             9

       GROUP FINANCIALS, Jonathan Oram         16

       DIVISIONAL PERFORMANCE, Jonathan Oram   24

       FY22 OUTLOOK, Joan Withers              30

2
The Warehouse Group FY22 Interim Results - 22 March 2022
Chair’s Update
Joan Withers
The Warehouse Group FY22 Interim Results - 22 March 2022
The strength of our product range, along with our
strong online shopping experience has held us in
good stead despite the impact COVID-19 related store
closures had on the Group's performance.
The half year in review was a difficult trading period for the      Despite this, our sales and margins have held up relatively well.
company.
                                                                    However, each of our brands experienced a decline in operating
During the six months ending January 2022, Auckland was in          margin percentage compared to the FY21 half year, and all except
Level 3 and 4 lockdown for a total of 84 days meaning our stores    Torpedo7 had lower revenues than the previous corresponding
were closed during this time, with the rest of New Zealand moving   period.
in and out of Level 3 and 4.
                                                                    The charts in the presentation show that taking out the aberration
As a result of these lockdown measures, our Auckland stores         of the COVID-19 impacted period, our trajectory versus the FY20
were closed for 46% of our normal trading days, and across the      half year has been positive.
rest of New Zealand our stores were closed for 23% of our normal
trading days during the FY22 half year.                             The investment we have made in moving to an Agile operating
                                                                    model combined with the exceptional leadership of our Group
There has been disruption to our supply chain and increased         CEO and Executive Leadership Squad and the dedication and
ocean freight costs which have had some impact on sales and         commitment of our team members means we have been able to
gross profit margin. There has also been a cost impost in making    again successfully navigate the challenges we have encountered.
sure our team was safe in the context of the pandemic, providing
greater remuneration equity and in increasing our marketing
investment in TheMarket.com.
                                                                                                                                         4
The Warehouse Group FY22 Interim Results - 22 March 2022
Our People                  Agile way of working           Our Ecosystem                   Our supply chain

Across our stores,          This means we are able to      We are growing our customer     The Group’s robust shipping
distribution centres and    pivot and respond to changes   centric ecosystem to provide    and stock management
support centres, our team   in our operating environment   more frictionless shopping      controls have managed
members have gone above     and customer demands, and      experiences and create          inventory levels in a period
and beyond to ensure we     to move our people around to   greater customer value. Our     where there has been supply
meet our customers’ needs   where they are needed most.    mix of store footprint and      chain disruption and higher
and wants.                                                 market leading digital assets   freight costs.
                                                           enables us to serve customers
                                                           in this changing market.
                                                                                                                          5
The Warehouse Group FY22 Interim Results - 22 March 2022
FY22 Interim results highlights                                                                                                                   Strong performance considering 23% of normal store trading days across
                                                                                                                                                              the Group were lost due to lockdown measures

            Group Sales ($m)                                                                   Gross Profit ($m)                                                          Adjusted NPAT(1) ($m)                                                                   Cash Balance ($m)
                             $1,808.3                                                                                                                                                                                                                                                  $183.6
                                                                                                                 $655.4                                                                                                                                                                         $150.0
                                                                                                                                                                                                    $111.0

                                                       $1,730.0                                                                            $599.6
     $1,683.4                                                                           $566.1                                                                             $46.2                                               $48.0

                                                                                                                                                                                                                                                             -$68.6
     FY20 H1                 FY21 H1                   FY22 H1                        FY20 H1                   FY21 H1                   FY22 H1                        FY20 H1                  FY21 H1                   FY22 H1                         FY20 H1                   FY21 H1   FY22 H1

Online sales(2) $335.9m                                                           Gross Profit margin 34.7%                                                           Reported NPAT $50.4m                                                               Net cash on hand $150.0m
Up 67.8% on FY21 H1, making up                                                    Down 150bps from 36.2% in FY21 H1                                                   Down 8.2% from $55.0m in FY21 H1                                                   Total liquidity $480.0 million(4)
19.4% of total Group Sales which was                                              but up 110bps from 33.6% in FY20 H1.                                                and up from $29.9m in FY20 H1.
up from 11.1% in FY21 H1.                                                         Gross profit margin was above pre-
Click & Collect sales $151.8m                                                     COVID-19 levels despite increase in
                                                                                  supply chain and freight expenses.
Up 79.1% on FY21 H1 and making up
50.1% of all online sales(3)

1.   Adjusted Net Profit After Tax (NPAT) is before unusual items and is a non-GAAP measure. A reconciliation between Adjusted and Statutory NPAT can be found on slide 35 of this results presentation and in Note 5 of the Financial Statements for the six months ended 30 January 2022.
2.   Online Sales includes The Warehouse, Warehouse Stationery, Noel Leeming and Torpedo7, sales through 1-day.co.nz, revenue from TheMarket.com; but excludes TheMarket.com gross transaction value (GTV).
3.   Includes Click & Collect sales through The Warehouse, Warehouse Stationery, Noel Leeming and Torpedo7 only, excludes Marketpoint sales.
4.   The Group held cash on hand of $150.0m (FY21 H1: $183.6m) at balance date, combined with available bank facilities of $330.0m, providing liquidity of $480.0m (FY21 H1: $513.6m).
                                                                                                                                                                                                                                                                                                          6
The Warehouse Group FY22 Interim Results - 22 March 2022
Dividends
    The record date for the dividend will be 6 April 2022 and the
    dividend will be paid on 26 April 2022.

    This represents a pay-out ratio of 72.2% of the FY22 half year
    adjusted net profit after tax and is in line with our policy of
    distributing at least 70% of adjusted net profit subject to Board
    discretion.

                  Historical interim dividends (cps)

                                               13.0
               10.0       9.0                             10.0

               FY18       FY19       FY20      FY21       FY22

7                                                                       7
The Warehouse Group FY22 Interim Results - 22 March 2022
Sustainability

We have continued our sustainability journey in the six months to 30 January 2022:

                             Work progressed with the Board-level                                                                                            Carried over 17,500 unique products with
                             Environmental and Social Sustainability                                                                                         sustainable features, accounting for over $111
                             Committee to govern the Company’s environmental,                                                                                million in sales during the half year.
                             social and sustainability responsibilities.

                             Diverted 75.8% of operational waste from                                                                                        $1.3 million raised for New Zealand charities
                             landfill in FY22 H1.                                                                                                            and communities in FY22 H1 including $111k in
                                                                                                                                                             support of The New Zealand Red Cross Tonga
                                                                                                                                                             Tsunami relief.

                                                                                                                                                             Refinanced $140 million of bank facilities
                             Reduced Scope 2 emissions(1) by an                                                                                              into Sustainability Linked
                             estimated 2.8% in FY22 H1.                                                                                                      Loans including sustainable packaging,
                                                                                                                                                             carbon emissions and gender targets.

1.   Scope 2 emissions relate to the consumption of electricity used in the operation of our store portfolio, Distribution Centres and Store Support Office. Scope 2
     emissions typically account for 25% of total The Warehouse Group emissions. Numbers are yet to be Toitū Carbonzero certified.

                                                                                                                                                                                                              8
The Warehouse Group FY22 Interim Results - 22 March 2022
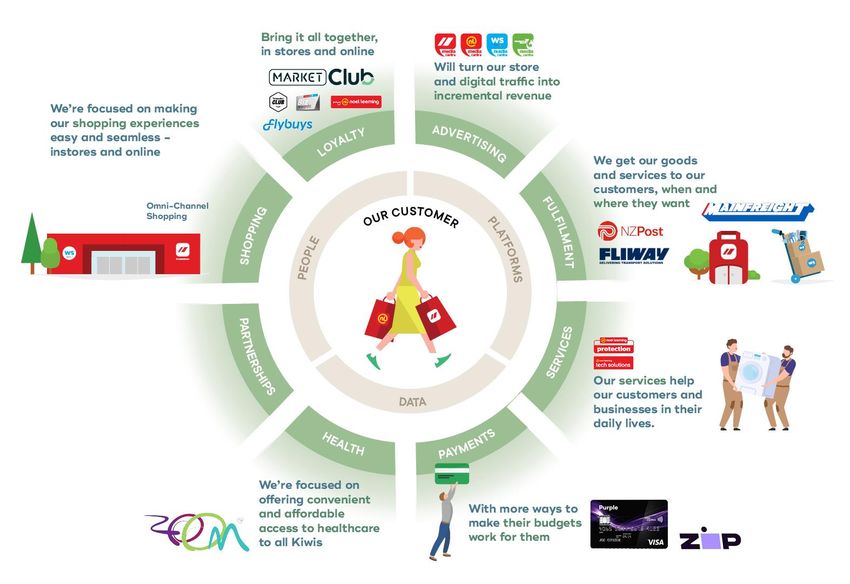
Group Update
Nick Grayston
The Warehouse Group FY22 Interim Results - 22 March 2022
Looking after our people

                                                                                                                                                           1 Jan
                   2,500                                                                                      3,635                                                                                     100%
                                                              $805,000                                                                                     2022
                  vaccines                                     paid to our people                             hours                                     launched fully paid                         gender pay
                    provided to our                           through our vaccine                         of training conducted                          26-week parental                             equity
                   people in stores,                           incentive scheme                                on Udemy for                                 leave for all                           across the Group(1)
                  DCs and in the SSO                                                                      Business in FY22 H1                            permanent team
                                                                                                                                                             members

     •     In FY22 we continued to embed Agile principles in the way we work. This                                      •    We introduced a mandate to ensure team members were vaccinated against
           has enabled us to pivot and respond to changes in our operational                                                 COVID-19 in order to perform their roles. This mandate came into effect from
           environment, meet customer demands, to move our people and reallocate                                             16 January 2022.
           resources to where they are needed most.                                                                     •    The Group began Rapid Antigen Testing for COVID-19 in November 2021.
     •     We review our assessment of the risks created by COVID-19 continuously,                                      •    A full remuneration review was conducted that saw us realign salaries to
           and update the measures used to keep our team members and customers                                               market competitive rates across core roles and achieved gender pay equity.
           safe.
                                                                                                                        •    We are proud of our commitment to pay strong wages, entitling the majority of
     •     We increased staff levels to ensure people could take time off when they                                          our team to be paid at least $22.75 an hour, compared to NZ minimum wage
           needed, increased distancing in our distribution and fulfilment centres, store                                    of $20.00. This will increase further to at least $23.58 in August 2022 and will
           greeters to provide oversight of customer scanning at entry, and undertook                                        include additional compensation for team members fully trained across store
           full health and safety assessments with external independent support.                                             functions and have been with us for at least 5 years.
           These measures did come with increased costs, but we made the choice
           to prioritise the health and wellbeing of our people and customers.

1.       Pay Equity measures the median hourly salary or wages of female team members against male team members for the same role. A percentage below 100% indicates male team members’ median hourly rate is higher than female team
         members. A percentage above 100% indicates female members’ median hourly rate is higher than male team members. A percentage of 100% indicates gender pay equity.

                                                                                                                                                                                                                                        10
Delivering our strategic priorities

          Purpose                                                           Helping Kiwis live better every day

         Our                                                                                                            Invest in our infrastructure to excel
                                  Build a customer ecosystem                     Build the future experience
  Strategic Priorities                                                                                                         in retail fundamentals

 Strategic Themes        •       Engage new and existing customers          •   Meet & exceed changing                  •   Material progress on core system
                                 by solving their needs and wants               consumer expectations                       replacement
                                 better                                     •   Optimise store footprint and            •   Scoping of further core investment
                         •       Offer a rewarding, seamless and                develop supply chain                    •   Maintained long term financial
                                 frictionless customer experience           •   Provide “What I want, where I               security
                                                                                need it, when I choose”

                             • Launched MarketClub in The Warehouse         • Weighted average in-store net promoter    • Significant progress on core system
       FY22 H1                    and on TheMarket.com The first steps        score (NPS) increased by +3.7 points          projects – WMS, ERPFI and MDM
     Achievements                 towards a Group loyalty programme           year on year for the Group                •   ERPFI project is on track for finance
                             •    Integrated 1-day.co.nz into               • Online sales increased 67.8% and              release in April
                                  TheMarket.com – on track to deliver         Click & Collect sales grew 79.1%          •   Realtime Inventory available to sell
                                  more than $100m GTV in FY22               • 2 more SWAS integrations bringing total       (ATS) for online is on track for release in
                             •    SKU reduction of 12% in the period –        to 27.                                        September
                                  11.0% for TWL and 12.7% for WSL                                                       •   Scoping work underway on supply chain
                             •    The Warehouse mobile app spent 46                                                         network and complete on Group Order
                                  days as the #1 most downloaded                                                            Management System (“GOMS”)
                                  shopping app during the half                                                          •   Liquidity of $480.0 million, with no
                             •    All our mobile apps are rated 4.7+ with                                                   drawn debt
                                  over 67k reviews on iOS App Store

                                                                                                                                                                          11
Our broad ecosystem

Solving customer problems
and serving them well
•   Our customer-centric ecosystem is focused on solving
    customer problems and providing a frictionless shopping
    experience, creating greater customer value.
•   We have strong ecosystem foundations in place with an
    established physical footprint and market leading digital
    assets.
•   We have confirmed the rollout of a unified loyalty programme
    across the Group as MarketClub.
•   In August 2021, we announced a cornerstone strategic
    investment in Zoom Health – we have a shared vision to offer
    convenient and affordable access to healthcare to all Kiwis.
•   Further improvements will make customer shopping journeys
    across all our brands faster, easier and more personalised
    through unified data, platforms and people – while remaining
    focused on the fundamentals of delivering exceptional value
    and new assortments with improved customer fulfilment and
    payment options in store and online.

                                                                   12
Loyalty programme
gathering momentum
•   Launched MarketClub group loyalty programme in The                 Launched      4.2
                                                                                   million
    Warehouse and TheMarket.com in October 2021.
•   This will eventually be rolled out Group-wide across all brands.
                                                                       October    unique customer
•   First step towards a consolidated Group-wide customer loyalty                  records across
    programme that is both rewarding and frictionless, providing
                                                                        2021
                                                                                     the Group(2)
    unmatched value for customers.
•   MarketClub members are more engaged shoppers, with higher
    spend, higher frequency, and higher average order value
    behaviours vs non-members.
•   Customers are also telling us they love the new programme,                        56%
    with members showing higher in-store and in-app net promoter                   of Torpedo7 and
    scores (NPS) vs non-members(1).                                                 Noel Leeming
•   Investments underway into systems and backend tools to                          sales to loyalty
    support future customer features and benefits, as well as                          members
    supporting the unified expansion of the programme across the
    Group’s full portfolio of brands.

     1.   Source: Qualtrics and TWG Insights
     2.   Source: Salesforce Service Cloud
                                                                                                       13
22%                                         Per
                                                                              customer spend
                                                                                                                        3rd Party GTV1
                                                                                                                           growth of
                                       of NZ online
                                        shoppers
                                     transacted with
                                                                             +19.7%                                     176%
                                                                               in FY22 H1 vs                            in FY22 H1 vs
                                       us in last 12
                                                                                                        30
                                                                                                                                         On track to
                                                           6,281                  FY21 H1                                  FY21 H1
      497k
                                          months                                                                                         deliver over
                                                           Brands
                                                                                                     million                             $100m
       active                                            3 million
     customers                                            Products
                                                                                                   online sessions in
                                                                                                   FY22 H1 – up 50%
                                                                                                                                          GTV1
                                                                                                                                           in FY22

                                                 “Oh wow. Never had such a great shopping online experience in NZ before. Choice
1.   GTV = Gross transaction value
                                                      galore. Such a bargain. Free delivery with club membership. HAPPY ☺”
                                                                                   ★★★★★
                                                                                 Customer review
                                                                                                                                                        14
online sessions - up 50% in FY22H1"

         Sales ($million) – by half year
120
                                                                        Sales momentum continues
                                                  97.5
100                                                                 •   Sales momentum has remained strong despite COVID-19 store closures in
                           84.9                                         the half year, with 14.9% growth on prior year and online sales growth of
 80                                  73.8
       65.8                                                             46.6%. Auckland stores were impacted the most closing for 84 days with a
                 64.1
                                                                        decline in sales year on year of 8.5%.
 60

 40                                                                 •   Torpedo7’s own home brand of merchandise is expanding and selling
                                                                        extremely well – with home brand mix now making up 36% of all sales with
 20                                                                     a growth strategy to deliver 50% of sales by FY24.

  0                                                                 •   Operational improvements are ongoing. We have a new end to end system
      FY20 H1   FY20 H2   FY21 H1   FY21 H2     FY22 H1                 implementation going live in 2023 which will re-platform the business and
  Operating Profit ($million) – by half year                            enable further improvements.

 10                                                                 •   We have invested in infrastructure and operational improvements to
                            5.2                                         empower Torpedo7 with the ability to grow and deliver at scale. In the
  5                                               2.8                   medium term (3-5 years) we expect to see 20-30% increase in the number
                                                                        of stores, subject to location availability.
  0                                   -1.9
      FY20 H1   FY20 H2   FY21 H1   FY21 H2     FY22 H1
 -5
        -4.2

-10

-15              -13.5

                                                                                                                                                    15
16
Group performance
     For the six months ended 30 January 2022                                                                           •   Group sales were down 4.3% as New Zealand experienced COVID-19
                                                                                                                            lockdown periods and the Group stores were closed for 23% of normal
     $ million                                             FY22 H1          FY21 H1         Variance                        trading days across New Zealand, and 46% in Auckland.
     Group Sales                                              1,730.0          1,808.3            (4.3%)                •   The Warehouse and Warehouse Stationery experienced the highest decline
     Gross Profit                                                599.6            655.4           (8.5%)                    in sales of 7.4% and 10.6%, respectively, while Noel Leeming held up
                                                                                                                            relatively well with sales decline of 1.8%.
     Gross Profit Margin %                                      34.7%            36.2%        (150 bps)
                                                                                                                        •   Torpedo7 performed exceptionally well, continuing recent sales momentum
     CODB                                                        534.1            502.4             6.3%                    despite the COVID-19 disruptions, with sales up 14.9% in the half year.
     CODB %                                                     30.9%            27.7%          320 bps                 •   Gross profit margin was 34.7% in the half, being impacted by change in
                                                                                                                            brand and product mix during lockdown periods, increased cost of freight,
     Operating Profit1                                            65.5            153.0         (57.2%)
                                                                                                                            and a higher proportion of online sales.
     Operating Profit Margin %                                   3.8%              8.5%       (470 bps)                 •   Cost of doing business ("CODB") increased 6.3% and increased as a
                                                                                                                            percentage of sales to 30.9%. Increased staff requirements and costs to
     NPAT (reported)                                              50.4              55.0          (8.2%)
                                                                                                                            operate safely under COVID-19 protocols had a significant impact on
                                                                                                                            CODB. The increase in staff wage rates and payment of vaccine incentives
     NPAT (adjusted)2                                             48.0            111.0         (56.7%)                     also increased employee expenses.
                                                                                                                        •   CODB also reflected an increase in advertising and promotional activities
     Operating Cash Flow                                         161.5            110.0           46.8%                     and increased investment in TheMarket.com.
                                                                                                                        •   We are hugely focused on returning CODB to the trend we have been on
     Dividends (cps)                                              10.0              13.0            (3.0)
                                                                                                                            once COVID-19 lockdown uncertainties are behind us.
                                                                                                                        •   Our operating cash flow control was strong through the period with an
                                                                                                                            increase in operating cashflow of 46.8%.
1.   Operating profit excludes the impact of NZ IFRS 16 and is a non-GAAP measure. A reconciliation between adjusted
     operating profit and Earnings Before Interest and Taxation (EBIT) is located on slide 35 and in Note 5 of the
     financial statements for the six months ended 30 January 2022.
2.   Adjusted Net Profit After Tax (NPAT) is before unusual items and is a non-GAAP measure. A reconciliation
     between Adjusted and Statutory NPAT is located on slide 35 and in Note 5 of the financial statements for the six
     months ended 30 January 2022.
                                                                                                                                                                                                    17
FY22 H1 sales – quarterly sales trend
                                                          Level 4 Lockdown
1,200                          Level 4 Lockdown
                                                          12 - 30 Aug 2020                                            2.8% vs FY21                                 •       FY22 Q1 sales were significantly impacted due to COVID-19
                               25 Mar – 13 May                                                                      11.2% vs FY20                                          lockdowns which were put in place just 2 weeks into the start of
                                     2020
                                                                                                                                                                           the financial year – with Q1 sales down $107.8 million (14.6%)
1,000
                                                                                                                                                                           compared to FY21 Q1 and 9.2% compared to FY20 Q1.
                                                                                                                                                                   •       Sales rebounded in the second quarter to be 2.8% up on FY21
     800
                                                                                                           14.6% vs FY21                                                   Q2, as the country moved to Level 3, then subsequently to the
                                                                                                            9.2% vs FY20                                                   traffic light system – allowing retail stores to open once again.
     600
                                                                                                                                                                   •       The Warehouse and Warehouse Stationery were most impacted
                                                                                                                                                                           by COVID-19 restrictions in the first quarter – decreasing sales
     400                                                                                                                                                                   21.4% and 22.0% respectively, compared to FY21 Q1.
                                                                                                                                                                   •       Torpedo7 weathered the disruption extremely well – with Q1
     200
                                                                                                                                                                           sales up 1.2% vs FY21 Q1, and up 43.7% vs FY20 Q1.
                                                                                                                                                                           Torpedo7 sales momentum continued significantly in Q2 – up
       0                                                                                                                                                                   23.9% vs FY21 Q2 and 50.7% vs FY20 Q2.
                               2020                                            2021                                           2022

                                                            Q1        Q2       Q3        Q4

                                                                                   Var % to Var % to                          Var % to Var % to                          Var % to Var % to
                                       FY22 Q1         FY21 Q1         FY20 Q1                       FY22 Q2 FY21 Q2 FY20 Q2                    FY22 H1 FY21 H1 FY20 H1
$m                                                                                 FY21 Q1 FY20 Q1                            FY21 Q2 FY20 Q2                            FY21 H1 FY20 H1
The Warehouse                                298.2           379.5           368.9 - 21.4 % - 19.2 %    597.2   587.8   569.9  + 1.6 %  + 4.8 %    895.4   967.3   938.8   - 7.4 %  - 4.6 %
Warehouse Stationery                           48.2            61.8            63.0      - 22.0 %        - 23.5 %              73.8            74.8            70.8         - 1.3 %    + 4.2 %    122.0     136.6     133.8    - 10.7 %    - 8.8 %
Noel Leeming                                 238.7           250.8           225.0         - 4.8 %        + 6.1 %            344.0           342.4           287.8          + 0.5 %   + 19.5 %    582.7     593.2     512.8     - 1.8 %   + 13.6 %
Torpedo7                                       34.2            33.8            23.8       + 1.2 %        + 43.7 %              63.3            51.1            42.0        + 23.9 %   + 50.7 %     97.5      84.9      65.8    + 14.8 %   + 48.2 %
Other 1                                        11.4            12.6            14.1        - 9.5 %       - 19.1 %              21.0            13.7            18.1        + 53.3 %   + 16.1 %     32.4      26.3      32.2    + 23.2 %    + 0.6 %
Total Group Sales                            630.7           738.5           694.8       - 14.6 %          - 9.2 %         1,099.3         1,069.8           988.6          + 2.8 %   + 11.2 %   1,730.0   1,808.3   1,683.4    - 4.3 %    + 2.8 %

1.    Other sales includes sales through 1-day.co.nz, revenue from TheMarket.com (excluding gross transaction value (GTV)), and other Group operations and eliminations.
                                                                                                                                                                                                                                                     18
Gross Profit Margin

                Gross Profit Margin (%) by Brand                                              Group Gross Profit Margin (%)            Group Gross Profit Margin (%)
                                                                                                  FY21 H1 to FY22 H1
                                                                                                                                                                 36.2%
                                  48.6%
                                          46.9%
                          43.6%
        42.2%
38.8%           40.0%                                                                                                                                                      34.7%
                                                                              37.8%
                                                                                      35.7%
                                                                                                                                                       33.6%
                                                                      28.3%

                                                  22.6% 22.7% 22.5%                                                               32.7%      32.5%

 The Warehouse           Warehouse Stationery         Noel Leeming        Torpedo7                                                FY18 H1   FY19 H1    FY20 H1   FY21 H1   FY22 H1

                             FY20 H1        FY21 H1     FY22 H1

         • Group Gross Profit Margin decreased 150 basis points to 34.7% but was up significantly compared to previous pre-COVID-19 years.
         • Gross margin was impacted due to:
                o       Higher cost of freight for online fulfilment and ocean freight;
                o       Change in brand and product mix as Noel Leeming increased its share of total Group sales;
                o       A higher proportion of online sales; and
                o       Continued reduction in stock provisions – FY22 H1 provisions were $2.8 million while FY21 H1 benefited from $9.8 million stock provisions.
         • The Warehouse Gross Profit Margin was most impacted by these factors.
                                                                                                                                                                                   19
Cost of doing business
   Cost of doing business as percentage of Sales
                                                                                  • Cost of doing business (“CODB”) increased as the Group managed
                                                                   30.9%
                                                                                    the operations of stores, distribution and fulfilment centres under
        29.6%                                                                       COVID-19 health and safety regulations and mandated operating
                                        27.7%
                                                                    8.1%            requirements.
         6.8%
                                        6.6%
                                                                                  • Keeping our people and customers safe is the utmost priority for us,
         4.1%                                                       3.9%
         1.7%
                                        3.8%                        1.7%
                                                                                    and particularly during times of COVID-19 uncertainty became even
                                        1.4%                                        more important.
                                                                                  • In FY22 H1, we brought in more people to our stores as door greeters
        17.0%                           15.9%                      17.2%            to scan QR codes and monitor the number of people in stores to allow
                                                                                    our stores to open and operate under COVID-19 guidelines. We
                                                                                    increased staffing in our distribution and fulfilment centres to handle
       FY20 H1                      FY21 H1                       FY22 H1           the increase in online sales and Click and Collect deliveries.
    Employee Expenses   Depreciation*           Lease Expense*   Other Expenses     Employee expenses also increased with increased staff wage rates
                                                                                    across the Group.
                                                                                  • Depreciation and lease expense increased as a result of increased
                                                                                    investment in fixed assets and IT software.
                                                                                  • Other costs include increased advertising and promotion particularly
                                                                                    in digital media, investment in TheMarket.com, COVID-19 non-labour
                                                                                    operating costs, and payments made to our employees for the Group-
                                                                                    wide vaccine incentive.

                                                                                  * Cost of doing business is presented before the impact of IFRS-16. Depreciation and amortisation is on plant,
                                                                                  property, equipment and software only. Lease expense includes property rent and lease operating expenses.
                                                                                                                                                                                                   20
Balance sheet
  As at 30 January 2022 (comparative 31 January 2021)

  $ million                         Jan-2022 Jan-2021 Variance            •   The Group was in a negative working capital position at the end of FY22 half
  Inventory                               530.6      497.7         32.9       year, with an increased level of inventory offset by an increased payable
  Trade and other receivables               89.6       86.1         3.5       balance.
  Trade and other payables              (600.3)    (501.6)       (98.7)   •   Inventory levels increased at half year end, coming off lower than normal
  Provisions                              (76.5)     (83.9)         7.4       levels at the end of FY21. FY22 half year inventory includes a higher level of
  Working Capital                         (56.6)      (1.7)      (54.9)       Goods in Transit with the earlier timing of Chinese New Year this year, and
  Fixed assets                            315.4      272.6         42.8       reduced stock provisions due to the cleaner closing inventory position.
  Investment                                 4.2          -         4.2   •   Despite higher inventory levels at half year end, improved inventory
  Funds Employed                          263.0      270.9        (7.9)       management has seen Group stockturn(1) improve from 4.9x at the FY21 half
  Tax Assets                                81.0       93.0      (12.0)       year to 5.1x at the FY22 half year.
  Derivatives                               31.4     (31.8)        63.2   •   Increased payables at half year end is largely due to timing and is expected
  Goodwill and Brands                       73.0       73.0           -       to normalise by year end.
  Right of Use Assets                     699.9      751.4       (51.5)   •   Fixed assets increased due to our continued capital investment, particularly
  Capital Employed                      1,148.3    1,156.5        (8.2)       in core systems and digital infrastructure, with Investments of $4.2 million
                                                                              reflecting the acquisition of 26% interest in ZOOM Health Limited in August
  Shareholders' equity                    450.5      431.2         19.3       2021.
  Minority interests                       (3.1)      (1.2)       (1.9)
                                                                          •   Net cash remained strong at $150.0 million, along with undrawn available
  Cash                                  (150.0)    (183.6)         33.6       banking facilities of $330.0 million providing total liquidity of $480.0
  Lease liabilities                       850.9      910.1       (59.2)       million. This is slightly above the Group’s target liquidity requirement of $350
  Sources of Funds                      1,148.3    1,156.5        (8.2)       million - $450 million.
  Book gearing                           61.0%      62.8%     (180) bps
  Liquidity                               480.0      513.6       (33.6)

                                                                                1.   Stockturn is calculated over the last 12 months.

                                                                                                                                                                 21
Cash flow
     For the six months ended 30 January 2022                                                                            •   Operating cash flow increased to $161.5 million in FY22 H1
                                                                                                                             compared with $110.0 million in FY21 H1 due to restructuring
     $ million                                                    FY22 H1            FY21 H1            Variance
                                                                                                                             costs and the repayment of the wage subsidy occurring in the
     Trading EBITDA 1                                                    164.8               247.0              (82.2)
                                                                                                                             prior period, and the movement to a negative working capital
     Restructuring costs                                                        -           (11.3)               11.3
                                                                                                                             position in the current period.
     Wage subsidy                                                               -           (67.6)               67.6
     Taxes Paid                                                          (28.6)             (23.1)               (5.5)   •   Capital expenditure cash flow was $18.3 million higher than
     Interest Paid   (2)                                                 (18.5)             (22.5)                 4.0       last year to $57.7 million in FY22 H1, reflecting increased
     Working Capital                                                       46.1             (13.2)               59.3        investment in core systems, store renewals, and customer
     Other items                                                           (2.3)                0.7              (3.0)       focused digital initiatives in our stores.
     Operating Cash Flow                                                 161.5               110.0               51.5
                                                                                                                         •   The Group acquired 26% interest in ZOOM Health Limited in
     Capital Expenditure                                                 (57.7)             (39.4)              (18.3)
                                                                                                                             August 2021 for $4.5 million.
     Divestments                                                                -               0.1              (0.1)
     Lease principal repayments                                          (48.7)             (48.6)               (0.1)   •   The Group returned to paying dividends in FY21 and FY22 –
     Close out derivatives                                                      -             (6.6)                6.6       with the FY21 final dividend paid in the current reporting
     Purchase of Associate and Minority                                    (4.8)                   -             (4.8)       period. Due to the COVID-19 pandemic and uncertain trading
     Dividends Received                                                      0.2                   -               0.2       environment at the time, there was no FY20 final dividend
     Dividends Paid                                                      (61.0)                    -            (61.0)       which would have otherwise been paid in FY21 H1.
     Net Cash Flow                                                       (10.5)               15.5              (26.0)
     Opening Net Cash                                                    160.5               168.1               (7.6)
     Closing Net Cash                                                    150.0               183.6              (33.6)

1.   Trading EBITDA represents Earnings before interest, taxation, unusual items, depreciation and amortisation.
2.   Interest paid includes $18.4m (FY21 H1: $19.2m) interest on lease liabilities. Refer to Note 15 of the Financial
     Statements for the six months ended 30 January 2022.
                                                                                                                                                                                            22
Capital expenditure

                                                    For the six months ended 30 January 2022
                12.4%
         2.3%                                       •   FY22 H1 capex was $57.4 million, compared to $40.0
                                      30.3%             million in FY21 H1.
                                                    •   The Group’s major investments included continued

              $57.4m
      13.8%                                             development of core systems including the Warehouse
                                                        Management System, Master Data Management, and ERP
                Capex Spend                             finance and inventory systems.
                                                    •   Store renewals included the refurbishment of some existing
                                                        stores including The Warehouse Porirua and Petone, two
         18.6%                                          new SWAS integrations in Invercargill and Upper Hutt, and
                                  22.6%                 the new Torpedo7 Invercargill store which opened in the
                                                        second quarter.
                                                    •   We expect capital expenditure for the full year FY22 to be
                                                        close to $135 million.
          Core Systems                    $ 17.4m
          Store Renewals                  $ 13.0m
          Other Information Systems       $ 10.7m
          Digital and Customer            $ 7.9m
          Supply Chain                    $ 1.3m
          Other                           $ 7.1m
          Total Capital Expenditure       $ 57.4m
                                                                                                                     23
24
Divisional Summary
FY22 H1 Group Sales                                   FY22 H1 Operating Profit ($million)
                       1.8%

                   5.6%

           33.7%   $1,730.0m         51.8%

                   7.1%

                                                                                                                                                    Other(2)

                                                                     Positive performance considering
   $895.4m   $122.0m $582.7m             $97.5m      23% of normal store trading days lost due to lockdown measures

                                                        1.   Other sales (1.8%) includes sales through 1-day.co.nz, revenue from TheMarket.com (excluding gross transaction
                                                             value (GTV)), and other Group operations and eliminations.
    7.4%       10.6%          1.8%           14.9%      2.   Other items in operating profit include corporate costs and other unallocated overheads.
                                                                                                                                                                              25
New Zealand's leader on value

                                                                                •   Sales in FY22 H1 were down 7.4% against the prior period due to the COVID-
                                                                                    19 lockdown. Auckland stores were most impacted as they were unable to
                                                                                    trade for 84 days. Foot traffic was down 17% which was partially offset by a
 For the six months ended 30 January 2022                                           year on year uplift in the average basket size.
                                                                                •   Online sales increased by 93.6% in FY22 H1 compared to the prior period,
$ million                                      FY22 H1   FY21 H1   Variance         driven by the COVID-19 lockdown forcing a shift to the online channel. Click
                                                                                    and Collect sales were up 122.3% as stores were still able to fulfil online
Sales                                            895.4     967.3      (7.4%)
                                                                                    orders during the lockdown periods, making up 47.3% of online sales.
Gross Profit                                     358.1     408.4    (12.3%)     •   Gross Profit Margin was down 220 bps, as we had a high contribution of online
                                                                                    sales which have a lower margin % due to freight costs. In addition, ocean
Gross Profit Margin %                           40.0%     42.2%    (220 bps)        freight costs were higher than expected. During the period we continued to
                                                                                    have a strong focus on managing the sell through on seasonal product lines
Cost of doing business (CODB)                    314.1     285.8       9.9%
                                                                                    and increasing the proportion of our stock that is required all year round in
CODB %                                          35.1%     29.5%     560 bps         order to reduce clearance and promotional activity.
                                                                                •   Home and Technology product categories were most impacted with sales
Operating Profit                                  44.0     122.6    (64.1%)         declines in Housewares, Home décor, Communications and Televisions,
Operating Profit Margin %                        4.9%     12.7%    (780 bps)        combined with the removal of product lines in Fine Jewellery and Fireworks.
                                                                                    The sales downside was partly offset by growth in Sporting and Toys.
Online sales                                     119.0      61.5      93.6%     •   CODB increased by 9.9% due to planned wage increases and an investment
                                                                                    in health and safety to keep team members safe. The Distribution Centre team
Online as a % of sales                          13.3%      6.4%    694 bps(1)
                                                                                    members were provided with daily Rapid Antigen Testing. COVID-19
Click and Collect as a % of online sales        47.3%     41.2%    610 bps(1)       compliance in stores included additional resources for mask checking, QR
                                                                                    Code scanning and queue management.
Number of stores                                    90        90            -   •   The opening of a new The Warehouse store in Ormiston in March 2021 was
                                                                                    offset by the closure of The Warehouse Whangaparaoa in FY21 Q3.

 1. Calculated based on unrounded % numbers.

                                                                                                                                                                    26
SWAS strategy delivering improvements
                                                                               for customers and the business

                                                                               •   Sales were down 10.6% on the prior period, with transactions (in-store and
                                                                                   online) down 13% and foot traffic down 14%, slightly offset with an increase in
 For the six months ended 30 January 2022                                          average basket size as compared to FY21.
                                                                               •   Online sales have continued to grow in FY22 H1, increasing by a significant
$ million                                     FY22 H1   FY21 H1   Variance         54.2% compared to the prior year, with Click & Collect sales growing 85.4%,
                                                                                   making up 29.8% of online sales.
Sales                                           122.0     136.6     (10.6%)
                                                                               •   Gross Profit decreased 13.8% to $57.2 million, through lower sales volumes
Gross Profit                                     57.2      66.4     (13.8%)        and rebates, and a 170bps deterioration in Gross Profit Margin. This is driven
                                                                                   by missed rebates as a result of lower volumes in Technology.
Gross Profit Margin %                          46.9%     48.6%    (170 bps)
                                                                               •   CODB decreased by 3.4% despite some investment in store labour with
Cost of doing business (CODB)                    47.5      49.2      (3.4%)        respect to in-store COVID-19 compliance requirements. A reduction in lease
                                                                                   costs and advertising offset this investment.
CODB %                                         39.0%     36.0%     300 bps
                                                                               •   Operating Profit decreased 43.6% to $9.7 million, with Operating Profit Margin
Operating Profit                                  9.7      17.2     (43.6%)        declining a significant 470bps to 7.9%.
Operating Profit Margin %                       7.9%     12.6%    (470 bps)    •   Stationery, and Print and Consumable categories were most impacted with
                                                                                   sales declines in the half year, while Print & Copy centres were heavily
Online sales                                     21.3      13.8      54.2%         impacted as they were only able to resume trading in Level 3 and at half
Online as a % of sales                         17.5%     10.1%    735 bps(1)       capacity due to distancing requirements.
                                                                               •   The decrease in stores compared to FY21 H1 is due to the closure of
Click and Collect as a % of online sales       29.8%     24.8%    497 bps(1)       Henderson and Hornby in FY21 H2, offset with the opening of a new store
Number of stores                                   70        71          (1)       Ormiston in March 2021.
                                                                               •   A total of 2 SWAS integrations were implemented in FY22 H1 – Invercargill
                                                                                   and Upper Hutt – bringing the total to 27.

1. Calculated based on unrounded % numbers.

                                                                                                                                                                     27
Strong global brands and customer relationships,
                                                                                 underpinned by service

                                                                                 •   Sales were down on the prior period due to the Q1 lockdown and stock
                                                                                     availability, as our suppliers grappled with disruptions to their supply
 For the six months ended 30 January 2022                                            chains. Even so, we ended FY22 H1 with the second highest H1 sales result
                                                                                     in the brand’s history at $582.7 million.
$ million                                     FY22 H1   FY21 H1    Variance      •   The lockdown caused a significant shift to the online channel, resulting in
                                                                                     online sales increasing 79.0% and contributing more than 20.0% of total sales.
Sales                                           582.7     593.2        (1.8%)
                                                                                     Click & collect continues to be our customers’ favoured option for fulfilling their
Gross Profit                                    130.9     134.7        (2.9%)        online purchase, increasing 58.0% in the half and comprising 57.0% of online
                                                                                     sales fulfilment.
Gross Profit Margin %                          22.5%     22.7%        (20 bps)
                                                                                 •   TWG Business (our business to business division) saw a decrease on the
Cost of doing business (CODB)                   101.1     101.6        (0.6%)        prior period as our customers in this division were also impacted by the
                                                                                     lockdown and their own supply chain issues.
CODB %                                         17.4%     17.1%         30 bps
                                                                                 •   Apple products (excluding iPhones), print and computer product categories all
Operating Profit                                 29.8      33.1        (9.9%)        saw strong sales growth in the half year, while many other product categories
                                                                                     experienced sales decline against FY21 H1 and this was more pronounced
Operating Profit Margin %                       5.1%      5.6%        (50 bps)       within cellular, cameras and drones product categories.
Online sales                                    124.2      69.4        79.0%     •   Increased online sales came at the expense of Gross Profit Margin %, as the
                                                                                     sales mix tended towards lower margin products, combined with increased
Online as a % of sales                         21.3%     11.7%     961 bps(1)        freight costs. There was an improvement in Q2 as more stores were able to
Click and Collect as a % of online sales       57.0%     64.4%    (756) bps(1)       open, resulting in a recovery to 22.5% Gross Profit Margin for the half year.
                                                                                 •   CODB came in slightly lower than in FY21 H1, contributing to an Operating
Number of stores                                   71        73            (2)       Profit of $29.8m, down 9.9% on the prior period.
                                                                                 •   Since FY21 H1, we closed three Noel Leeming stores (Hunters Plaza,
                                                                                     Morrinsville and Manukau Westfield) and opened one new store in Ormiston.
1. Calculated based on unrounded % numbers.

                                                                                                                                                                           28
Operational improvements and investment result in
                                                                                                                continued sales momentum

                                                                                                                •   Sales momentum continued, despite COVID-19 store closures, at 14.9% growth
                                                                                                                    on prior year with online growth of 46.6% closing the gap from sales lost due to
   For the six months ended 30 January 2022                                                                         store closures in Q1. Auckland stores were impacted the most – closing for 84
                                                                                                                    days with a decline in sales of 8.5%.
 $ million                                                     FY22 H1          FY21 H1         Variance        •   Customers embraced Torpedo7 online offering during lockdown, with online
                                                                     97.5             84.9
                                                                                                                    sales increasing 46.6% and Click & Collect service channel increasing 64.1%.
 Sales                                                                                               14.9%
                                                                                                                •   Gross Profit increased 8.4% to $34.8 million, with FY21 H1 benefitting from
 Gross Profit                                                        34.8             32.1             8.4%         strategic initiatives to reduce aged stock improving Gross Profit Margin %.
 Gross Profit Margin %                                            35.7%            37.8%              (210)     •   CODB as a percentage of sales tracked ahead of last year due to additional
                                                                                                                    staffing with respect to COVID-19 compliance requirements, additional freight
 Cost of doing business (CODB)                                       32.0             26.9           18.9%          costs, and investment in headcount to enable strategic growth initiatives.
 CODB %                                                           32.8%            31.6%                120     •   FY22 H1 Operating Profit of $2.8 million is down on the prior year but still in line
                                                                                                                    with plan towards increased profitability. Operational improvements are ongoing,
 Operating Profit                                                     2.8               5.2        (45.8%)          with a new ERP going live in 2023 which will re-platform the business
 Operating Profit Margin %                                          2.9%             6.2%             (330)         and enable further improvements.

 Online sales                                                       38.3             26.2           46.6%       •   The number of Torpedo7 stores increased to 22 with the Invercargill store which
                                                                                                                    opened in FY22 Q2 and Napier which opened in Q3 of FY21.
 Online as a % of sales                                          39.3%             30.8%       852 bps(1)

 Click and Collect as a % of online sales                        48.3%             43.1%       518 bps(1)

 Number of stores                                                      22                20                 2

1. Calculated based on unrounded % numbers.
Torpedo7 financial results (FY21 and FY20 comparatives) include Torpedo7 only and exclude 1-day which are
now included in TheMarket results in the Group financial statements.
                                                                                                                                                                                                           29
FY22 Outlook and Dividend
 The first half of FY22 was largely impacted by store closures in the first
 quarter but sales rebounded positively in the second quarter.
 We are currently in the midst of dealing with the Omicron variant and this
 is impacting foot traffic in our stores across the country. Given our
 history with lockdowns and experiences offshore with Omicron, we are
 expecting consumer spending to rebound post further declines
 in Omicron case numbers and the relaxing of restrictions.
 We are conscious of the current cost of living pressures and the impact
 of this on our customers.
 There also remains some volatility in our supply chain, in both product
 supply and cost.
 Our financial position remains very strong and the ability of our people to
 navigate the volatility over the last two years gives us confidence in
 dealing with the uncertainties of the second half.
 The Board is pleased to announce a fully imputed interim dividend of
 10.0 cents per share for the half year. The record date for the dividend
 will be 6 April 2022 and will be paid on 26 April 2022, and represents a
 pay-out ratio of 72.2% of the FY22 half year adjusted net profit after tax.
 Due to the continued uncertainty in the trading environment the Board
 does not consider it appropriate to provide full year profit guidance at this
 time. The Board will continue to assess this position ahead of year end.

                                                                                 31
Key metrics by brand
           Sales Growth         Operating Profit Margin          Online Sales Growth              Growth in Click &
                                                                                                  Collect Fulfilment

           -7.4%                       4.9%                         +93.6%                        +122.3%
                                 Decrease 780 basis points         to 13.3% of total sales

          -10.6%                       7.9%                         +54.2%                         +85.4%
                                 Decrease 470 basis points         to 17.5% of total sales

           -1.8%                       5.1%                         +79.0%                         +58.0%
                                 Decrease 50 basis points          to 21.3% of total sales

          +14.9%                       2.9%                         +46.6%                         +64.1%
                                 Decrease 330 basis points         to 39.3% of total sales

                  Strong performance considering 23% of normal store trading days lost due to lockdown measures
                                                                                                                       33
FY22 H1 Sales - weekly sales trends

               155.0                                                                                                                                                                                                                                                                                 300%
                                                                                                                                                                                       Variance %                    Group Sales - FY22                           Group Sales - FY21
               135.0
                                                                                                                                                                                                                                                                                                     250%
                                                                   2021 COVID-19 Level 4                                   2021 COVID-19 Level 3
               115.0                                                                                                             lockdown
                                                                         lockdown
                                                                                                                            NZ: 2 Sept – 7 Sept                                                                                                                                                      200%
                          95.0                                      NZ: 17 Aug – 2 Sept
                                                                                                                           Auck: 21 Sep – 9 Nov
   Sales (in $Millions)

                                                                   Auck: 17 Aug – 21 Sept
                                                                                                                                                                                                                                                                                                     150%
                          75.0

                          55.0                                                                                                                                                                                                                                                                       100%

                          35.0
                                                                                                                                                                                                                                                                                                     50%
                          15.0
                                                                                                                                                                                                                                                                                                     0%
                          (5.0)

                                                                                                                                                                                                           W18-Dec

                                                                                                                                                                                                                     W19-Dec

                                                                                                                                                                                                                               W20-Dec

                                                                                                                                                                                                                                         W21-Dec

                                                                                                                                                                                                                                                   W22-Dec
                                                                                                                           W10-Oct

                                                                                                                                     W11-Oct

                                                                                                                                               W12-Oct

                                                                                                                                                         W13-Oct

                                                                                                                                                                   W14-Nov

                                                                                                                                                                             W15-Nov

                                                                                                                                                                                       W16-Nov

                                                                                                                                                                                                 W17-Nov
                                      W1-Aug

                                                 W2-Aug

                                                          W3-Aug

                                                                     W4-Aug

                                                                                                                                                                                                                                                             W23-Jan

                                                                                                                                                                                                                                                                       W24-Jan

                                                                                                                                                                                                                                                                                 W25-Jan

                                                                                                                                                                                                                                                                                           W26-Jan
                                                                              W5-Sep

                                                                                       W6-Sep

                                                                                                W7-Sep

                                                                                                         W8-Sep

                                                                                                                  W9-Sep
                                                                                                                                                                                                                                                                                                     (50%)
            (25.0)

            (45.0)                                                                                                                                                                                                                                                                                   (100%)

                                  •            FY22 Q1 sales were significantly impacted due to COVID-19 lockdowns which were put in place just 2 weeks into the start
                                               of the quarter – decreasing sales 14.6% compared to FY21 Q1 and 9.2% compared to FY20 Q1.
                                  •            However, sales rebounded in the second quarter as the country moved to Level 3, then subsequently to the traffic light
                                               system – allowing retail stores to open once again.
                                  •            The Warehouse and Warehouse Stationery were most impacted by COVID-19 restrictions in the first quarter – decreasing
                                               sales 21.4% and 22.0% respectively, compared to FY21 Q1.
                                  •            Torpedo7 weathered the disruption extremely well – with Q1 sales up 1.2% vs FY21 Q1, and up 43.7% vs FY20 Q1. T7
                                               sales momentum continued significantly in Q2 – up 23.9% vs FY21 Q2 and 50.7% vs FY20 Q2.
                                                                                                                                                                                                                                                                                                              34
Adjusted vs Reported results

       For the six months ended 30 January 2022
                                                                                                                                                             •   All Agile and restructuring costs are complete, so there
                                                                                EBIT                                       NPAT                                  were no expenses in relation to these incurred in the first
                                                                                                                                                                 half of FY22.
        $ million                                                   FY22 H1 FY21 H1                            FY22 H1            FY21 H1
                                                                              65.5            153.0                      48.0             111.0              •   The wage subsidy received in March 2020 was voluntarily
       Adjusted Earnings
                                                                                                                                                                 repaid to the Government in December 2020 and was
       Restructuring costs                                                         -          (11.3)                          -            (8.2)                 classified as an unusual item.

       Ineffective hedge derivatives                                               -           (0.2)                          -            (0.1)

       Repayment of COVID-19 wage subsidy                                          -          (67.6)                          -          (48.6)

       NZIFRS16                                                               21.8              20.5                       2.4               0.9

       Reported earnings                                                      87.3              94.4                     50.4              55.0

1.   To improve the understanding of underlying business performance, the Group adjusts profit for unusual and non-trading items. Unusual items
     include profits from the sale of assets and losses associated with adjustments in carrying value of assets, M&A activity, restructuring costs and the
     non-cash impact of applying the NZIFRS 16 lease accounting standard.
2.   The NZIFRS16 adjustment of $21.8m in FY22 H1 (FY21 H1: $20.5m) represents the difference between the depreciation on Right-of-use-Assets
     and old NZGAAP rent expense.
3.   Adjusted Net Profit After Tax (NPAT) is before unusual items and is a non-GAAP measure. A reconciliation between Adjusted and Statutory
     NPAT can be found in Note 5 of the Financial Statements for the six months ended 30 January 2022.
                                                                                                                                                                                                                               35
Inventory management
  Closing inventory ($m)                                                               •   Inventory at the end of the half was higher than recent periods, coming
                                                                                           off historically low levels. The higher carrying value was due to higher
                  581.3
                                                                              530.6        Goods in Transit mainly from stock purchased just before the half year
    517.8          66.0                          497.7
                                                               457.2                       end due to the timing of Chinese New Year.
    63.5                                          72.7                        100.2
                                 393.6                          65.8                   •   A small amount of seasonal stock is arriving later than
                                 48.2                                                      planned due to shipping delays, most will be traded in the tail end of the
                  515.4
                                                                                           season however some will be carried through to the next season.
    454.3                                        425.1                        430.4
                                345.4                          391.4                   •   Despite higher stock levels at year end, improved inventory management
                                                                                           has seen Group stockturn(1) improve from 4.9x at the FY21 half year to
                                                                                           5.1x at the FY22 half year.
   Jul-19         Jan-20        Jul-20           Jan-21        Jul-21         Jan-22   •   The Warehouse and Warehouse Stationery achieved further SKU
                            Retail stock     Goods in transit
                                                                                           reduction with 11.0% for The Warehouse and 12.7% for Warehouse
                                                                                           Stationery.
                                                                                       •   Our current clearance levels are well within the targets with TWL at 2.9%
  Stockturn by Brand                                                                       of total stock and WSL at 1.8% vs 3.8% for both brands at the same
                                                                                           period last year.
                                           8.5     8.1                                 •   Aged inventory has continued to decrease with increased sales and
                                  6.2                                                      controlled purchases, with aged inventory(2) decreasing from 28.1% in
                                                                                           FY20 to 16.1% in FY21.
            3.9     4.1
     3.5                                                                               •   Careful inventory management has meant a cleaner closing
                                                                        2.5      2.8
                                                                1.9                        inventory position enabling the reduction of stock provisions from last half
                                                                                           year of $8.0m, contributing to the increase in inventory value.

   The Warehouse and                 Noel Leeming                     Torpedo7
   Warehouse Stationery

                           FY20 H1       FY21 H1          FY22 H1                          1.   Stockturn is calculated over the last 12 months.
                                                                                           2.   Aged inventory is stock on hand greater than 6 months.
                                                                                                                                                                          36
Glossary
   Term    Definition                                             Term   Definition
   C&C     Click & Collect                                        MDM    Master Data Management
   CODB    Cost of Doing Business                                 NIDC   North Island Distribution Centre
   COGS    Cost of Goods Sold                                     NIFC   North Island Fulfilment Centre
   DC      Distribution Centre                                    NL     Noel Leeming
   DIFOT   Delivered In-Full On-Time                              OMS    Order Management Solution
   E2E     End-to-End                                             OMU    Operating Model Update
   EDLP    Every Day Low Price                                    POS    Point-of-Sale
   ELS     Executive Leadership Squad                             SIDC   South Island Distribution Centre
   eNPS    Employee Net Promotor Score                            SSO    Store Support Office
   ERPFI   Enterprise Resource Planning - Finance and Inventory   SSS    Same Store Sales
   FC      Fulfilment Centre                                      SWAS   Store-Within-a-Store
   GBO     Group Business Operations                              T7     Torpedo7
   GEP     Group eCommerce Platform                               TWL    The Warehouse
   GTV     Gross Transaction Value                                WALT   Weighted Average Lease Tenure
   GOMS    Group Order Management System                          WMS    Warehouse Management System
   LTV     Customer Lifetime Value                                WS     Warehouse Stationery

                                                                                                            37
Disclaimer

This presentation may contain forward looking statements and projections.
There can be no certainty of the outcome and projections involve known and
unknown risks, uncertainties, assumptions and other important factors that
could cause the actual outcomes to be materially different from the events or
results expressed or implied by such statements and projections.

While all reasonable care has been taken in the preparation of this
presentation, The Warehouse Group Limited does not make any
representation, assurance or guarantees as to the accuracy or completeness
of any information in this presentation. The forward-looking statements and
projections in this report reflect views held at the date of this presentation.

Except as required by applicable law or any applicable Listing Rules, the
Relevant Persons disclaim any obligation or undertaking to update any
information in this presentation.

A number of non-GAAP financial measures are used in this presentation. You
should not consider any of these in isolation from, or as a substitute for, the
information provided in the interim financial statements, which are available at
www.thewarehousegroup.co.nz.

This presentation does not constitute investment advice, or an inducement,
recommendation or offer to buy or sell any securities in The Warehouse
Group Limited.
You can also read