This report was produced by The Community Foundation
               for the benefit of San Bernardino County.
←
→
Page content transcription
If your browser does not render page correctly, please read the page content below

This report was produced by The Community Foundation
for the benefit of San Bernardino County.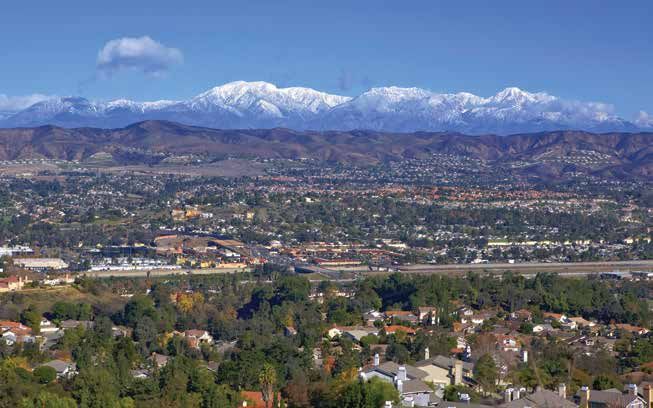
COUNTY OF
                                                                                                       BOARD OF SUPERVISORS
                                                SAN BERNARDINO
                                                                                           Robert A. Lovingood..................................... First District
                                                    Board of Supervisors                   Janice Rutherford, Chair............................ Second District
                                                                                           James Ramos................................................. Third District
                                                    County Government Center               Gary C. Ovitt, Vice Chair...........................Fourth District
                                                   385 North Arrowhead Avenue              Josie Gonzales................................................ Fifth District
                                                  San Bernardino, CA 92415-0110
                                                          (909) 387-4811                                            Laura H. Welch
GREGORY C. DEVEREAUX
                                                                                                           Clerk of the Board of Supervisors
 Chief Executive Officer

          Building and maintaining a healthy, vibrant, and livable community demands honest
          and repeated self-assessment. It requires constantly measuring the progress we are
          making toward the realization of our shared Countywide Vision. That is the purpose
          of the annual San Bernardino County Community Indicators Report.

          This 2014 report marks our fifth consecutive year of taking a hard look at our incredibly
          large and amazingly diverse county through the prisms of our economy, schools,
          healthcare, public safety, environment, and our overall quality of life. These are the
          interrelated and interdependent elements of the “complete county” our residents and
          investors want our community to become through the Vision process.

          The idea behind making this report an annual effort was to measure our performance
          and detect trends so that the community could assess and refine its efforts toward
          achieving the Countywide Vision. After five years, we can begin to see the progress we
          are making and where more work needs to be done. The good news is that the county’s
          foreclosure rate has dropped from 5 percent to 1 percent and the high school dropout
          rate has declined by 30 percent. The bad news is that high blood pressure is on the
          rise and the county’s high rate of childhood obesity remains the same.

          We hope this report serves as an impetus for government leaders, business people,
          community- and faith-based organizations, and others to come together and discuss
          strategies that are working for them and to bring those strategies to scale to serve our
          entire county.

          The Community Indicators Report reflects an ongoing, annual commitment by our
          county to raise awareness and build stronger collaborative initiatives that address
          systemic challenges. This report provides a timely framework for understanding the
          elements of our county as an interrelated system that offers a superior quality of life
          and serves as a magnet for investment.

          The San Bernardino County Board of Supervisors and The Community Foundation
          appreciate your interest and involvement, and we encourage you to use the information
          contained in this report to help us achieve our shared Countywide Vision.

          Sincerely,

         Janice Rutherford, Chair                       Dr. Jonathan Lorenzo Yorba, President and CEO
         Board of Supervisors                           The Community Foundation
         County of San Bernardino                       Serving the Counties of Riverside and San Bernardino

           The mission of the government of the County of San Bernardino is to satisfy its customers by providing service
           that promotes the health, safety, wellbeing, and quality of life of its residents according to the County Charter,
                                          general laws, and the will of the people it serves.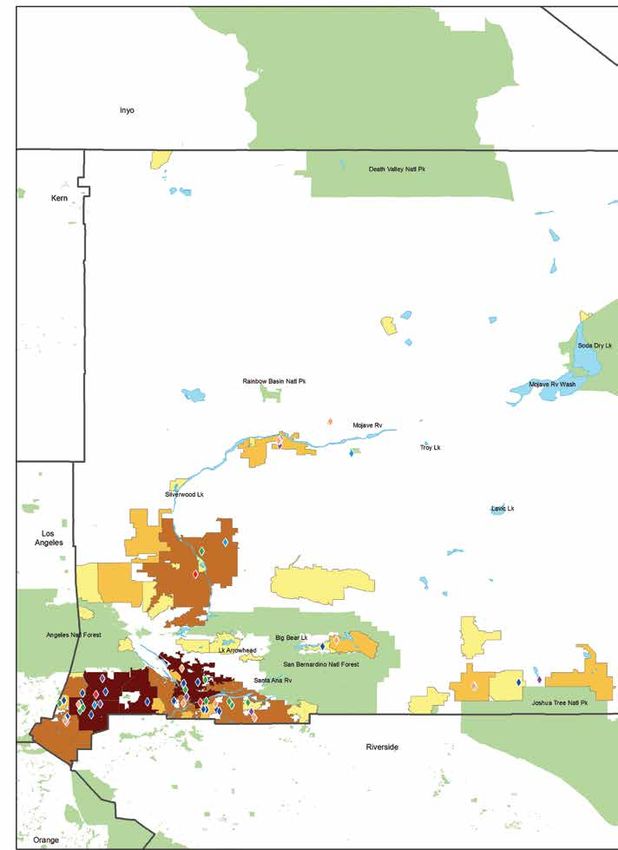
Table of Contents

                 Introduction     2
                County Profile    5

               Special Feature   11   A Look Back, A Path Forward

Economic and Business Climate    24   Employment
                                 26   Housing Market
                                 28   Commercial Real Estate Market
                                 29   Business Climate
                                 30   Median Household Income and Cost of Living
                                 31   Housing Affordability
                                 32   Rental Affordability
                                 33   Mobility
                                 34   Transit

                    Education    36   Academic Performance
                                 37   Educational Attainment
                                 38   College Readiness
                                 40   Career Preparation
                                 41   Educational-Occupational Match
                                 42   STEM-Related Degrees

Community Health and Wellness    44   Health Care Access
                                 46   Prenatal Care
                                 47   Leading Causes of Death for Children Under Five
                                 48   Overweight and Obesity
                                 49   Chronic Disease
                                 50   Mental Health
                                 51   Substance Abuse
                                 52   Health Status
                                 53   Family Income Security
                                 54   Family Housing Security
                                 55   Child Welfare

                 Public Safety   58   Crime Rate
                                 60   Gang-Related Crime

                                 62   Renewable Energy
                 Environment     63   Air Quality
                                 64   Solid Waste and Household Hazardous Waste
                                 65   Stormwater Quality
                                 66   Water Consumption

                                 68   Community Amenities
              Community Life     73   Veterans
                                 74   Nonprofit Businesses

 Acknowledgments and Sources     76

                                                                                        1
Introduction

    T
           he San Bernardino County Community Indicators Report provides a broad
           perspective of life in San Bernardino County and the many factors that contribute
           to sustaining a healthy economy, environment and populace. This report is not
    intended to be a marketing piece that only touts the county’s positive characteristics.
    It does highlight trends where San Bernardino stands out as a leader among peer
    regions and neighboring counties. At the same time, it points out trends where the
    county is stagnating or even declining, flagging issues where work is needed.

    The report does not shy away from an honest assessment of the county’s status across
    multiple disciplines, recognizing that this analysis offers opportunities for action leading
    to growth and change. The ultimate goal of the San Bernardino County Community
    Indicators Report is to inform and inspire community members, policymakers, and
    business leaders working to make San Bernardino County the best it can be.

    Indicator Selection Criteria
    Good indicators are objective measurements that reflect how a community is doing. They reveal whether
    key community attributes are improving, worsening, or remaining constant. The indicators selected for
    inclusion in this report:
      • Reflect broad countywide interests which impact a significant percentage of the population,
      • Illustrate fundamental factors that underlie long-term regional health,
      • Can be easily understood and accepted by the community,
      • Are statistically measurable and contain data that are both reliable and available over the long-term,
      • Measure outcomes rather than inputs whenever possible, and
      • Fall within the categories of the economy, education, community health and wellness, public safety,
        environment, and community life.

    Peer Regions
    To place San Bernardino County’s performance in context, many indicators compare the county to the
    state, nation or other regions. We compare ourselves to four neighboring counties to better understand
    our position within the Southern California region including Riverside, Orange, Los Angeles and San
    Diego counties. We also compare ourselves to three “peer” regions: Las Vegas, Nevada; Phoenix, Arizona;
    and Miami, Florida. These peer regions were selected because they are considered economic competitors
    or good barometers for comparison due to the many characteristics we share with them.

2   INTRODUCTION    2014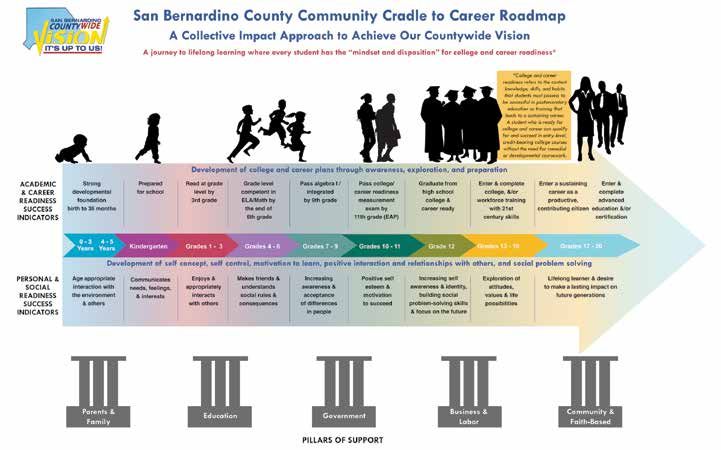
Our Community is a System
Understanding that a community is a system of interconnected elements is increasingly
important as the issues we face become more complex. The more we work collaboratively
and across boundaries – whether historical, physical, political, or cultural – the more
successful we will be in our efforts to sustain a high quality of life.

The graphic below illustrates the connectivity of the various aspects of our community. They are
linked by virtue of the impact one has on the other, or the interplay between them.

  Connecting the Dots

Every indicator in this report is linked in some way. As you read the report, multiple linkages between
indicators will likely come to mind as you “connect the dots” between indicators. For example:

                                     A healthy start in life
                                           Prenatal Care
                                                   and a clean environment
                                                 Air Quality
     are essential for children’s growth and development, contributing to their ability to succeed in school,
                                    Academic Performance
                                                become prepared for college and career
                        College Readiness & Career Preparation
              and enter the community’s workforce ready and able.
                                                    Employment
    A strong local labor pool provides our businesses with the resources they need to thrive and grow
                                     Business Climate
                  and provides individuals and families with sufficient income
                                              Median Household Income
                                                    for safe housing
                                    Family Housing Security
                                         and health care.
                                          Health Care Access

                                                                                              2014   INTRODUCTION   3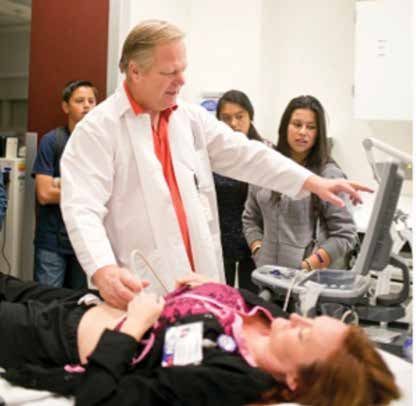
Supporting a Countywide Vision Statement

    One of the primary uses for the annual Community Indicators Report is to measure San Bernardino
    County’s progress toward achieving its Countywide Vision. The Vision was adopted in 2011 by the San
    Bernardino County Board of Supervisors and the San Bernardino Associated Governments Board of
    Directors, following a series of community and stakeholder meetings and extensive research. Intended
    as a roadmap to the future for the county as a whole, the Vision calls upon the county to capitalize
    on its diversity to create a broad range of opportunities that will lead to the realization of a “complete
    county.” The Vision holds that the elements of that complete county – for example, education, public
    safety, jobs, recreation and wellbeing – are interrelated and depend on all sectors working collaboratively
    toward shared goals.

    The first San Bernardino County Community Indicators Report was created in 2010 in anticipation
    of the Vision. Each successive report has become a valuable tool to measure progress toward becoming
    the complete county outlined in the Countywide Vision. Information on the Vision can be found at
    www.sbcounty.gov/vision.

               We envision a complete county that capitalizes on the diversity of its
               people, its geography, and its economy to create a broad range of choices
               for its residents in how they live, work, and play.

               We envision a vibrant economy with a skilled workforce that attracts
               employers who seize the opportunities presented by the county’s unique
               advantages and provide the jobs that create countywide prosperity.

               We envision a sustainable system of high-quality education, community
               health, public safety, housing, retail, recreation, arts and culture, and
               infrastructure, in which development complements our natural resources
               and environment.

               We envision a model community which is governed in an open and ethical
               manner, where great ideas are replicated and brought to scale, and all
               sectors work collaboratively to reach shared goals.

               From our valleys, across our mountains, and into our deserts, we envision
               a county that is a destination for visitors and a home for anyone seeking
               a sense of community and the best life has to offer.

4
4   COUNTY PROFILE    2014
County Profile
San Bernardino County is located in southeastern California, with Inyo and Tulare Counties to the north,
Kern and Los Angeles Counties to the west, and Orange and Riverside Counties to the south. San Bernardino
County is bordered on the east by the states of Nevada and Arizona. The county’s diverse geography and
extensive natural resources, as well as its proximity to major economic and population centers, provide unique
opportunities for varied industry sectors to thrive, including commerce, education, tourism and recreation.1
The following pages profile San Bernardino County’s geography, land use, population density, demographics,
housing, and employment characteristics.

                                                                                                                Cities, Towns and Communities in
                                                                                                                      San Bernardino County
                                                                                                                Valley Region   Mountain Region    Desert Region
                                                                                                                Bloomington* Angelus Oaks*         Adelanto
                                                                                                                Chino           Big Bear City*     Apple Valley
                                                                                                                Chino Hills     Big Bear Lake      Baker*
                                                                                                                Colton          Crestline*         Barstow
                                                                                                                Fontana         Lake Arrowhead*    Big River*
                                                                                                                Grand Terrace Lytle Creek*         Bluewater*
                                                                                                                Highland        Oak Glen*          Fort Irwin*
                                                                                                                Loma Linda      Running Springs*   Hesperia
                                                                                                                Mentone*        Wrightwood*        Homestead Valley*
                                                                                                                Montclair                          Joshua Tree*
                                                                                                                Muscoy*                            Lenwood*
                                                                                                                Ontario                            Lucerne Valley*
                                                                                                                Rancho Cucamonga                   Morongo Valley*
                                                                                                                Redlands                           Mountain View Acres*
                                                                                                                Rialto                             Needles
                                                                                                                San Antonio Heights*               Newberry Springs*
                                                                                                                San Bernardino                     Oak Hills*
                                                                                                                Upland                             Phelan*
                                                                                                                Yucaipa                            Piñon Hills*
                                                                                                                                                   Searles Valley*
                                                                                                                                                   Silver Lake*
                                                                                                                                                   Spring Valley Lake*
                                                                                                                                                   Twentynine Palms
                 Sources: San Bernardino County Land Use Services Department, 2007 General Plan (http://cms.                                       Victorville
                 sbcounty.gov/lus/Planning/GeneralPlan.aspx); California State Association of Counties (www.                                       Yermo*
                 counties.org); Census Bureau, 2010 Census Tract Reference Maps (www.census.gov/geo/www/maps/   *Unincorporated                    Yucca Valley
                 CP_MapProducts.htm)

GEOGRAPHY AND LAND USE
San Bernardino County is the largest county in the contiguous
United States:
• The county covers over 20,000 square miles of land.
• There are 24 cities in the county and multiple unincorpo-
                                                                                            Government Owned Land in San Bernardino County
  rated areas.
• 81% of the land is outside the governing control of the                                                                                  Government Owned Lands
  County Board of Supervisors or local jurisdictions; the ma-
  jority of the non-jurisdiction land is owned and managed by
  federal agencies.2

The county is commonly divided into three distinct areas, in-
cluding the Valley Region (sometimes divided into East and
West Valley), the Mountain Region, and the Desert Region:
• The Valley Region contains the majority of the county’s in-
   corporated areas and is the most populous region.
• The Mountain Region is primarily comprised of public lands
   owned and managed by federal and state agencies.
• The Desert Region is the largest region (approximately 93%
   of the county’s land area) and includes parts of the Mojave
   Desert.2

                                                                                                                                    2014    COUNTY PROFILE                5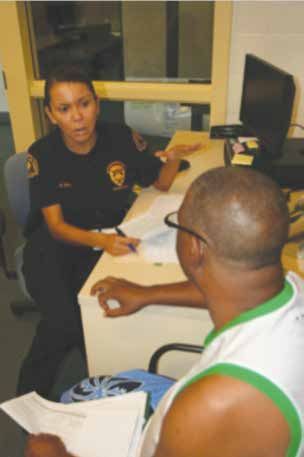
San Bernardino County is mostly undeveloped: San Bernardino County Land Uses
• More than three-quarters (80%) of San Bernardino
County is vacant land.
• 15% of the land is used for military purposes.
• Residential housing comprises 2.3% of the land area. 2.3%
• Industrial uses make up 0.8% of the county’s land use, Military
15%
followed by utilities (0.5%), agriculture (0.5%), transpor-
Other
tation (0.4%), and parks (0.2%). Developed
• Commercial uses, schools, offices, and government 5% 0.8%
Vacant
buildings each make up 0.1% or less of county land.3 80%
0.5%
0.5%
0.4%
POPULATION DENSITY 0.2%
0.1%
Given its vast land area, the county’s overall population
density is low: Residential Parks
• San Bernardino’s population density is estimated at 104
people per square mile, which is substantially lower than Industrial Commercial
the four neighboring counties compared (Riverside, San Utilities Schools
Diego, Orange, and Los Angeles Counties).4
Agriculture Office
• It is also lower than peer regions of Las Vegas, Phoenix,
and Miami. Transportation Government
• Within San Bernardino County, the Valley Region is the
Source: San Bernardino Associated Governments, April 2014
most densely populated area, with 73% of the population
residing in that region, but accounting for only 2.5% of
the county’s land area.5
Population Density for San Bernardino County, San Bernardino Valley,
• Based on these figures, the estimated population density and Peer and Neighboring Counties, 2013
of the Valley Region is approximately 2,977 persons per
square mile, which is similar to neighboring Los Angeles County (Major City)
Persons per
Square Mile
and Orange Counties.
San Bernardino 104
Clark (Las Vegas) 256
POPULATION Riverside 318
Maricopa (Phoenix) 436
San Bernardino County has the fifth largest population in
San Diego 766
California:
Miami-Dade (Miami) 1,345
• In July 2013, San Bernardino County’s population was
Los Angeles 2,467
estimated at over two million (2,088,371).
San Bernardino Valley Region 2,977
• Among all California counties, only Los Angeles County
Orange (Santa Ana) 3,945
(10,017,068), San Diego County (3,211,252), Orange
County (3,114,363), and Riverside County (2,292,507) Note: San Bernardino Valley land area is from 2007 and population data are from 2012. The
have more residents. remaining geographies reflect land area data from 2000 and population data from 2013.
• San Bernardino County is the twelfth most populous county
Sources: Analysis of data from the U.S. Census Bureau (Census 2000, 2012 American Community Survey
in the nation, with more residents than 15 of the country’s 5-Year Estimates, and 2013 Population Estimates Program) and the San Bernardino County Land Use
states, including Idaho, West Virginia, and New Mexico.6 Department, 2007 General Plan
Ranking by Population Growth
County Comparison, 2012-2013
Population Numeric Percent Ranking by Ranking by
County (Major City) State as of July 1, 2013 Change Change Numeric Growth Percent Change
(2012-2013) (2012-2013)
Maricopa (Phoenix) AZ 4,009,412 68,800 1.7% 2 229
Los Angeles CA 10,017,068 65,378 0.7% 3 718
San Diego CA 3,211,252 35,114 1.1% 5 454
Clark (Las Vegas) NV 2,027,868 30,209 1.5% 7 283
Orange (Santa Ana) CA 3,114,363 29,008 0.9% 9 557
Riverside CA 2,292,507 27,628 1.2% 10 409
Miami-Dade (Miami) FL 2,617,176 24,466 0.9% 16 558
San Bernardino CA 2,088,371 10,918 0.5% 48 921
Note: Ranking is among approximately 3,200 counties in the United States and runs from the largest to the smallest change.
Source: U.S. Census Bureau, Population Estimates Program (www.census.gov/popest/)
6 COUNTY PROFILE 2014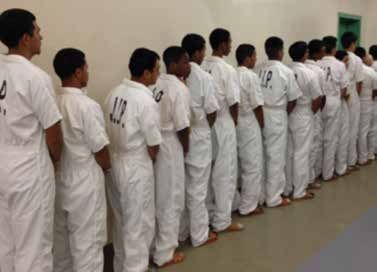
San Bernardino County’s population growth has occurred Components of Population Change
at a moderate but fairly steady rate over the past 40 San Bernardino County, 1971-2013
years: 400,000
• Average annual population growth in the 1970s was
350,000
3%.
• The annual growth rate jumped to 6% in the 1980s, 300,000
dropped back to 2% in the 1990s and remained 2% 250,000
in the 2000s.
200,000
• Since 2000, San Bernardino County’s population has
grown by approximately 21%.7 150,000
• Most recently (between 2012 and 2013), San Ber- 100,000
nardino County’s population grew 0.5% – slightly
50,000
slower than growth in the state as a whole (0.9%).8
0
San Bernardino County’s population is expected to -50,000
reach about 2.75 million by 2035:
-100,000
• Population growth is projected to continue at an av-
5
0
5
0
5
0
5
0
3
erage annual rate of between one and two percent,
97
98
98
99
99
00
00
01
01
-1
-1
-1
-1
-1
-2
-2
-2
-2
71
76
81
86
91
96
01
06
11
creating total growth of 36% between 2008 and
19
19
19
19
19
19
20
20
20
2035.
Natural Increase Net Migration
• This rate of growth is in the mid-range among
counties in the Southern California Association of Source: California Department of Finance, Table E-6, 1970-2013 (www.dof.ca.gov/research/demographic/reports/
view.php)
Governments (SCAG) region, with Imperial County
projected to grow the fastest (69%) and Orange
County the slowest (14%).9 Population by Race/Ethnicity
San Bernardino County, 2008-2012
After previously gaining residents primarily through 100%
migration, San Bernardino County’s growth since the 48% 48% 49% 50% 50%
early 1990s has come predominately from natural increase 90%
(births minus deaths): 80%
• From 1975 through 2006, San Bernardino County
70%
had positive net migration, with more people moving
into the area than out. 60%
• However, between 2007 and 2010, the county lost 50%
35% 35%
population through migration, with an estimated loss 33% 33% 32%
40%
of nearly 50,000 residents in these four years.
• Most recently, between 2011 and 2013, the county 30%
continued to experience negative net migration, losing 20%
approximately 18,000 residents. 8% 8% 8% 8% 8%
10%
• Domestic out-migration (moving out of the county 6% 6% 6% 7% 7%
to another location in the United States) has been the 0%
driver behind the loss since 2008, while international 2008 2009 2010 2011 2012
immigration (moving to the county from a foreign
Latino Asian/Pacific Islander
country) acted to reduce the net loss.
• The county added approximately 56,000 residents White Two or More Races
through natural increase between 2011 and 2013, Black or African American All Other
which when combined with negative net migration,
equals a total of nearly 38,000 new residents during Note: “All Other” includes American Indian/Alaska Native and any other single race.
this period.10 Latino includes any race. All race calculations are non-Latino.
Source: U.S. Census Bureau, 2008–2012 American Community Survey 1-Year Estimates
San Bernardino County is racially and ethnically diverse:
• Half (50%) of San Bernardino County residents are Native Americans in San Bernardino County
Latino, who may be of any race. Approximately 1% of the population in San Bernardino County is comprised of
• Among the remaining non-Latino residents, 32% are residents who are Native American alone and no other race (21,023 individuals
as of 2012). An additional 14,998 residents self-identify as Native American and
White, 8% are Black or African American, 7% are White, and 3,056 identify as Native American and Black or African American.
Asian or Pacific Islander, and 3% report two or more The most common tribal identification is Mexican American Indian, followed
races. Less than one percent of residents are American by Navajo, Choctaw, Yaqui, and Sioux. Federally recognized tribes within the
county include: the Chemehuevi Indian Tribe, the San Manuel Band of Mission
Indian/Alaska Native (0.6%).11 Indians, and the Fort Mojave Indian Tribe.
Note: “Native American” includes the Census categories of American Indian and Alaska Native, both
Latino and non-Latino. Tribal identification is for Native American alone and no other race.
Sources: U.S. Census Bureau, 2008-2012 American Community Survey, 5-Year Estimate, and Census 2010 SF-1,
Tables QT-P7, QT-P4, P-3
2014 COUNTY PROFILE 7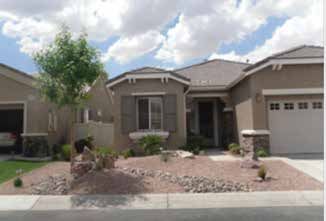
In 2012, 22% of the people living in San Bernardino County were foreign-born:
    • By comparison, in 2000, 19% of the population was foreign-born.12
    • The increase in the proportion of foreign-born residents follows legal immigration patterns.
    • In the 1980s, the county was adding an average of 2,800 residents each year from legal immigration. This grew to an average of
       4,700 in the 1990s. Since 2000, the county added an average of 8,000 new immigrants each year.13
    • Among residents over the age of five, 42% speak a language other than English at home.
    • Among these, 81% speak Spanish and 19% speak some other language.14
    • As of March 2014, there were 2,746 bilingual county employees who provide interpretation services as a part of their job. This is
       equivalent to approximately 15% of all county employees and represents at least five different languages.15

    San Bernardino County’s population is relatively young:
    • In 2012, the county’s median age was 33, compared to 37 nationwide.
    • As of 2012, 28% of the population was under age 18, while 10% was 65 years or older.
    • Between 2008 and 2012, the county’s population grew in all age groups except young children under age five and adults ages 25 to 44.16

     Population by Age
     San Bernardino County, 2008 and 2012

         Under 5 years

          5 to 14 years

        15 to 24 years

        25 to 34 years
                                                                                                                                     2008
        35 to 44 years
                                                                                                                                     2012
        45 to 54 years

        55 to 64 years

        65 to 74 years

        75 to 84 years

    85 years and over

                           0         50,000       100,000      150,000      200,000       250,000      300,000   350,000   400,000

    Source: U.S. Census Bureau, 2008 and 2012 American Community Survey (http://factfinder2.census.gov/)

    HOUSING
    Most homes in San Bernardino County are single-family, detached homes (71%):
    • There were 704,540 housing units available to county residents in January 2013.
    • As of January 2013, San Bernardino County had a housing vacancy rate of 12.5%, unchanged from the prior year.17
    • A majority of occupied units are owner-occupied (60%) compared to renter-occupied (40%).
    • The greatest proportion of homes was built in the 1980s (23%), followed by the 1970s (18%).18
    • In the last 10 years, construction permits peaked in 2004 with 18,017 permits granted, followed by another 16,635 permits granted
      in 2005 and 13,324 in 2006.
    • However, mirroring decreases elsewhere in the state, construction permits in San Bernardino County fell 76% between 2007 and
      2012 (7,752 and 1,897 permits, respectively).
    • Preliminary data for 2013 show an increase in housing permits granted at approximately 3,400 permits. This is more than double
      the 20-year low of 1,472 permits granted in 2011.19

    In 2012, there were 600,688 households in the county:
    • Families comprise 76% of the households in San Bernardino County, of which 69% are married-couple families and 31% are other
       families.
    • 13% of households with children under 18 are led by a single parent (male or female).
    • Overall, families with children under age 18 comprise 39% of all households.
    • Non-family households made up of one individual, or two or more unrelated individuals, comprise 24% of all households in San
       Bernardino County.20
    • At an average of 3.3 people per household, San Bernardino County has the fifth highest household size among California counties
       in 2012.
    • In comparison, the average household size in California is 2.9 and the national average is 2.6.21

8   COUNTY PROFILE                    2014
EMPLOYMENT
Labor Market Distribution and Growth
Labor market distribution analysis showcases San Bernardino County’s niche as a logistics hub:
• In 2012, the largest labor markets in San Bernardino County were Trade, Transportation and Utilities (27% of total employment),
Government (19%), Educational and Health Services (14%), Professional and Business Services (12%), Leisure and Hospitality
(9%), Manufacturing (8%), Construction (4%) and Financial Activities (4%).22
• Employment within the category of Transportation and Warehousing (a sub-category of Trade, Transportation and Utilities) is
more than twice as concentrated in San Bernardino County than in the United States as a whole (8% to 4%, respectively).23
The fastest growing sectors in the region are projected to be Construction and Health Care and Social Assistance:
• Employment in the construction industry is anticipated to grow by 3.9% between 2013 and 2016, followed by 3.7% growth in
Health Care and Social Assistance.
• The sectors where analysts anticipate the region will have a competitive advantage are Health Care and Social Assistance,
Transportation and Warehousing, Wholesale Trade, Retail Trade and Utilities.24
Sector Scorecard
Riverside-San Bernardino, Current (2012/13) and Three-Year Forecast
Current Three-Year Forecast
Employment Average Annual Employment Average Annual Local
Wages Concentration Percent Growth Competitiveness
Construction 63,293 $50,325 1.19 3.9%
Health Care and Social Assistance 149,790 $46,003 0.87 3.7%
Transportation and Warehousing 71,322 $42,968 1.54 2.7%
Arts, Entertainment, and Recreation 28,918 $29,967 1.33 2.6%
Wholesale Trade 53,635 $50,595 1.04 2.2%
Retail Trade 165,270 $28,568 1.21 2.1%
Utilities 9,888 $84,898 1.35 1.5%
Manufacturing 85,447 $48,070 0.79 1.3%
Note: Local competitiveness is an assessment of whether an industry has a regional competitive advantage compared to the nation in terms of generating employment – that is, an industry is outper-
forming the national average rate of growth or decline. Employment concentration measures whether employment in a particular sector is more or less concentrated than the national average (which
is 1.0); values over 1.25 suggest a comparative advantage or specialization in a particular sector.
Source: JobsEQ from the report “The San Bernardino County Economy: Economic Trends and Forecasts, Quarter 1 - Quarter 3, 2013” by Chmura Economics & Analytics for the Workforce Investment Board of San
Bernardino County. Current data are third quarter 2012 to third quarter 2013; Forecast data are three-year projections from third quarter 2013.
Business Size
Small firms comprise the majority of San Bernardino County’s economy, but large firms remained more stable during the downturn:
• Almost all of the businesses in the county have fewer than 100 employees (98%), and 67% of these have four or fewer employees.
• In terms of how employees are distributed among San Bernardino County businesses, in the third quarter of 2012, 56% of employees
worked for businesses with fewer than 100 employees, 25% worked for businesses with 100-499 employees, and the remaining
19% worked for large businesses with 500 employees or more.
• Between 2008 and 2012, the number of firms with 0-99 employees shrank by 47% and the number of firms with 100-499 employees
shrank 45%.
• There were 13% fewer firms with 500 employees or more since 2008, making this size of firm comparatively more stable.25
2014 COUNTY PROFILE 9ENDNOTES
1
California Employment Development Department, San Bernardino County Profile (www.labormarketinfo.edd.ca.gov)
2
San Bernardino County Land Use Department, 2007 General Plan (www.sbcounty.gov)
3
San Bernardino Associated Governments
4
U.S. Census Bureau (Census 2000, 2012 American Community Survey 5-Year Estimates, and 2013 Population Estimates Program) and the San Bernardino County Land Use Department, 2007
General Plan
5
San Bernardino County Land Use Department, 2007 General Plan (www.sbcounty.gov); U.S. Census Bureau, 2012 American Community Survey 5-Year Estimates (http://factfinder2.census.gov).
Valley Region includes Ontario Census County Division (CCD), San Bernardino CCD, and Yucaipa CCD.
6
U.S. Census Bureau, Population Estimates Program, 2013 Estimates by County (www.census.gov/popest/index.html)
7
California Department of Finance, Tables E-1 and/or E-2
8
U.S. Census Bureau, Population Estimates Program, 2013 Estimates by County
9
The SCAG region includes the counties of: Imperial, Los Angeles, Orange, Riverside, San Bernardino, and Ventura. Southern California Association of Governments, 2012 Regional
Transportation Plan Growth Forecasts (www.scag.ca.gov/forecast/index.htm)
10
California Department of Finance, Table E-6, 1970-2012
11
U.S. Census Bureau, 2012 American Community Survey, 1-Year
12
U.S. Census Bureau, 2012 American Community Survey (1-Year) and 2000 Census (SF 3)
13
California Department of Finance, Legal Immigration to California by County, 1984–2012 (www.dof.ca.gov/research/demographic/reports/view.php)
14
U.S. Census Bureau, 2012 American Community Survey, 1-Year
15
San Bernardino County Human Resources
16
U.S. Census Bureau, 2008 and 2012 American Community Survey, 1-Year
17
California Department of Finance, Table E-5 State/County Pop and Housing Estimates (www.dof.ca.gov/research/demographic/reports/view.php)
18
U.S. Census Bureau, 2012 American Community Survey, 1-Year
19
Housing and Urban Development Department (http://socds.huduser.org/permits/index.html).
20
U.S. Census Bureau, 2012 American Community Survey, 1-Year
21
U.S. Census Bureau, 2012 American Community Survey, 5-Year (Table B25010)
22
California Employment Development Department, Employment by Industry Data for San Bernardino County (www.labormarketinfo.edd.ca.gov/LMID/Employment_by_Industry_Data.html)
23
U.S. Bureau of Labor Statistics (www.bls.gov/cew/cewlq.htm)
24
JobsEQ from the report “The San Bernardino County Economy: Economic Trends and Forecasts, Quarter 1 - Quarter 3, 2013” by Chmura Economics & Analytics for the Workforce Investment
Board of San Bernardino County
25
Employment Development Department, Size of Business Data (www.labormarketinfo.edd.ca.gov/?PAGEID=138)
10 COUNTY PROFILE 2014special feature
11A LOOK BACK, A PATH FORWARD
Achieving the Countywide Vision
Four years ago, the County of San Bernardino commissioned and published the first annual
San Bernardino County Community Indicators Report, a data-driven summary on the status
of the economy, health, education, public safety, environment, and quality of life in America’s
largest county.
Each of those elements are key to the Countywide Vision, a set of shared goals adopted by the
Board of Supervisors, San Bernardino Associated Governments, and virtually all of the county’s
cities, towns and school districts in 2011 to help make San Bernardino County an attractive
and prosperous place to live, work and play. Each element is dependent on all of the others.
The economy will not prosper without a skilled and educated workforce graduating from our
schools. Children cannot learn if they are not healthy and safe. Wellness and public safety
depend on a healthy economy.
Since 2010, decision makers, business leaders, nonprofit organizations, community groups
and citizens have used the Community Indicators Reports to determine the county’s progress on
the challenges it faces and to track the progress of the Countywide Vision. The yearly report helps
promote advocacy for the county’s needs and drives stronger collaborations to address them.
This year’s report takes a look back at the data from the past four years to see how life in the
county has changed. The unemployment rate has fallen and wages have increased. Housing
values have risen as foreclosure rates have dropped. More students became eligible to attend
colleges and universities. Fewer students dropped out of school. Citizens became more conscious
of how much water they use and have tried to conserve. The public safety community dealt
with new mandates to track and rehabilitate offenders, while juvenile arrests fell.
In 2014, there are positive signs of an economic and social recovery, but there is more work to
do to improve San Bernardino County and realize the promise set forth in the Countywide Vision.
ECONOMY
When the 2010 Community Indicators Report Average Annual Unemployment Rate
was published, San Bernardino County was in San Bernardino County, 2010-2013
the midst of the Great Recession with an un- 25%
employment rate at 14.2%, significantly higher
than the state and national rates. 20%
An upturn in local wage and salary job growth 15%
14.2%
13.4%
began in 2011 and contributed to the slow 11.9%
decrease in the region’s unemployment rate, 10.1%
10%
according to Kelly Reenders, the County’s
Economic Development Agency Administrator.
5%
By 2013, the average annual unemployment
rate dropped to 10.1% in San Bernardino
County. As of March 2014, the unemployment 0%
2010 2011 2012 2013
rate was lower still, at 9.3%.
Source: California Employment Development Department (www.labormarketinfo.edd.ca.gov/cgi/
databrowsing/localareaproqsselection.asp?menuchoice=localareapro)
12 SPECIAL FEATURE 2014A LOOK BACK, A PATH FORWARD (Continued)
The logistics sector added more than
16,000 jobs since 2010 and the expansion
of Internet trade brought businesses like
Amazon’s Fulfillment Center to the re-
gion. Availability of undeveloped land and
proximity to the ports of Los Angeles and
Long Beach make the Inland Empire the
prime destination for manufacturing and
logistics to locate.
Randall Lewis, executive vice president of
the Lewis Group of Companies, a longtime
real estate business leader in the Inland
Empire, credits city and county officials
for creating a business-friendly environ-
ment over the last four years.
“The Countywide Vision sends a powerful
message to the business community that
this is a county that is looking ahead to
the future,” Lewis said.
He pointed to city managers and planning
directors who reached out to meet with
the Building Industry Association to create
strong relationships and come up with
solutions on how to make doing business
in the county easier.
“We discussed streamlining processes to
drive down the cost of doing business,
cutting red tape yet still maintaining the
high quality standards that the county
needs and deserves,” said Lewis. He noted
that the business-friendly attitude has given investors the confidence to do business in the
county, which will pay dividends for the economy in the future.
“Investors have choices and one of their first choices is where they should invest capital,” he
said. “When you hear of a county that says, ‘We want to work together,’ you just naturally pay
attention to that as opposed to a city or county where there is indifference.”
The County’s Workforce Investment Board focused on demand sectors, designing programs to
address skills gaps and move the unemployed into well-paying jobs.
“By identifying skills gaps, providing training programs, exploring funding sources, and
working with local educational institutions, the Workforce Investment Board has retained
and created jobs for the region,” Reenders said. “This approach has made the county attractive
for many employers through its skilled workforce and desirable labor pool.”
2014 SPECIAL FEATURE 13A LOOK BACK, A PATH FORWARD (Continued)
HOUSING
Over the four-year period from 2010 to 2013, home prices rose 30% and the number of under-
water mortgages and foreclosures throughout the county began decreasing.
Percentage of Mortgages Underwater While overall market conditions have
San Bernardino County, 2010-2013 improved, a deeper look at the numbers
reveals that there are still problems in the
100% county’s real estate market. The percent-
age of underwater mortgages has declined,
90%
but the increase in values is not uniform
across the county. Communities including
80%
Fontana, Ontario, Colton, Rialto, Victorville,
70%
Hesperia, and Apple Valley all have high
percentages of homes with negative equity.
60% Many homeowners in these communities
are underwater by hundreds of thousands
49.2%
50% of dollars and are unlikely to return to a
44.6%
positive equity position for many years.
40% 35.7%
Even homeowners who have equity in
30%
their homes may still have unaffordable
19.2% mortgages. “If these homeowners don’t
20%
have enough equity, are just barely in a
10%
positive position, or if their credit is less
than perfect, they may not be able to
0% refinance into an affordable mortgage,”
2010 2011 2012 2013 said Dena Fuentes, director of the
Source: CoreLogic
County’s Community Development and
Housing Department.
Homeowners who cannot refinance or get a loan modification are more likely to end up in
foreclosure, especially if their loan becomes unaffordable due to hardship such as a job loss or
an illness or if the interest rate adjusts and their mortgage payment amount increases.
Foreclosure rates throughout the county declined over the four-year period, but Fuentes said
that is due in part to lenders becoming less aggressive in foreclosing on delinquent homeowners
and homeowners becoming aware of
programs intended to help them prevent Percentage of Properties in Foreclosure
foreclosure. San Bernardino County, 2010-2013
25%
“The County initiated a program to raise
awareness of the existing state and federal
programs since the programs have not 20%
been well-advertised. By marketing the
legitimate assistance that is available to 15%
homeowners at no charge, we’ve been able
to get homeowners connected to these 10%
programs or to work with the nonprofit,
HUD-approved housing counseling agencies 5%
4.9%
3.6%
that help them get loan modifications or 2.2%
1.1%
solutions,” Fuentes said.
0%
2010 2011 2012 2013
Source: CoreLogic
14 SPECIAL FEATURE 2014A LOOK BACK, A PATH FORWARD (Continued)
The County joined with the cities of Ontario and Fontana to form a Joint Powers Authority
(JPA) to assist homeowners, especially those who are underwater or otherwise still struggling,
with alternatives to foreclosure.
The JPA’s efforts resulted in a website, www.saveyourhomesbcounty.org, which provides
information and resources, including links to housing counselors and information on
workshops and events throughout the county.
“We expect the programs to be able to offer affordable loan modifications to homeowners who
may not qualify for other programs, or other alternatives that will allow them to sell their
homes and lease them back for three to five years and purchase the home back in the future,”
Fuentes said. “This last option allows residents time to repair their credit if needed and develop
financial plans to make sure homeownership will be affordable for them in the future.”
Housing construction took a major hit during the Great Recession. Over an eight-year period,
housing construction permits plummeted by 90%, from 18,017 permits in 2004 to 1,897
permits in 2012. Unemployment was the major factor in the decline of housing construction,
according to Fuentes.
“Since construction is a major part of the Inland Empire economy, the drop in housing demand
triggered price declines, and construction stopped,” she said. “Construction layoffs fed the drop
in demand, since unemployed construction workers – along with all of the other unemployed
due to the recession – either couldn’t pay their mortgages or couldn’t buy housing.”
The construction industry is starting to slowly recover, but until demand and the housing
market return to “normal” it will be a slow process.
2014 SPECIAL FEATURE 15A LOOK BACK, A PATH FORWARD (Continued)
EDUCATION
A key element for economic recovery in this region is having a highly skilled and educated
workforce to help make San Bernardino County attractive to business.
There are more than 20 colleges and univer-
sities within the Inland Empire that provide
quality educational opportunities to our
residents, ranging from from night study
programs to doctoral degrees.
San Bernardino County Schools’ Alliance for
Education is a statewide model for project-
based learning and promoting more rigor and
relevance in the classroom. The program has
been leading the charge to work with schools
and districts in STEM (Science, Technology,
Engineering, and Mathematics) and Linked
Learning, which combines strong academics
with real–world experience in a wide range of
fields, such as engineering, arts and media,
and biomedical and health sciences. The
Alliance has hundreds of partners in business,
labor, government, education, community
and faith-based organizations.
Students from Colton High School’s new Health
Education Academy of Learning (HEAL) programs visit
Arrowhead Regional Medical Center to get a first-hand
look at health care.
Percentage of Students Meeting UC/CSU Eligibility Requirements, by Race/Ethnicity
San Bernardino County, 2008 and 2012
50%
45%
40%
38.6%
35%
30% 31.1%
25% 26.3%
25.4%
24.3%
20%
19.9%
15%
15.6%
14.4%
10%
5%
0%
African American Latino White All Students
2008 2012
Source: California Department of Education, DataQuest (http://data1.cde.ca.gov/dataquest/)
16 SPECIAL FEATURE 2014A LOOK BACK, A PATH FORWARD (Continued)
The innovative efforts appear to be working. When the first edition of the Community Indicators
Report was published in 2010, only 20% of high school graduates were prepared for college.
Now, more than a third of our high school graduates are eligible to attend California State
University and University of California colleges.
College readiness for Latino and African American high school graduates has improved
significantly, with 26% of Latino students now eligible for college courses up from 15% in
2008. Only 14% of African-American high school graduates were college-ready in 2008, but that
number jumped to 25% in 2013.
One successful County schools program that is helping student achievement is AVID (Advance-
ment Via Individual Determination), which was designed for students who come from families
with little to no college background. According to Dr. Gary S. Thomas, San Bernardino County
Superintendent of Schools, “AVID does an amazing job preparing first-generation college
students to succeed with their higher education goals.”
In the AVID 2013 graduating class, 87% of seniors had been accepted to at least one four-year
college or university.
County schools also provided 11th grade students with the opportunity to take college
entrance-like exams prior to their senior year in high school through the Early Assessment
Program (EAP). EAP has increased the number of students who successfully enter college
without taking remediation classes.
Percentage of Students Dropping Out of School, by Race/Ethnicity
San Bernardino County, 2009/10 and 2011/12
30%
25%
25.6%
20%
20.7%
19.1%
17.5%
15%
14.7% 14.9%
13.3%
10%
9.6%
5%
0%
African American Latino White All Students
2009/10 2011/12
Source: California Department of Education, DataQuest (http://data1.cde.ca.gov/dataquest/)
In 2009, County Superintendent Dr. Gary S. Thomas issued a Call to Action to bring attention
to the county’s high dropout and low graduation rates. The committee of representatives from
business and labor, community and faith-based organizations, educators and parents who
took part in the Call to Action examined data and best practices, which were shared with
districts and superintendents countywide. One of those research-based, best practice programs
is Positive Behavior and Intervention Systems (PBIS). The Silver Valley Unified School District
adopted PBIS and saw a reduction in suspension rates at its school sites, from 20% to 6.2%
over three years.
In the past three years, the county’s overall high school dropout rate has decreased by 30%,
while graduation rates have increased nearly 10%.
2014 SPECIAL FEATURE 17A LOOK BACK, A PATH FORWARD (Continued)
Graduation Rate, by Race/Ethnicity
San Bernardino County, 2009/10 and 2011/12
100%
90%
80% 82.7%
75.1% 77.4% 77.2%
70%
70.4% 70.4%
67.7%
60%
60.3%
50%
40%
30%
20%
10%
0%
African American Latino White All Students
2009/10 2011/12
Source: California Department of Education, DataQuest (http://data1.cde.ca.gov/dataquest/)
Our collective impact approach to solving complex problems is critical to the overall success of
our youth and quality of life in our region. In 2014, the Education Element Group developed
a Cradle to Career Roadmap to identify key milestones for a child’s academic, personal, social
and career readiness.
18 SPECIAL FEATURE 2014A LOOK BACK, A PATH FORWARD (Continued)
“We can’t know the spectrum of challenges students come to school with each day, but some of
our students have personal and social needs that must be met before learning can ultimately
take place,” Dr. Thomas said.
In the Cradle to Career Roadmap approach, families, educators, government, business, labor,
and community-based organizations act as pillars of support for students from the time they
are born until they complete advanced education programs or certification. This approach
ensures students have the network of support for strong personal and social readiness so they
can fully benefit from their academic program.
Beginning with the class of 2015, all San Bernardino City Unified School District students in
the cities of San Bernardino and Highland will be guaranteed admission into California State
University, San Bernardino if they fulfill basic requirements. Leaders from San Bernardino City
Unified and Cal State San Bernardino reached an agreement in April 2014 to allow students
admission at the university if they meet college entrance pre-requisites and stay on track with
attendance and grades.
“It’s crucial that students are prepared to go to college when they graduate from high school,”
said Cal State San Bernardino President Dr. Tomás D. Morales. “This agreement will make the
path to college smoother for qualified students, and it is also beneficial once they arrive at our
campus. Students will be able to start taking courses within their major sooner, and this also
helps speed the time to reach graduation.”
ENVIRONMENT
All of the elements of a “complete county” which the Countywide Vision aims to achieve depend
on a healthy environment and an ample supply of clean water. At the end of 2013, California
witnessed a historic drought with Governor Jerry Brown declaring a state of emergency and
urging the state to conserve water by 20%. The good news is water use was down in San
Bernardino County over the four-year period. The average water consumption per capita per
day was 252 gallons in 2012, down from a high of 284 gallons in 2009.
In San Bernardino County, the Mojave Water Average Urban Water Consumption
Agency (MWA) region encompasses 4,900 Selected Water Agencies in San Bernardino County, 2009-2012
square miles in the arid Mojave Desert that
300 284
annually receives less than six inches of
rainfall. The agency has in place two primary 246 252
250 240
strategies, including a groundwater recharge
Gallons per Capita per Day
initiative and a conservation program. Since
200
launching an aggressive water conservation
program, the MWA has already surpassed the
state-mandated 20% per capita reduction 150
requirement for the year 2020. Since 2000,
the MWA region has reduced its per capita 100
water consumption by 30%.
50
MWA’s water conservation programs have
achieved a significant reduction in water 0
consumption by helping to promote a 2009 2010 2011 2012
culture of conservation. One of the agency’s
Source: “Analysis of data provided by Fontana Water Company; Santa Ana Watershed Project
most successful programs is the Cash for Authority; Cucamonga Valley Water District; Mojave Water Agency; City of Ontario Municipal
Grass program that offers participants a Water Agency; City of San Bernardino Municipal Water Department; Victorville Water District;
California Department of Finance, Table E-4
2014 SPECIAL FEATURE 19A LOOK BACK, A PATH FORWARD (Continued)
Cash for Grass Program, before and after
50 cent per square foot rebate for turf removed. Since 2008, the Cash for Grass program has
resulted in the removal of more than 6.1 million square feet of turf.
“In addition to this program, the agency has promoted water-wise landscaping, efficient drip
irrigation, and has cosponsored low-flow toilet replacement programs throughout the region,”
said Kirby Brill, general manager of the Mojave Water Agency. “Looking to the future, the agency
will launch another Cash for Grass program aimed at removing larger areas of turf at commercial,
industrial, and institutional facilities.”
PUBLIC SAFETY
Public safety is the lynchpin for education, the economy, housing, wellness, our county’s image,
and our quality of life. In San Bernardino County, property and violent crime statistics contin-
ued to fluctuate over the four-year period, but the overall crime rate declined during the past 10
years with drops in domestic violence, homicides and juvenile arrests.
Crime Rate
Riverside-San Bernardino, 2003-2012
4,500
4,000
3,500
3,000
Crimes per 100,000
2,500
2,000
1,500
1,000
500
0
2003 2004 2005 2006 2007 2008 2009 2010 2011 2012
Violent Crimes Property Crimes
Source: Federal Bureau of Investigation, Uniform Crime Reporting Program (www.fbi.gov/ucr/ucr.htm)
20 SPECIAL FEATURE 2014A LOOK BACK, A PATH FORWARD (Continued)
Juvenile Arrests
San Bernardino County, 2009-2012
12,000
10,000
Number of Arrests
8,000
6,000
4,000
2,000
0
2009 2010 2011 2012
Misdemeanor Felony
Source: San Bernardino County Probation Department, Research Unit
What causes decreases in crime statistics is always difficult to identify. However, the Sheriff’s
Department and the Probation Department continue to focus on alternative programs to help
youth stay on the right path and redirect offenders to a healthier lifestyle.
These programs are geared toward juveniles who are on the verge of heading down the wrong
path, such as alcohol abuse, drug use, gangs and violence, and who need positive reinforcement.
The juvenile programs consist of the Police Activities League (PAL), The Self-discipline, Honor,
Obedience, Character, and Knowledge (S.H.O.C.K.) program, and the Juvenile Intervention
Program (JIP).
PAL programs offer teens community activities such as boxing, which teaches the benefits of
physical fitness, discipline, and commitment. The program builds partnerships and relationships
with deputies, and amateur and professional
boxing coaches.
S.H.O.C.K. in Apple Valley is a 10-week juvenile
intervention program. During the program the
teens participate in classroom instruction and
physical fitness activities. A mandatory component
of the program is the Parent Project which equips
parents and guardians with proven tools for
effective parenting.
JIP was designed to show troubled teens the reality
of incarceration. The program redirects negative
behavior, provides partnership with law enforcement,
the community and schools, increases understanding
of the criminal justice system, and emphasizes the
legal consequences of violating the law.
Sheriff’s Department J.I.P. program “Over the last couple years the Department has
experienced an increase in children participating
in the juvenile intervention programs,” said Sgt. Anthony Vega of the Sheriff’s Public Affairs
Division. “Feedback has revealed that many participants became productive members of society
and parent evaluations report significant positive increases in teens’ behaviors. We believe
2014 SPECIAL FEATURE 21A LOOK BACK, A PATH FORWARD (Continued)
these programs are helping to reduce crime by allowing teens to participate in productive
after-school activities and by showing them the outcomes of negative lifestyle choices.”
INROADS, a program developed in collaboration with the
Sheriff’s Department, Chaffey Joint Union High School
District and the San Bernardino County Superintendent of
Schools, is dedicated to the education of inmates. Inmates
are enrolled in academic, vocational, and crisis intervention
classes essential to facilitate their rehabilitation during
incarceration and upon release. Some of the classes offered
include anger management, living skills, and G.E.D. prepa-
ration. Vocational training includes automotive mechanic,
employment readiness, and the Fire Camp Crew.
“The Department believes these programs provide opportunities
for inmates to develop an improved sense of well-being and a
better quality of life upon release,” Vega said. “Statistics from
2010 to 2012 reveal approximately 40% of the 1,115 inmates
who completed the program did not re-offend.”
The Probation Department maintained a progressive approach
in the community by visiting offenders in their homes and
treatment programs to help ensure they don’t reoffend, said
Chris Condon, Probation Division Director.
“We also have formed three Day Reporting Centers which act
as one-stop shops, a virtual grocery store of services and
resources for these offenders,” Condon said. “Working in
concert with Public Health, Department of Behavioral Services,
Workforce Development, and our GPS monitoring services, we are
able to completely enmesh these offenders, and in some cases
Probation offers services to offender family members, with the services that they need to succeed.”
Going Forward
Much of the progress of the last four years was made possible by collaboration and
innovation. New ideas were formed to tackle long-term problems. Groups that do not
always come together – such as business and schools – broke down silos and formed
alliances to help reach a common goal. New programs were developed to hone in on an
issue and meaningful data were collected in the Community Indicators Reports to
monitor the results.
In the years to come, we expect more challenges but are determined to continue
collaborating to solve problems and provide groundbreaking solutions to move forward
on the economy, health, education, public safety, the environment and all elements
essential to achieving the Countywide Vision in San Bernardino County.
22 SPECIAL FEATURE 2014economic and
business climate
Since the publication of the first Community Indicators
Report in 2010, San Bernardino County’s
employment and wages have steadily increased,
countering the devastating effects of the Great
Recession. Housing values are on the rise and
foreclosures and underwater mortgages continue
to decline. Despite rising home prices and
remaining instability in the housing market,
San Bernardino County remains the most
affordable region to live in Southern California.
Protecting Residents’ Homeownership
As part of its effort to reduce foreclosures and stabilize neighborhoods within
the county, in 2012 the San Bernardino County Department of Community
Development and Housing implemented a Homeownership Protection Program
to inform homeowners of state and local foreclosure prevention resources.
Through a dedicated website, email distribution and social media outreach,
the program provides information on local foreclosure prevention events, financial
coaching, home repair workshops, and homebuyer resources for residents.
23You can also read