U.S.-CHINA COMPETITION ENTERS THE DECADE OF MAXIMUM DANGER
←
→
Page content transcription
If your browser does not render page correctly, please read the page content below
U.S.-CHINA COMPETITION
ENTERS THE DECADE OF
MAXIMUM DANGER
Policy Ideas to Avoid Losing the 2020s

Gabriel Collins, J.D.
Baker Botts Fellow in Energy & Environmental Regulatory Affairs,
Rice University’s Baker Institute for Public Policy

Andrew S. Erickson, Ph.D.
Professor of Strategy, China Maritime Studies Institute, Naval War College

December 2021

                                     U.S.-China Competition Enters the Decade of Maximum Danger | 1
Disclaimer: This report is designed to offer potential policy ideas, not advocate
                        for specific private sector outcomes. It does not represent the position of any
                        organization with which the authors are affiliated. Neither author has a financial stake
                        involved, or any conflict of interest pertaining to the subjects discussed.

                        Acknowledgement: The authors wish to thank many anonymous reviewers for their
                        insightful comments. Their inputs made this a stronger, more useful study. Any errors
                        are the authors’ alone. For earlier works informing the present argument, please see
                        Andrew S. Erickson and Gabriel B. Collins, “A Dangerous Decade of Chinese Power Is
                        Here,” Foreign Policy, October 18, 2021, https://foreignpolicy.com/2021/10/18/china-
                        danger-military-missile-taiwan/; Gabriel B. Collins and Andrew S. Erickson, “China’s
                        S-Curve Trajectory: Structural Factors Will Likely Slow the Growth of China’s Economy
                        and Comprehensive National Power,” China SignPost™ (洞察中国) 44 (August
                        15, 2011), http://www.chinasignpost.com/wp-content/uploads/2011/08/China-
                        SignPost_44_S-Curves_Slowing-Chinese-Econ-Natl-Power-Growth_20110815.pdf.

                        Contact information: gabe.collins@rice.edu and andrew_erickson@fas.harvard.edu.

                        © 2021 by Rice University’s Baker Institute for Public Policy

                        This material may be quoted or reproduced without prior permission, provided
                        appropriate credit is given to the authors and the Baker Institute for Public Policy.

                        Wherever feasible, papers are reviewed by outside experts before they are released.
                        However, the research and views expressed in this paper are those of the individual
                        researchers and do not necessarily represent the views of the Baker Institute or the
                        position of any organization with which the authors are affiliated or have been affiliated.

                        Gabriel Collins, J.D.
                        Andrew S. Erickson, Ph.D.
                        U.S.-China Competition Enters the Decade of Maximum Danger:
                        Policy Ideas to Avoid Losing the 2020s

                        https://doi.org/10.25613/T3FG-YV16

2 | Rice University’s Baker Institute for Public Policy
Executive Summary
• U.S. and allied policymakers now face a “decade of danger” through roughly
  2030 emanating from the confluence of a peaking paramount leader (Chinese
  President Xi Jinping), a peaking Chinese Communist Party (CCP), and a peaking
  People’s Republic of China (PRC) as the country begins to experience the
  “S-curved slowdown”1 common to great powers.
• The PRC has achieved an extraordinary rise in power over the last two-plus
  decades and has succeeded in multiple regional coercion actions over the past
  decade; but its comprehensive national power will likely peak between 2030 and
  2035—or, quite possibly, sooner.
• Within the next five years, PRC leaders are likely to privately conclude that
  China’s deteriorating demographic profile, structural economic problems, and
  technological estrangement from global innovation centers are eroding its
  leverage vis-à-vis Taiwan and other strategic objectives. As Xi internalizes these
  challenges, his foreign policy is likely to become even more risk-embracing.
• Xi’s risk appetite will likely be amplified by his nearly decade-long track record
  of successful revisionist actions against the rules-based order. Notable examples
  include the PRC perpetrating atrocities against humanity in Xinjiang,2 coercively
  enveloping Hong Kong,3 occupying Bhutanese lands,4 violently challenging its
  borders with India, occupying and militarizing disputed features and zones in
  the South China Sea,5 ramping up air and maritime incursions against Japan and
  Taiwan,6 and seeking to illegally restrict or endanger foreign military activities in
  international waters and airspace even as it operates permissively—sometimes
  covertly, sometimes aggressively—around the world and across all domains.
• For the Party, these “victories” have substantively exhausted the “lower-cost,
  high-payoff” options for aggrandizement, while emboldening Beijing as it eyes
  the biggest single revisionist prize: Taiwan.
• Xi, the CCP he leads, and the PRC they control, are presently pursuing extremely
  ambitious strategic goals for China’s “national rejuvenation.” Addressed in the
  nation’s five-year plans, these objectives are linked to key anniversaries, including
  two centenaries—the 100th anniversary of the CCP’s founding in 2021 and that of
  the PRC in 2049.
• Unless deterred successfully, Xi likely seeks a major historical achievement
  regarding Taiwan by the end of this decade, his maximum expected window of
  personal health and political opportunity. The 68-year-old leader, whose personal
  abilities, preparations, and available national power are all coming to a peak,
  will likely be tempted to make his mark on history through a major move against
  Taiwan near a third key milestone goal year—2027, the 100th anniversary of the
  founding of the People’s Liberation Army (PLA), with its “original mission” of
  defeating the Kuomintang. Indeed, China has advanced key PLA modernization
  goals from 2035 to 2027.

                                                 U.S.-China Competition Enters the Decade of Maximum Danger | 3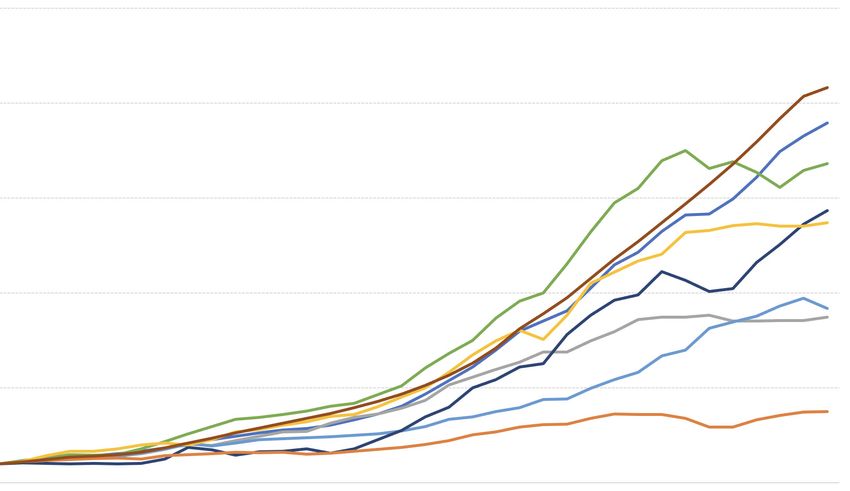
• Furthermore, the PRC’s externally-facing aggression increasingly appears to be
                            structural in nature. For instance, the lack of apparent pushback from within the
                            CCP against danger-generators, like its increasingly hardline approaches toward
                            Taiwan, suggests that the Party has internalized an aggressive approach to foreign
                            and security policy. Key challenges could therefore outlive Xi if he lost influence,
                            became incapacitated, or—in a less likely scenario—was removed from power.
                          • Beijing’s actions during the past 10 years have triggered countermeasures, such
                            as the Australia-United Kingdom-United States (AUKUS) trilateral security pact,7
                            but concrete constraints on China’s strategic freedom of action are currently
                            not on track to fully manifest until beyond 2030. Absent stronger diplomatic,
                            economic, and military pushback, Beijing will likely conclude that the 2021-to-
                            late-2020s timeframe still favors the PRC. It is quite remarkable, and dangerous,
                            how little cost China has suffered from its actions over the last decade.
                          • While China’s growth in national power is slowing, the United States and its allies
                            cannot simply avoid the contest of the decade by “waiting Beijing out.” The
                            situation will get far worse before it gets better, and we will only avoid disaster if
                            we “hold the line” at this critical time. Failure to do so would allow unacceptable
                            consequences in the process, such as losing Taiwan and severely damaging or
                            destroying regional alliances and partnerships—transformative debacles that
                            would remove remaining guardrails to PRC aggression and give it a “second
                            wind.”
                          • Precisely when China will peak is uncertain, but it is very likely to do so within the
                            next few years. Given the potential for irreversible catastrophe if near-term PRC
                            aggression is not countered effectively, the United States and its allies should
                            optimize planning and preparations to address maximum up-front threats, and
                            accept corresponding tradeoffs and risks: the best directed-energy weapons in
                            coming decades will matter little if we lose Taiwan on our watch.
                          • Accordingly, U.S. planners must urgently mobilize resources, effort, and risk
                            acceptance to maximize capacity to deter PRC aggression throughout this
                            decade—literally starting now.
                          • In athletic terms, the U.S. and its allies must now marshal their efforts and
                            focus to “peak” near-term capabilities and maximize their strategic impact
                            by innovatively employing assets that currently exist or can be operationally
                            assembled and scaled within the next several years.
                          • Xi’s repeated revisionist success indicates that to “hold the line,” proactively
                            push back, and preserve the rules-based order during the 2020s decade of
                            danger, America and its allies must dramatically enhance the robustness and
                            agility of their collective deterrence and warfighting posture. “Holding the line”
                            is fundamentally about maintaining the status quo, but doing so in practice
                            requires opposing the PRC’s revisionist “slow boil” that has rendered Taiwan and
                            the region less secure and will continue to do so absent concerted, impactful
                            counter-actions.

4 | Rice University’s Baker Institute for Public Policy
• U.S. and allied efforts must emphasize to China that: (1) the window for action
against Taiwan is closed tight; (2) PRC attempts at regional revisionism will be
met robustly across the diplomatic, economic, technological, and operational
spectrum—including intensified presence and operations vis-à-vis the East and
South China Seas; and (3) the U.S. and its allies are jointly preparing, planning,
and exercising to ensure maximum interoperability, coordination, and capacity to
prevail should deterrence fail.
• The United States has taken too long to warm up to, and focus on, great power
competition with China, but it retains formidable advantages and agility that will
help it to prevail—provided that it goes all in now. This will require resourcing the
mission commensurate with its importance. The U.S. consistently spent $50 billion
annually (and sometimes much more) in Afghanistan and Iraq for much of the
past two decades.8 Yet the Fiscal Year 2022 defense budget recently approved by
Congress only appropriates $7.1 billion for the Pacific Deterrence Initiative serving
the vast, vital Indo-Pacific region. To avoid “losing the 2020s”—and with it the
2030s and beyond—Washington must put its maximum money and effort where its
mouth is, starting now.
An Unforgiving Gauntlet to Run
Washington now has an unforgiving, but vital, “gauntlet” to run. This rough metaphor—
having no choice but to push through a hostile assembly in order to reach a critical goal,
while being exposed to vituperation and danger—conveys the urgent, serious situation
in which America must prevail over peaking PRC threats during this decade.
Beijing’s tactical public actions and propaganda mask a growing private awareness
that its power and latitude for irredentist action face looming constraints. Meteoric
PRC achievements are likely to taper and level off in coming years. The closer China
approaches leading-edge military capabilities, for instance, the more expensive,
complicated, and difficult it will be for it to advance further. Moreover, China’s
erstwhile adversaries are not standing still. As Washington intensifies its strategic
focus on China and the Indo-Pacific region, rallies a coalition of allies and like-minded
states, and deploys new military hardware, Beijing will face a formidable combined
economic and military mass backed by a strategic focus that was absent during most
of the past 20 years as China rose to become a regional colossus.
Not knowing exactly when domestic and external constraints will bite conclusively—
but knowing that when Beijing sees the tipping point in its rearview mirror, major
rivals will soon recognize it too—amplifies Xi’s anxiousness and may impel him to
act on a compressed timeline. This dynamic has likely helped to drive the dramatic
acceleration in China’s revisionist actions following Xi’s ascension to power in 2012.
U.S.-China Competition Enters the Decade of Maximum Danger | 5These actions have occurred within and outside of the PRC’s internationally
recognized borders and encompass manifold activities. The PRC’s malign actions
against the rules-based order range from physical occupation of territory (South
China Sea features and Bhutan) and physical assaults on neighboring states (India),
to severe political (Hong Kong) and ethno-religious (Xinjiang) oppression, to political
interference operations (Australia and New Zealand), to physical coercion of societies
beyond de facto PRC control (Taiwan) and economic coercion of sovereign states
(Australia), to illegal and dangerous military operations around the world and in all
domains. Beijing also increasingly utilizes economic coercion to penalize freedom of
thought and expression far from its borders—for instance, the blackout of NBA games
on state television networks in 2019 after the Houston Rockets’ then-general manager
tweeted support for pro-democracy protesters in Hong Kong.
Figure 1: Indo-Pacific Locations of Selected PRC Assault on
Rules-Based Order, 2010–2021
Sources: BBC, GADM, Reuters, authors’ analysis.
6 | Rice University’s Baker Institute for Public PolicyThe most dangerous single flashpoint is Taiwan, where U.S. and allied success, or failure,
will be fundamental and could trigger consequences that reverberate for the remainder
of the century. There is a growing chance of a major move against Taiwan by the late
2020s. This would likely happen after an extraordinary ramp-up in PLA capabilities, but
before the power and grasp of Xi or the Party-state has ebbed or Washington and its
allies have fully regrouped and rallied to the challenge.
Just as China is mustering its own comprehensive capacity, so too must America
intensify its focus and deployment of resources. Conversely, if Washington fails to
marshal its forces promptly, its achievements after 2030 or 2035 will matter little. Major
revisionist actions consummated during the 2020s would enable Beijing to cripple
the free and open rules-based order, and entrench its own position by economically
subjugating regional neighbors (including key U.S. treaty allies) to a degree that could
offset the strategic headwinds that China increasingly faces. Were that allowed to
happen, the United States would face a degree of strategic disadvantage it has not
seen in the Indo-Pacific region since Imperial Japan’s regional apogee in 1942. China’s
“gray zone” coercion against Taiwan and regional neighbors including the Philippines
is already underway and growing. Deterring invasion is critically important, but
additionally the status quo has changed and continues to change because of Chinese
coercion. Taiwan is worse off today internationally than last year, and will be worse off
next year unless we demonstrate full awareness of the “slow boil” China has going and
counter it concertedly. Figure 2 lays out sample future scenarios that Washington and its
partners must seek to deter, lest they risk a cycle of escalation.
Figure 2: China’s Potential Next Set of Revisionist Actions
Action Warning Timetable
Maritime Militia actions against Taiwan’s outlying islands such as Pratas Days
PLA blockade of Taiwan’s outlying islands Days
Invasion of Kinmen or other outlying Taiwanese islands Weeks
Customs quarantine possibly escalating to maritime blockade of Taiwan Days/Weeks
Missile/Air “exercises” to disrupt air and maritime traffic into Taiwan Hours/Days
Full invasion of Taiwan Weeks/Months
Sources: David Lague and Maryanne Murray, “War Games—T-Day: The Battle for Taiwan,” Reuters,
November 5, 2021, https://www.reuters.com/investigates/special-report/taiwan-china-wargames/;
authors’ analysis.
U.S.-China Competition Enters the Decade of Maximum Danger | 7Deterrence is never certain. But, backed by worst-case preparations, it offers the
highest probability of avoiding the virtual certainty that an Indo-Pacific region
dominated by a CCP-led China would imperil treaty allies, threaten the American
homeland, and likely set the stage for worse to come. Accordingly, U.S. planners
should immediately mobilize resources, intensify efforts, and accept greater risks in
order to deter PRC action throughout this critical decade.
Peaking PRC, Peaking CCP, Peaking Xi
The triune relationship between PRC national power, the Party’s security, and
Xi’s position will come into full relief during the decade of danger. As Beijing
aggressively seeks to undermine the very international order that facilitated its rise,
intensifies coercion of Taiwan, and promotes a narrative of inevitable PRC strategic
domination in Asia and beyond, it creates a dangerous contradiction between its
goals and the sustainability of its means to achieve them. A range of demographic,
economic, and other data, coupled with key dynamics, suggest that the PRC is
in fact likely nearing the apogee of its relative power. By the late 2020s on the
front end, to 2035 on the back end, the PRC will likely cross a tipping point from
which it may never recover strategically. Intensifying headwinds constraining PRC
growth, while not publicly acknowledged by Beijing, help to explain Xi’s high—and
apparently increasing—risk tolerance.9
PRC statecraft now disfavors strategic patience not merely because Xi is ambitious due
to his own personal and political timeline as he nears the potential zenith of his power,
but also because the macro environment (and by extension, time) is now sliding shut
China’s window of strategic opportunity. Pressures are especially acute on the debt,
demographic, and economic growth fronts, as well as resource insecurity—which, for
great superpowers, can induce costly financial and security investments and precipitate
ruinous foreign policy entanglements nonetheless believed necessary by their leaders.
Economic power is especially foundational. It is an irreplaceable prerequisite for
creating and sustaining military power over the multi-decade timeframe necessary to
prevail in a great power competition. To paraphrase Napoleon, an army marches on
its stomach but is built on its nation’s economy. Technologically advanced equipment,
maintenance, world-class personnel, and their collective operation at near-or-full
superpower scale costs on an annual basis more than most countries’ entire gross
domestic product (GDP). Maintaining—or even setting—the cutting edge and
projecting force beyond one’s territorial boundaries costs more still. Accordingly,
China’s economic trajectory will be a key enabler—or constraint—on Xi’s increasingly
clear ambitions for regional supremacy, near-or-full peer global influence, and force
projection capabilities.
8 | Rice University’s Baker Institute for Public PolicyFigure 3: The China Strategic Danger Window — PRC milestone dates in red font,
U.S. assessments in black
Potential PRC “action date”
regarding Taiwan, according to
ADM Aquilino, Commander, U.S.
ADM Davidson, ex-INDOPACOM
Indo-Pacific Command: “My opinion
commander
is that this problem [PRC takeover
of Taiwan] is much closer to us than
most think…”
New interim PRC milestone for
military modernization emphasizing
mechanization, informatization, and Become “world-class” military,
intelligentization supplant United States as
Complete process of military leading global power
modernization (prior to October
2020 5th Plenum meeting)
2021 2027 2030 2035 2049
Decade of maximum strategic danger
Sources: Andrew S. Erickson, “Make China Great Again: Xi’s Truly Grand Strategy,” War on the Rocks,
October 30, 2019, https://warontherocks.com/2019/10/make-china-great-again-xis-truly-grand-strategy/;
Erickson and Collins, “A Dangerous Decade of Chinese Power Is Here.”
Xi likely seeks a major historical achievement regarding
Taiwan by the end of this decade, his maximum
expected window of personal health and political
opportunity. ... near a ... key milestone goal year—2027,
the 100th anniversary of the founding of the ... PLA …
with its “original mission” of defeating the Kuomintang.
Indeed, China has advanced key PLA modernization
goals from 2035 to 2027.
U.S.-China Competition Enters the Decade of Maximum Danger | 9Economic Trajectory: Implications for China’s
Military-Strategic Prospects
China’s economy appears to be well into the flattening phase of the “S-curve”
trajectory often used to describe the stages of a nation’s economic growth lifecycle.10
By extension, that position also strongly correlates with comprehensive national
power. Most fundamentally, the S-curve is a conceptual lens that, while shaped
somewhat by a country’s specific circumstances, follows a common succession of
contours: (1) slow growth at a polity’s inception, (2) more rapid expansion as growth
begets growth and available resources snowball, (3) a downshift in rate of growth
as countervailing forces increasingly coalesce, and (4) slower growth and eventual
plateau or even decline (Figure 4).
Figure 4: The S-Curve of Economic and Comprehensive National Power
Economic &
Comprehensive
National Power Plateau
Slow Inception
Snowball phase,
rapid power accrual
Slow Inception
Multiple economic activity signals suggest that China’s economy is now doing one of
two fundamental things: (1) entering the early phase of another “bricks and mortar”
growth super-cycle like it experienced from the early 2000s to the early 2010s, or
(2) doubling down on a “steel and cement” economic model, but with diminishing
returns as each successive round of investment struggles to inflate a larger balloon.
If the first explanation is more accurate, then our strategic economic assessment
requires recalibration. But the body of empirical evidence increasingly points to the
second explanation being the more likely trend in practice.
10 | Rice University’s Baker Institute for Public PolicyTo begin with, consider the trajectory of key economic activity indicators since 1985.
We use the production of electricity, cement, sulfuric acid; the consumption of diesel
fuel and steel; and the volume of rail freight, because they are likely more indicative of
actual happenings in the economy than the heavily massaged official GDP numbers.
This set of indicators is an expanded version of the “Li Keqiang Index” that the now-
premier used to track economic activity when he was Party secretary in Liaoning
Province in the mid-2000s.11 Readers should note that for cement and sulfuric acid,
production offers a useful proxy for demand, as these bulk commodities are primarily
produced for domestic consumption, and
data are more accessible and reliable for
dozens or hundreds of major producers
than they are for potentially hundreds of The United States and its allies
thousands of consumers spread across cannot simply avoid the contest
China’s sprawling economy. of the decade by “waiting
During Phase 1 (1985–early 2000s), the
Beijing out.” The situation will
indicators all increased, with electricity, get far worse before it gets
cement, diesel fuel, and sulfuric acid better, and we will only avoid
most closely tracking the “official” GDP disaster if we “hold the line” at
number. Rail cargo volumes grew, albeit this critical time. Failure to do
on a flatter trajectory, as did steel (Figure
5). Phase 2 (early 2000s–early 2010s) saw
so would allow unacceptable
demand and production rise significantly consequences in the process …
across the board, with electricity, diesel that would remove remaining
fuel, steel, cement, and sulfuric acid all guardrails to PRC aggression and
accelerating. Phase 3 (2013–2016) marked give it a “second wind.”
a transitional phase in which many key
building-block commodities took a growth
breather in a fairly synchronized fashion.
This started with a demand plateau for
diesel fuel beginning in 2012, a near-term peak in steel use in 2013, and a potentially
more structural peak in cement production in 2014—the high-water mark to date for
that material. Rail freight followed with down years in 2015 and 2016. Divergences
between production and consumption of vital input materials and the uncannily
smooth continued rise of official GDP numbers during the mid-2010s increase
our confidence that the tangible metrics we are using provide a more “honest”
assessment of actual economic activity.
U.S.-China Competition Enters the Decade of Maximum Danger | 11Figure 5: Trajectory of Critical Economic Indicators in China (Index, 1985=1)
25
20
15
10
5
0
5
6
7
8
9
0
1
2
3
4
5
6
7
8
9
00
01
02
03
04
05
06
07
08
09
10
11
12
13
14
15
16
17
18
19
20
199
198
199
198
199
199
199
199
198
198
199
199
198
199
199
20
20
20
20
20
20
20
20
20
20
20
20
20
20
20
20
20
20
20
20
20
China Power Generation Index, 1985=1 China Diesel Use Index, 1985=1 China Gasoline Use Index, 1985=1
China Cement Production Index, 1985=1 China Steel Apparent Usse Index, 1985=1 China Sulfuric Acid Production Index, 1985=1
China Rail Freight Volume Index, 1985=1 China GDP Index, 1985=1
Sources: National Bureau of Statistics of China; U.S. Geological Survey; World Steel Association;
authors’ analysis.
Phase 4 (post 2016) displays a combination of plateauing/slight decline for certain
inputs (diesel fuel and sulfuric acid) and renewed demand increases for others
(steel, cement, and electricity). The “breather” period in the mid-2010s, followed by
substantial activity growth in steel and cement (plus the electricity used to produce
both and run many other heavy industrial assets), coincides with a blip in China’s gross
fixed capital formation data (Figure 6).
Gross fixed capital formation represents “the value of producers’ acquisitions of new
and existing non-financial assets less the value of their disposals of non-financial
assets” and includes machinery and equipment, buildings, homes, and other
structures.12 For this report, it offers an approximate yardstick for measuring China’s
ongoing investments in physical infrastructure. While the U.S. and PRC economies
are in many ways quite different, it is striking that, despite remaining a major (and
underappreciated) global industrial and manufacturing player, the U.S. ratio of gross
fixed capital formation to GDP remained remarkably consistent through five decades
of economic “superpowerdom.”13
12 | Rice University’s Baker Institute for Public PolicyChina’s ratio, in contrast, reflects not only the slug of investment that supercharged
its economic rise beginning in the late 1980s, but also, more recently, the fact
that fixed asset investment appears to be the country’s only dependable growth
engine and continues to increase in relative terms, even as the overall economy
has become the world’s second largest in real terms. China’s economic growth
monoculture and increasing pressure from domestic distortions—debt and capital
controls prominent among them—raise pointed questions not only about this
model’s durability moving forward, but also about the deadweight tax it will likely
increasingly impose over the next decade, just as China promulgates a narrative of
inevitable global economic dominance.
Figure 6: Gross Fixed Capital Formation as a Percentage of GDP in the U.S.
and PRC Economies
60%
50%
40%
30%
20%
10%
0
3
5
7
9
1
3
5
7
9
1
3
5
7
9
1
3
5
7
9
01
03
05
07
09
11
13
15
17
19
197
198
199
196
197
198
199
196
196
197
197
198
198
199
199
196
197
198
199
20
20
20
20
20
20
20
20
20
20
China Gross Fixed Capital Formation as % of GDP US Gross Fixed Capital Formation as % of GDP
Sources: Federal Reserve Bank of St. Louis; authors’ analysis.
U.S.-China Competition Enters the Decade of Maximum Danger | 13With nearly five years of retrospective data now available since 2016, the most
probable explanation for the upswing in some basic materials and stagnation in
others is that Beijing is struggling to unleash the transition to a more consumer-
centric economy that multiple senior leaders (including Premier Li Keqiang and
General Secretary Xi himself) have emphasized. Instead, the PRC may be renewing
its emphasis on the “traditional” construction-oriented model that propelled the
country’s economic rise over the past 40 years.
On the consumer front, the Chinese equivalents of Gen-Xers and millennials,
who generally bought into a consumption mindset and the “996” work ethic (and
consumer debt) needed to sustain it, appear to be giving way to a PRC version of
Gen-Z with a distinct subculture of “lying flat” (躺平). As the Brookings Institution’s
David Bandurski recently pointed out, a core ideal of the lying flat movement is “don’t
buy property; don’t buy a car; don’t get married; don’t have children; and don’t
consume.”14 As we discuss later, while the lie-flatters still only constitute a minority
of PRC society, they will become a more
important constituency as the society
ages rapidly and imposes precisely the
Washington now has an types of pension and other burdens
unforgiving, but vital, “gauntlet” to that can only be sustained readily by an
industrious (and numerous) younger set.
run. This rough metaphor—having The leading-edge effects of an anti-
no choice but to push through a consumerist mindset already seem to be
hostile assembly in order to reach manifesting themselves, with both diesel
a critical goal, while being exposed fuel and passenger car sales downshifting
to vituperation and danger— significantly since 2018 (Figures 7, 8).
conveys the urgent, serious Measured as a rolling 12-month average
situation in which America must of monthly demand, China’s diesel fuel
prevail over peaking PRC threats consumption peaked in mid-2011. Since
during this decade. that time, diesel use stabilized for about
five years and then actually declined
beginning in late 2018 (Figure 7). China’s
truck fleet composition is increasingly
bifurcated, with substantial growth since
2015 in the light and heavy truck categories, while the number of medium trucks has
been nearly halved, and “mini” trucks have been driven almost entirely out of the
fleet by modernization and fuel efficiency efforts. Road freight accounts for about 80%
of the cargo movement in China (with 73% of total volume trucked), and much of that
is moved by diesel-engine vehicles.15
14 | Rice University’s Baker Institute for Public PolicyFigure 7: China Diesel Fuel Demand Declining Since 2018, ’000 Bpd
4,500
4,000
3,500
3,000
2,500
2,000
1,500
Industrial Run-Up Great Financial Inflection and Plateau Structural Drop-Off
Crisis & Stimulus
1,000
500
0
4
04
5
5
06
06
7
8
8
9
09
-10
-11
11
2
2
13
13
-14
-15
-15
6
16
-17
-18
18
9
9
20
20
1
-2
-0
r-0
t-0
r-1
t-1
-0
r-0
r-1
r-1
t-1
-0
-0
g-
y-
c-
v-
g-
y-
c-
g-
y-
c-
v-
Jan
Jun
Feb
Sep
Jul
Jul
Jan
Jun
Jul
Jan
Feb
Sep
Au
Oc
Ma
Oc
Ap
Ma
De
Ma
No
Au
Oc
Ma
Ap
De
Ma
De
Au
No
Ma
Diesel Fuel Demand, Monthly (‘000 Bpd) Diesel Fuel Demand, 12-mo Rolling Avg. (‘000 Bpd)
Sources: Joint Organisations Data Initiative; authors’ analysis
U.S.-China Competition Enters the Decade of Maximum Danger | 15Figure 8: Sales of New Passenger Cars in China Peaked in 2017–2018,
Units, 12-Month Rolling Average
2,500,000
2,000,000
1,500,000
1,000,000
500,000
0
07
08
09
10
11
12
13
14
15
16
17
18
19
20
21
20
20
20
20
20
20
20
20
20
20
20
20
20
20
20
Sources: China Association of Automobile Manufacturers; authors’ analysis.
Passenger car sales reflect consumer sentiment, since the purchase of a vehicle is one
of the biggest personal outlays typically made in China other than buying a home.
Measured on a 12-month rolling average basis to adjust for seasonality and episodic
intramonth variation caused by implementation or removal of government incentives,
new car sales in China rose for a decade (2007–early 2017). They then plateaued for
approximately 18 months and subsequently declined, with a near-term nadir during
the spring 2020 coronavirus lockdowns and subsequent relative recovery, but at a
structurally lower level than before (Figure 8).
16 | Rice University’s Baker Institute for Public PolicyWith consumption falling short and innovation still waiting to bear its primary fruits
in the future,16 the remaining leg of China’s economic growth triad reverts to the
longstanding approach of “building to generate growth.” On this path, Beijing faces
the fixed asset investment trap. Investment delivers diminishing returns over time,
because projects are often built to court or create growth, rather than in response to
it, as would be the case in a more strictly market-oriented context. If projects are built
and demand fails to materialize at the necessary level (e.g., thereby creating “ghost
cities”), a growing mountain of debt risks becoming hostage to an increasingly non/
under-performing collateral asset base.17
As the present travails of Evergrande and other PRC property developers illustrate,
resets of such imbalances are massively fraught. Rationalization rarely goes smoothly
because even in a heavily state-influenced economy, the loss of confidence on the
part of investors (and the hundreds of millions of PRC citizens with large proportions
of their wealth tied up in property assets) can trigger panic and spread with
unpredictable cascading effects. Deleveraging events also often reveal hidden risk
pockets and linkages among assets, classes, and institutions that regulators may not
fully realize until the boulder is already rolling fast downhill—as American officials
learned during the 2007–2008 subprime mortgage crisis.
Explosive deleveraging is intensely disruptive even in the most resilient societies with
electoral pressure release valves. It could well prove catastrophic in a “controlocracy”
with a demonstrated fear of market shocks. Xi clamped down hard during the
2015 stock market turbulence, imposing restrictions on trading and deploying the
“national team” to help ensure market stability.18 But a bubble burst in China’s fixed
infrastructure and real estate base—which, at this point, is likely worth seven to eight
times the value of China’s stock market capitalization in the summer of 2015, and is
much more systemically integral to the economy and society—could rapidly expand
beyond even Beijing’s formidable political-economic containment capacity.
U.S.-China Competition Enters the Decade of Maximum Danger | 17Figure 9: Median Wealth per Adult in China and the United States, USD
$90,000
U.S. median adult wealth took 13 years to recover to its
pre-crisis level after the property bubble began deflating
$80,000
$70,000
$60,000
$50,000
$40,000
$30,000
$20,000
$10,000
0
00
01
02
03
04
05
06
07
08
09
10
11
12
13
14
15
16
17
18
19
20
20
20
20
20
20
20
20
20
20
20
20
20
20
20
20
20
20
20
20
20
20
Median Wealth / Adult, China Median Wealth / Adult, U.S.
Sources: Credit Suisse Wealth Report 2021; authors’ analysis.
The financial crisis of 2008 hobbled the American economy for years afterward. Our
analysis of wealth data disclosed by Credit Suisse between 2000 and 2020 shows
the deep impacts of the subprime mortgage crisis: Median wealth per adult in the
United States reached a near-term peak of approximately $67,000 in 2006, plunged
thereafter, and did not regain the 2006 level until 2019 (Figure 9).
A property downturn in China would likely have much harsher impacts. First, the scale
of China’s fixed asset base—dominated by real estate—is much larger than America’s.
China’s property market is likely worth more than $50 trillion, according to Goldman
Sachs—about twice of what America’s was valued at prior to the financial crisis of
2008. Second, housing and related items presently account for about 29% of China’s
GDP, a far larger share than the 19% of U.S. GDP that came from housing services and
residential investment at the sector’s 2005 peak.19 Third, in relative terms, people in
China hold far more of their wealth in non-financial forms (primarily, real estate) than
18 | Rice University’s Baker Institute for Public PolicyAmericans do. In 2006, 36% of the wealth held per adult in the United States fell into
the category of “non-financial.” That share declined to 27% by 2020. China presents
an entirely different situation, with 56% of wealth held in non-financial assets (down
from 62% in 2006). Accordingly, as bad as the 2006–2008 property crash was in the
United States, it would likely be proportionally worse in China.
Figure 10: Non-Financial Wealth as a Percentage of Total Adult Per Capita
Wealth, 2000–2020
70%
60%
50%
40%
30%
20%
10%
0
00
01
02
03
04
05
06
07
08
09
10
11
12
13
14
15
16
17
18
19
20
20
20
20
20
20
20
20
20
20
20
20
20
20
20
20
20
20
20
20
20
20
Non-Financial Wealth as % of Adult Per Capita Wealth, China
Non-Financial Wealth as % of Adult Per Capita Wealth, U.S.
Sources: Credit Suisse Wealth Report 2021; authors’ analysis.
U.S.-China Competition Enters the Decade of Maximum Danger | 19Xi and his advisors almost certainly realize that they would not be able to close this
Pandora’s box if a cascade of defaults ripped it open by triggering broader panic and
contagion. They probably also realize that the “lying flat” movement and its broader
resonance is immune to most of the standard policy intervention options because:
(1) it is a passive act for which participants cannot be punished in the typical ways,
(2) people cannot be compelled to consume even if the economy requires it, and (3)
if a large segment of the population is sapped of its will to compete and strive, the
scale of resources needed to incentivize a mindset change is likely not feasible or
sustainable, especially given current debt burdens at both the consumer level and
economy-wide. Currently preferred Party tools involving surveillance and social credit
scores are far more effective at channeling citizens away from behaviors the Party fears
than channeling them toward the patterns of consumption it desires.
Aware of these constraints, Xi appears to have chosen a third course of action:
deploying China’s coercive economic guidance machinery to continue plugging
Evergrande-type holes in the fixed-asset dike, and playing for time as policymakers
search for ways to deflate the bubble rather than burst it. One example would be
the property taxes proposed in October 2021, which could theoretically offer one
pathway to avoid a crisis, but have thus far aroused staunch opposition given their
linkage to many fraught political, societal, and economic issues. Whether alleviatory
measures can actually set the stage for renewed future growth is another question
entirely, and while relevant to this report’s analysis, is beyond its scope. What does
seem increasingly clear in the interim is that bubble containment and aversion of crisis
comes increasingly at further cost to growth. On a geopolitical level, the shift from a
roughly 6% compounding growth rate a decade ago to something closer to 4% now,
and likely lower in the next two to three years, will be profound.
Economic power is often translated into military hard power on a lagging and slowing
basis, in part because program decisions take years to yield physical, deployable
products; and personnel recruitment and retention often hinges on promised retirement
benefits and other costly back-loaded future entitlements. Large-scale production of
military platforms and employment of sufficiently sophisticated individuals to operate
them is easiest in an economy growing substantially faster than inflation. This is
particularly true for a military still rapidly climbing the global technological ladder, within
a society in which individuals’ willingness to contribute collectively significantly exceeds
their expectations of individual compensation. But these advantages tend to dissipate
inexorably with a great power’s S-curved slowdown, as seen clearly in the struggle to
maintain force numbers already conceded by most advanced industrial economies’
navies and currently convulsing the U.S. Navy.20
Here China faces the diminishing returns that nations developing increasingly
advanced militaries have long confronted. Among the most dramatic historical
dynamics, a combination of rapid GDP growth and shipbuilding prowess puts a
20 | Rice University’s Baker Institute for Public Policycountry in an enviable sweet spot. Between the world wars, for instance, Japan’s rapid
economic growth enabled it to bear ever-increasing ship development costs at a
constant defense burden. World naval powers throughout modern history, including
the Netherlands, United Kingdom, and United States, have likewise enjoyed such
conditions in their peak growth years. But maintaining a leading military in general,
or navy in particular, grows increasingly expensive—particularly as it approaches the
ever-advancing technological frontier and can benefit progressively less from copying,
adopting, or emulating others’ innovations.
The naval example is both particularly amenable to diachronic analysis and reasonably
illustrative: military shipbuilding cost escalation approximates that of other weapons
systems, such as military aircraft. Today’s warships and the conditions under which
they are produced and operated are far more complex than their predecessors.
Together with relatively small production numbers in the best of cases, this increases
expenses. Drawing on considerable historical data, Philip Pugh’s unsurpassed study
finds that while nations tend to spend a constant percentage of their economy on
defense over time, the cost of ships and weapons increases faster than inflation,
typically at 9%. At 2% inflation, this would compound to costs doubling each decade.
Pugh calculates that even 2% per annum naval budget growth—excessively optimistic
for most developed Western nations—would tend to require an annual average of
3.5% reduction in fleet numbers.21 A 2006 RAND study prepared for the U.S. Navy
similarly concludes that the cost growth rate for U.S. Navy vessels over the past
half-century was 7% to 11%, with economy-related factors approximating inflation
and customer-driven demands accounting for the remaining majority. Of these, ship
weight, power density, and sophistication were the largest cost drivers.22 Navies strive
for countervailing innovation and cost savings, particularly by downshifting missions
to smaller vessels. Ultimately, however, navies typically find the cost growth challenge
unrelenting, necessitating major numerical reductions over time.
U.S.-China Competition Enters the Decade of Maximum Danger | 21China has recently enjoyed an enviable combination of factors, but this is
dissipating—even as large waves of its warships begin to face mounting mid-life
overhaul and modernization costs. A warship’s initial procurement price is typically
only one-third of its total lifetime cost. This rule of thumb most dramatically came
home to haunt the sprawling Soviet Navy after its mammoth buildout under Fleet
Admiral Sergey Gorshkov’s three-decade tenure as commander-in-chief of the Soviet
Navy,23 but all navies face some version of this challenge.
Maintaining anything close to China’s heretofore rapid rate of naval force structure
growth amid a mounting maintenance burden would require a major increase in work-
hours. The corresponding increased capital investment would have to be provided
from a PRC economy that is growing at an ever-slowing rate even as labor costs
continue to rise. Using a comprehensive model that considers a PLA Navy surface
combatant’s outfit density, corresponding historical U.S. information, and labor-hours
to analyze a widely-cited specific order of battle growth estimate, a pioneering study
by retired U.S. Navy Captain Chris Carlson concludes: “Given the fiscal challenges
facing China today and in the near future, this very robust force structure projection is
questionable.”24
For all these reasons, the proliferation of new PRC weapons platforms today, especially
the naval shipbuilding program, missile developments, and nuclear force expansion,
may at a basic level actually reflect China’s economic situation five or even 10 years ago.
While undeniably impressive to observers today, the results of those past investments
are not necessarily indicative of future waves of energy, power, or leverage. Systems
bought in “yesterday’s economy” but paid for and delivered under contemporary
conditions, maintained with today’s funds, and augmented or replaced with systems
chosen today and paid for over future years, make a country’s forward-looking economic
trajectory enormously important for allies and partners seeking to judge its future
protective capacity and for adversaries seeking to assess weaknesses. The United States
has faced these problems for many years, but the PRC is about to join that costly club—
much sooner than Beijing’s “inevitable-ist” rhetoric would suggest.
Arithmetically, sooner-than-expected economic slowdowns thus compound on
themselves with profound future consequences for the internal tradeoffs needed to
build, fund, and sustain military forces commensurate with superpower aspirations.
Using financiers’ “Rule of 72,” 8% annual GDP growth means that an economy
doubles in size every nine years, while 4% growth takes that to approximately 18
years, and 2% growth all the way out to 36 years.
These dynamics influence how potential rivals—especially neighboring states trying to
hedge against an uncertain future—will interpret data points from the recent past and
the present as they try to extrapolate forward and make policy decisions. Economic
growth trajectories thus potentially exert enormous influence on other countries’
22 | Rice University’s Baker Institute for Public Policydecisions to “settle today,” fence-sit, or perhaps harden their stance and hold the
line if they think the adversary has reached an inflection point after which its national
power will expand more slowly or even flatline.
China is not entirely without options to try to escape “middle income trap”
stagnation,25 but these options are generally drastic from the perspective of a control-
oriented and increasingly personalized CCP leadership. For instance, a true transition
from fixed asset investment and manufacturing toward an innovative service economy
would require reforms that powerful vested interests steadfastly oppose. For the Party
under Xi, breaking this policy logjam is too politically risky. China’s leaders know what
is required from an economic standpoint, but acting accordingly would undermine
their authority. Faced with this dilemma, they pursue short-term stability to preserve
existing power structures at the cost of further slowdown and mounting pent-up
problems.26
China’s skyrocketing household debt levels
exemplify structural economic constraints that,
for the PRC, are emerging much earlier than Falling fertility rates in China,
they did for the United States when it had and its key markets—which
similar per capita GDP and income levels. Debt include the economies of its
is typically a wet blanket upon consumption
potential adversaries—are thus
growth. A 2017 analysis published by the Bank
for International Settlements found that once the conspiring to close the window
household debt-to-GDP ratio in a sample of 54 on Xi’s gargantuan goals faster
countries exceeded 60%, “[t]he negative long- and more conclusively than many
run effects on consumption tend to intensify.”27 realize. In this sense, perhaps
China’s household debt-to-GDP ratio surpassed
more than any other, Xi is a man
that empirical danger threshold in late 2020
(Figure 11). Rising debt service burdens thus running out of time.
threaten Chinese consumers’ capacity to sustain
the domestic consumption-focused “dual
circulation” economic model that Xi and his
advisers seek to build. China’s growth record
over the past 30 years has been remarkable, but past exceptionalism does not confer
future immunity from fundamental demographic and economic headwinds.
Beijing’s boosters, propagandists,28 and other exponents of PRC exceptionalism have
argued that debt dynamics simply work differently in China than elsewhere because of
limits on capital movement and state control over the banking system. They point to
pessimists’ years of incorrect (or premature) predictions that the debt bubble will pop.
By assuming increasing debt loads, China has indeed avoided short-term crises but
has simultaneously stored up mounting liabilities that, at a minimum, will exacerbate
its slowdown.29
U.S.-China Competition Enters the Decade of Maximum Danger | 23Notably, Vice Premier Liu He, the Xi government’s economic “Mr. Fixit,” is now trying
to “de-risk” the debt pile, but the Evergrande fiasco shows this effort risks triggering
the very crisis it seeks to avoid. Perhaps even a bigger risk than debt for China is an
asset price bubble, since it so intimately tied up with real estate, and could bring
households down with it if prices tumble. Since most of China’s growth over the past
decade has been driven by borrowing using real estate as collateral, this also means
China would need to find a new driver to continue even a semblance of its current
rate of growth—a tall order indeed.
Figure 11: Credit to Households and Corporations in China, 1985–2020
250 70
60
200
Household Debt % of GDP
50
150
40
Trillion RMB
50
100
20
50
10
0 0
4Q 85
4Q 6
4Q 87
4Q 8
4Q 89
4Q 0
4Q 91
4Q 2
4Q 93
4Q 4
4Q 95
4Q 6
4Q 97
4Q 8
4Q 999
4Q 00
4Q 001
4Q 02
4Q 003
4Q 04
4Q 005
4Q 06
4Q 007
4Q 08
4Q 09
4Q 10
4Q 011
4Q 12
4Q 013
4Q 14
4Q 015
4Q 16
4Q 017
4Q 18
4Q 019
20
199
199
198
199
198
199
199
120
120
19
120
120
120
19
19
19
19
19
120
120
120
19
120
120
120
120
12
12
12
12
12
12
12
12
12
1
4Q
Credit to Private Non-Financial Sector from All Sectors Credit to Non-Financial Corporations from All Sectors
Credit to Households and NPISHs from All Sectors Credit to Households and NPISHs from All Sectors, % of GDP
Sources: Bank for International Settlements; authors’ analysis.
24 | Rice University’s Baker Institute for Public PolicyAnother key dynamic to note is that China’s consumer class has accumulated the
lion’s share of its debt during the period of global quantitative easing (“cheap,
easy money”) after the financial crisis of 2008 (Figure 12). With inflation now rising
globally—in no small part due to demographic and other structural changes in China
discussed in this report—a corresponding rise in interest rates in the United States and
other key markets will have several potentially impactful effects on debt-burdened
Chinese consumers—none of them pro-growth. First, the ability to refinance or
otherwise ameliorate the burden of personal debt will be attenuated by the fact that
new finance will cost more. Relatedly, the parts of consumer life built upon credit
cards and consumer loan products underpinned by historically low interest rates will
become increasingly unsustainable if interest rates rise. To be sure, this is a global
challenge, not just a PRC issue, but for an economy trying to reduce a lopsided
reliance on real estate, it may prove difficult indeed.
Figure 12: Chinese Consumers Levered Up During a Period of Historically
Low Interest Rates
120%
Precipitous decade-long runup in U.S.
household debt prior to 2007-2008 crash
100%
Household credit, % of GDP
80%
60%
40%
20%
0
4Q 47
4Q 9
4Q 51
4Q 3
4Q 5
4Q 57
4Q 9
4Q 61
4Q 3
4Q 5
4Q 67
4Q 9
4Q 71
4Q 3
4Q 5
4Q 77
4Q 9
4Q 81
4Q 5
4Q 87
4Q 9
4Q 91
4Q 3
4Q 5
4Q 97
9
4Q 001
4Q 03
4Q 05
4Q 07
4Q 9
4Q 011
4Q 13
4Q 15
4Q 17
19
195
195
196
196
197
197
198
199
199
194
195
196
197
198
199
0
19
120
19
120
120
19
19
19
120
19
19
19
19
19
19
120
120
120
120
12
12
4Q
4Q
US Household Credit, % of GDP China Household Credit, % of GDP
Sources: Bank for International Settlements; Federal Reserve; authors’ analysis.
U.S.-China Competition Enters the Decade of Maximum Danger | 25Unprecedented Demographic Decline: The
Ultimate Source of Slowdown
As debt levels continue to rise at an absolute level that has accelerated almost
continuously for the past decade, population decline is a key headwind bearing
down on Xi’s China.30 Demographics matter because people matter. Accordingly,
demography is one of the most consequential, predictable factors influencing
national power and priorities. Here China’s prospects are bleak: Fertility fell below the
replacement level in the early 1990s; the working-age population peaked in 2015;
the total population will peak at no more than 1.44 billion no later than 2028; new
entrants into the workforce will halve by 2030; and typical-marriage-aged males may
outnumber females by 30 million by 2040. Also, by 2040, China’s population will be
diminishing by 4 million annually—a catastrophic compression. Accordingly, by 2040,
China is projected to have 340 million people over age 65—more senior citizens than
the total current population of the United States. China will soon have more retirees
than any society in history, and the working population supporting them will continue
to contract. No great power has ever risen with such an inverted population pyramid.
China’s one-child policy, which ended in 2015, prematurely and permanently
depressed birth rates below the replacement level. And it has resulted in a growing
proportion of “kinless families” of single children with no aunts, uncles, or cousins—
only ancestors and a child or two of their own at most. With potentially sole
responsibility for as many as four parents and eight grandparents with unprecedented
potential for longevity and correspondingly for proliferation of all-consuming
geriatric illnesses such as Alzheimer’s disease, couples will face unprecedented
eldercare obligations. Shrinking family networks will likely also severely undermine
entrepreneurship and resilience, as the Confucian system underpinned by blood
ties for millennia helped compensate for the lack of rule of law and consequent trust
deficit between biologically-unrelated parties. Accordingly, China’s dramatically aging,
shrinking society represents uncharted waters.
Perhaps most significantly at present, China faces a hollowing out of its working-
age population (ages 15–64). This critical segment peaked in 2010 and has since
declined, with the rate from 2015 to 2020 nearing 0.6% annually—nearly twice the
respective pace in the United States (Figure 13). This, in turn, suggests that China
has already reached a Lewis turning point, a momentous milestone at which surplus
rural/agricultural labor is fully absorbed into the manufacturing sector, causing wages
in both to rise significantly, and a developing economy’s stage of rapid growth to
end.31 While America faces demographic challenges of its own, the disparity between
the respective paces of decline highlights its relative advantage compared to its
chief geopolitical competitor.32 Moreover, the United States can choose to access a
global demographic and talent dividend via immigration in a manner that is simply
impracticable for China.
26 | Rice University’s Baker Institute for Public PolicyYou can also read