U.S. Credit Markets Interconnectedness and the Effects of the COVID-19 Economic Shock - SEC.gov
←
→
Page content transcription
If your browser does not render page correctly, please read the page content below

U.S. SECURITIES AND EXCHANGE COMMISSION
            Division of Economic and Risk Analysis

  U.S. Credit Markets
 Interconnectedness
      and the Effects
     of the COVID-19
    Economic Shock

               S.P. Kothari, Chief Economist
                      and Director of DERA

              Dalia Blass, Director of the Division
                     of Investment Management
               Alan Cohen, Senior Policy Advisor
              Sumit Rajpal, Senior Policy Advisor
OCTOBER
                                                     and
  2020
                                   SEC Research Staff
Table of Contents
Abbreviations.......................................................................................................................................... iii

Executive Summary................................................................................................................................ 1

Chapter 1: Overview of the U.S. Credit Markets.....................................................................13

Chapter 2: Short-Term Funding Market......................................................................................17

Chapter 3: Corporate Bond Market..............................................................................................31

Chapter 4: Institutional Leveraged Loan and CLO Markets............................................ 41

Chapter 5: Municipal Securities Market......................................................................................51

Chapter 6: Residential Mortgage Markets.................................................................................61

Chapter 7: Commercial Mortgage Markets..............................................................................73

Report Summary Letter from Chairman Jay Clayton
and Chief Economist S.P. Kothari..................................................................................................81

Appendix.................................................................................................................................................. 82

The Division of Economic and Risk Analysis (DERA) advances the Commission’s statutory mission to protect
investors, maintain fair, orderly, and efficient markets, and facilitate capital formation through sound economic
analysis and rigorous data analytics. DERA engages across the entire range of the agency’s functions, including
rulemaking, examination, and enforcement. Its multidisciplinary analyses are informed by research insights, and
they rely on the knowledge of institutions and practices when examining regulatory and risk-related matters. DERA
assists the Commission in its efforts to identify, analyze, and respond to economic and market issues, including those
related to new financial products, investment and trading strategies, systemic risk, and fraud. DERA’s data analytics
work develops a variety of financial and market data analysis tools, gathers economic statistics, and promotes data
standards. DERA economists publish regularly in top peer-reviewed journals, including the Journal of Financial
Economics, the Journal of Labor Economics, and the Review of Financial Studies.

SEC Research Staff: Ahmed Abonamah, Gregory Allen, Christopher Arnold, Viktoria Baklanova, Emily Gonzalez,
Igor Kozhanov, Chandler Lutz, Maciej Szefler, Pamela Urban, and Adam Yonce.

OPA Design Team: Chris Gamboa-Onrubia, Zehra Sikandar, and Jennifer White.

Disclaimer: The SEC disclaims responsibility for any private publication or statement of any SEC employee or
Commissioner. This is a report by staff of the U.S. Securities and Exchange Commission (SEC). The Commission
has expressed no view regarding the analysis, findings, or conclusions contained herein. This report contains a non-
exhaustive aggregation of information and is one of several elements of the SEC’s risk and market monitoring efforts.

sec.gov/dera

Abbreviations
ABCP    Asset-backed commercial paper
ABS     Asset-backed security
B/D     Broker-dealer
CD      Certificate of deposit
CLO     Collateralized loan obligation
CMBS    Commercial mortgage-backed security
CP      Commercial paper
CRE     Commercial real estate
CRT     Credit risk transfer
ETF     Exchange-traded fund
FHLB    Federal Home Loan Banks
GFC     Global Financial Crisis
GSE     Government-sponsored enterprise (i.e., Fannie Mae and Freddie Mac)
HF      Hedge funds
HY      High-yield (i.e., not investment grade)
IG      Investment grade
LOC     Line of credit
MBS     Mortgage-backed security
MMF     Money market mutual fund
mREIT   Mortgage REIT
PL      Private-label (primarily in the context of RMBS and CMBS)
QM      Qualified mortgage
RE      Real estate
REIT    Real estate investment trust
RIC     Registered investment company
RMBS    Residential mortgage-backed security
STFM    Short-term funding market
VIX     Chicago Board Options Exchange volatility index
VRDO    Variable-rate demand obligation

                                    U.S. SECURITIES AND EXCHANGE COMMISSION | iii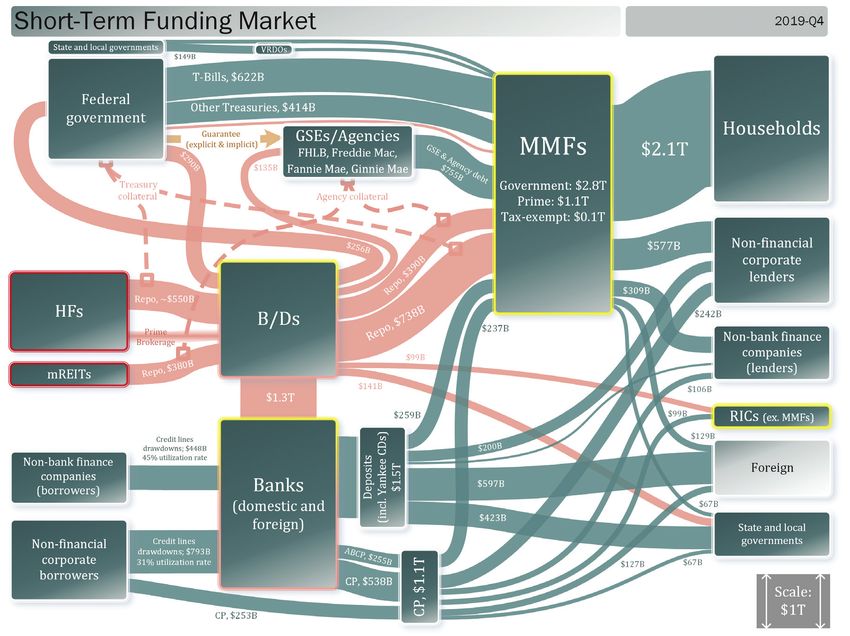
Executive Summary
Purpose
This staff report focuses on the interconnections among the various U.S. credit markets, including
how the actions of issuers, intermediaries, and holders of credit in one market can affect other
markets and the financial system more generally. The analysis seeks to identify the extent to
which these interconnections contributed to or mitigated risk, including systemic risk, during the
recent period of market stress during and following the COVID-19 global economic shock of
March 2020.

The financial system is complex, with layers of interconnections, participants, and risk
transmission nodes among debt, equity, and derivatives markets. The report focuses on
interconnectedness within credit markets. The analysis first takes a market segments approach
to develop an understanding of the relative size and key characteristics of the principal market
segments, and follows with an analysis of the interconnections among the segments within the
larger financial system.

The report aims to assist policy makers and other market participants in their efforts to
understand and improve market function and enhance the strength and resilience of the financial
system. In this regard, the report benefits from, and is intended to complement, ongoing
academic and regulatory work on interconnectedness and the dynamics of market stress.

Introduction
The U.S. financial system is a large mosaic of interconnected and interdependent markets, market
participants, and institutions. The system benefits from varying degrees of prudential and market,
as well as efficiency and fairness-oriented, regulatory oversight, covering both banking and
nonbanking entities. The U.S. financial system is a critical driver of domestic and international
economic growth and financial security. Naturally, its smooth functioning and resilience to
adverse shocks are essential for broader economic stability. The report centers on credit markets,
and builds from a segment-by-segment analysis of the life cycle of credit from origination
to ownership to secondary market trading, including identification of the various financial
intermediaries that facilitate primary and secondary credit flows. At its core, the report then aims
to analyze interconnections among these flows of credit under ordinary and stressed conditions.

In March 2020, the U.S. and the worldwide economies experienced the COVID-19 economic
shock. The analysis of the credit markets centers on COVID-19 as a case study to illustrate
the interconnections and related interdependencies in the U.S. credit markets. The report also
makes general observations regarding the feedback from these markets to the general economy
and vice-versa.

                                         U.S. SECURITIES AND EXCHANGE COMMISSION | 1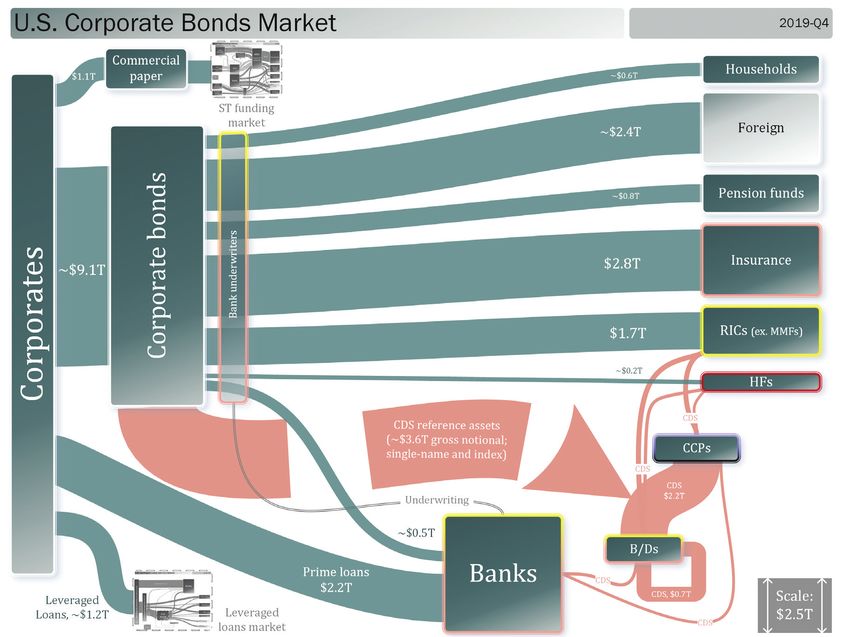
The report identifies approximately $54 trillion of credit issued and outstanding in the U.S. financial
system at the end of 2019 and broadly traces the flow of approximately $52 trillion of that credit
through various intermediaries and prior holders to the ultimate holders of the credit at that time.

This exercise demonstrates that the financial system and the flow of credit are not monolithic, but
are an interconnected collection of markets, each serving different aspects of the general economy.
The report identifies and examines in detail six of these markets covering $44 trillion of outstanding
credit: (i) short-term funding market (STFM), (ii) corporate bond market, (iii) leveraged loans and
CLO market, (iv) municipal securities market, (v) residential mortgage market and other consumer
lending markets, and (vi) commercial mortgage market.

The summary below describes each of the six markets and highlights key COVID-19–induced stresses
observed in the market during the current economic shock, as well as how those stresses affected, could
have affected, and may affect other markets and the general economy. The remainder of the report
discusses each market and those interconnections and potential interconnections, as well as related
effects, in more detail. Of course, the magnitude of the COVID-19 economic shock and the entirely
unexpected nature of the shock have, and might continue to have, an adverse effect on the economy
and financial markets and this report should be viewed in that context.

Information-Oriented, No Policy Recommendations

The report should not be viewed as making or endorsing any particular policy recommendation.
Rather, the report is intended to inform and assist in the framing of policy discussions by providing
an evidentiary understanding (based on staff analysis, extant research, and industry outreach calls)
of the U.S. credit-based financial system and certain of the observed market stresses in the system.

Key COVID-19–Induced Stresses in the Financial System
Using the COVID-19 economic shock in March 2020 as a case study, the report describes certain
of the stresses that developed within the U.S. financial system focusing on structural- and
operations-driven points of stress as the market participants’ preferences shifted dramatically.
The COVID-19–induced stress on the financial markets falls into three categories:

1. Short-term funding stresses caused by suddenly elevated demand for liquidity in the STFM.
   This appears to be a result of a combination of how market participants organized their businesses
   and how these participants reacted in the face of increased risk aversion, funding costs, margin
   requirements, haircuts, and other disruptions (e.g., actions of certain funds).

2. Market structure/liquidity driven stresses caused by elevated demand for intermediation in the
   context of constrained capital and risk limits. The stresses were most apparent in markets that are
   principally dealer-intermediated, including markets for municipal securities, corporate bonds, and
   short-term funding. While many of these markets saw increased notional trading volume, trading
   costs were exceptionally elevated and volumes did not keep up with the surge in demand.

2 | U.S. SECURITIES AND EXCHANGE COMMISSION
3. Long-term credit stresses emanating generally from the immediate and anticipated impacts of
   the COVID-19 economic shock, which may still be unfolding, especially in the corporate bond,
   municipal securities, commercial real estate (CRE) and leveraged loan markets. While the timing
   and extent of any future effects are uncertain, the long-term impact of COVID-19 on the issuers
   and purchasers of long-term credit—i.e., corporations, households, local and federal government,
   pension funds, insurance companies, and other investors—is ultimately expected to manifest
   itself in long-term issuer- and sector-specific credit issues. Initially, these stresses were not as acute
   as the short-term funding and liquidity stresses and may have been ameliorated or otherwise
   addressed by monetary and fiscal policy.

1. Short-Term Funding Stresses
The STFM experienced significant stress in March 2020 almost immediately following the inception
of the COVID-19 economic shock. The approximately $10 trillion STFM comprises several sub-
markets, which finance the short-dated funding needs of investors in the capital markets, nonfinancial
corporations, and financial institutions. These markets include, inter alia, repo financing, commercial
paper (CP), securities lending, prime brokerage, and lines of credit. Most observers have taken a
narrower view of “wholesale” short-term funding markets. We purposely take a comprehensive
view of the participants (financial and real economy) and the markets, as we believe that the actions
of participants in one market are interconnected with outcomes in other markets. The STFM relies
on a complex ecosystem that has significant daily flows through a network of connections among a
wide variety of participants in the financial system and the economy more generally, including banks,
broker-dealers, corporations, hedge funds, mutual funds, insurance companies, and households.

The COVID-19 economic shock rapidly lowered market prices of equity and debt securities, yields
rose across the length of the yield curve, uncertainty in the economy and asset-price volatility spiked,
and credit spreads and bid-ask spreads widened. These effects of COVID-19 disrupted the orderly
functioning of the STFM, leading to higher funding costs, a further increase in bid-ask spreads, and
increased margin requirements and collateral haircuts. The timely and sizable interventions of the
Federal Reserve in mid-March helped to restore confidence and lowered interest rates, resulting in
increased liquidity, tighter spreads, and funding costs in line with historical norms. The discussion
below summarizes these COVID-19–driven effects as witnessed in the various sub-markets of the
overall STFM.

1.1. Relationship between the Repo and the U.S. Treasuries Markets
In March 2020, the COVID-19 economic shock and subsequent increased uncertainty led many
market participants to simultaneously shore up their liquidity positions (i.e., engage in de-risking
trades). Many investors seeking liquidity sold U.S. Treasuries principally because those were
historically the most liquid and least price-affected securities in their portfolios. Foreign central
banks and foreign investors sought dollar funding liquidity during March and April 2020 by
selling U.S. Treasuries. However, despite these historical stability-enhancing characteristics, the
combination of elevated uncertainty and the stress resulting from the rush for liquidity eventually
led to higher bid-ask spreads and to substantial changes in the relationships between “on the run”
and “off the run” Treasuries and between cash and futures markets.

                                           U.S. SECURITIES AND EXCHANGE COMMISSION | 3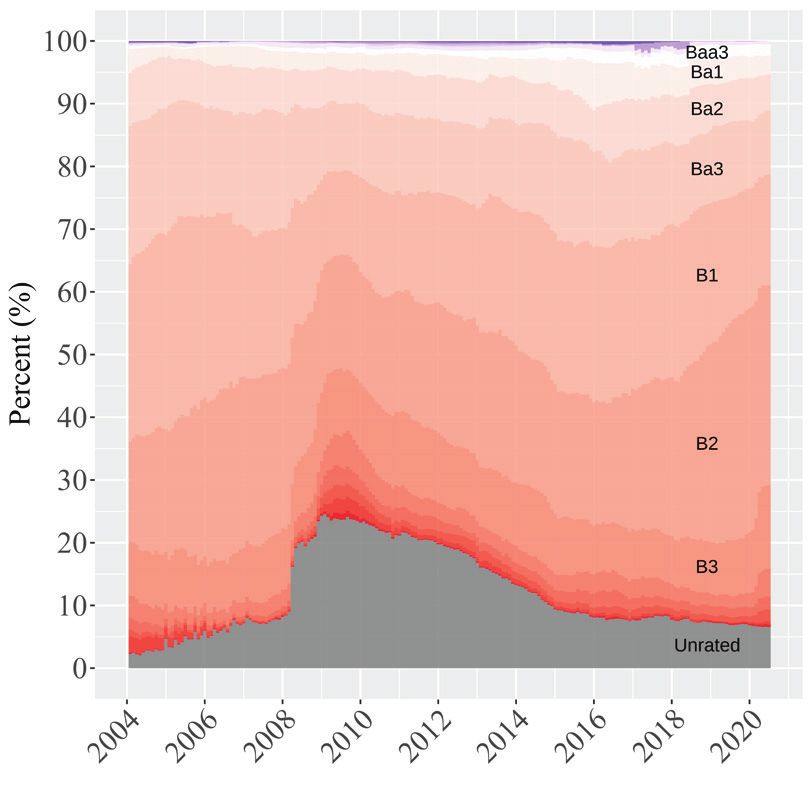
The relationships among, and varying stresses in, the cash, futures, and repo markets in U.S. Treasuries
observed during March 2020 are areas worthy of more granular focus. The repo market is a $4 trillion
market, and approximately 50% of the collateral backing this repo financing is Treasury securities. One
example of this interconnection was seen with hedge funds, in Treasury securities funded by
repo. Hedge funds are one of the principal sellers of U.S. Treasury futures. These funds hedge their
short futures position by establishing a long position in the cash market, creating a “cash-futures
basis trade.” The cash leg of this trade is often highly levered, using the repo market for financing.
In March, as the Treasury market came under stress and as repo rates increased in some segments of
the repo market, the economics of the cash-futures basis trade worsened and various funds found it
necessary to unwind at least a portion of their positions. This unwinding of positions resulted in
more outright sales of Treasuries in the cash market, adding further stress through a feedback loop.
A similar dynamic was observed in the risk parity trades, where hedge funds lever up (through the repo
markets) lower volatility fixed-income positions (e.g., government bonds) to create a risk-equalized
portfolio across asset classes. Another point of stress arose as dealer intermediation became constrained,
principally because of volume increases and price volatility. More specifically, dealers initially expanded
their Treasury inventories in response to the general shift to liquidity, and reached internal risk and
exposure limits, limiting their ability to provide additional liquidity and intermediation.

1.2. Relationship between the Repo Market, the Agency MBS Market,
and the mREIT Market
The agency mortgage-backed security (MBS) market is a large, liquid, and generally low-volatility
source of collateral for the STFM. In March 2020, similar to the U.S. Treasury market, the agency
MBS market experienced increased economic uncertainty, higher yields, and material selling pressure as
market participants sought liquidity. The combination of economic uncertainty and sales pressure led
to both increased volatility and price declines. This combination also disrupted the traditionally stable
pricing relationships between different mortgage pools (i.e., to be announced pools vs. pay-up spec
pools). These various market movements, while not large in absolute terms, disproportionately and
adversely affected levered participants such as mortgage REITs (mREITs). mREITs generally operate
with a combination of leverage (mostly sourced via the repo market) and maturity transformation that
renders them vulnerable to significant shocks to the values of MBS securities as a result of changes in
interest rates or adverse conditions in the real estate market. While the mREIT market itself is not large,
the decline in MBS prices, and the decline of premiums in the pay-up market where the mREITs were
long, increased mREITs’ leverage to unsustainable levels and resulted in margin calls. In turn, various
mREITs had to unwind their positions in agency MBS, which created a feedback loop in the agency
MBS market. These sales and the related feedback are analogous to the hedge funds’ sales of Treasuries
discussed above; the same interconnectedness dynamics were at work via the repo market. Another
point of stress in the MBS market, also similar to that observed in the Treasury market, resulted from
large dealer inventories, which constrained dealer intermediation and exacerbated the stress.

The Federal Reserve’s direct intervention, including purchasing both Treasuries and agency MBS, in
conjunction with regulatory actions such as providing interim capital relief to banks to expand their
ability to engage in market intermediation, helped to stabilize both of these markets. These actions were

4 | U.S. SECURITIES AND EXCHANGE COMMISSION
effective for various reasons, including because they also stabilized the related repo funding markets.
Said another way, in light of these interconnections, the Federal Reserve’s multi-faceted interventions
significantly and simultaneously reduced stress in the cash market, the funding (repo) market, and
the futures markets.

1.3. Commercial Paper and Certificates of Deposit Market
March 2020 also saw strains in the almost $1 trillion CP market, as investors stopped rolling (or
reinvesting proceeds from maturing securities) to preserve cash. In the normal course, secondary
trading volume in CP and CD markets is limited as most investors purchase and hold these short-
dated instruments to maturity. However, in March 2020, as some market participants, including
money market mutual funds (MMFs; 21% of the CP market) and others, may have sought secondary
trading, they experienced a “frozen market.” As a practical matter, both secondary trading and new
issuances halted for a period. Dealers (including issuing dealers) faced one-sided trading flows and were
experiencing their own liquidity pressures and intermediation limits, including those discussed above.

In another illustration of the interconnectedness among the capital markets and the banking system,
issuers who found the CP/CD market frozen turned to other sources of borrowings to meet near-term
needs and, perhaps more so, as a matter of shoring up their cash balances to mitigate risk. These
other sources of credit included bank revolvers and corporate lines of credit. Borrowers drew down
over $275 billion in revolvers in 2020Q1. We believe the Federal Reserve’s prompt action in the CP
market and establishment of USD swap lines with a number of central banks mitigated the potential
adverse effects of these interconnections, including a more general draw on liquidity from banks,
which in turn could put further pressure on intermediation and other banking system activities
important to orderly market functioning.

1.4. Role of Money Market Mutual Funds in the Short-Term Funding Market
MMFs are key participants in the STFM. MMFs’ assets under management (AUM) grew by $705
billion in March and by $462 billion in April to $5.2 trillion, or an increase of 29% from the end
of February. Government funds benefited with net inflows of $1.2 trillion, and they ended April with
$4 trillion in AUM.

Assets in prime institutional and retail MMFs increased by $105 billion in April after declining by
$125 billion in March to $1.1 trillion, roughly $20 billion below their February level. In March 2020,
prime MMFs, especially those offered externally to institutional investors, experienced substantial
outflows. Over the two-week period from March 11 to 24, net redemptions from publicly-offered
prime institutional funds totaled 30 percent of the funds’ assets (about $100 billion). These outflows
likely contributed to stress in the CP/CD markets. These outflows caused weekly liquid assets
(WLAs) in prime institutional MMFs to decline, and some funds’ WLAs (which must be disclosed
publicly each day) approached or fell below the 30 percent minimum threshold required by SEC rules.
Staff outreach to market participants indicate that prime fund outflows accelerated as WLAs fell close
to 30 percent. The Federal Reserve’s announcements of liquidity facilities, including the Money Market
Mutual Fund Liquidity Facility (MMLF), helped to restore market liquidity and improve market
sentiment within days.

                                         U.S. SECURITIES AND EXCHANGE COMMISSION | 5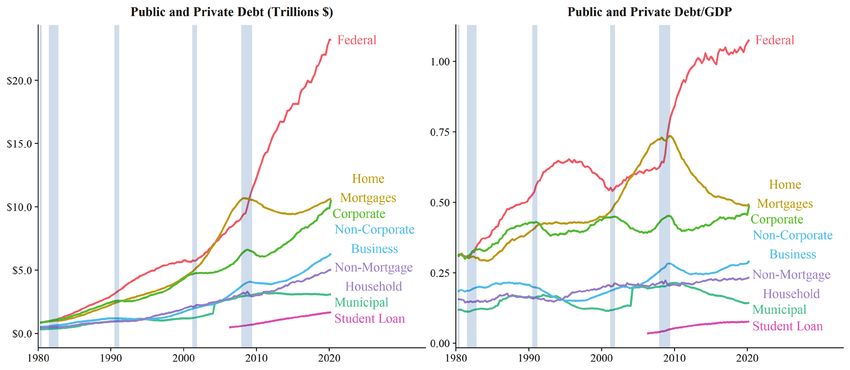
2. Market Structure/Liquidity Related Stresses
The market structure of certain segments of the credit market, particularly those that are still domi-
nated by dealer-based intermediation for liquidity, contributed to the market stress related to the
COVID-19 economic shock. These market segments include municipal credit and corporate credit,
including certain aspects of the STFM such as CP. These observed stresses provide insight into issues
presented by market depth, structure, and liquidity in times of high volumes and a sharp, market-
wide change in preferences such as a general flight to safety.

Widely distributed and diversified ownership of credit, which is generally viewed as stability-
enhancing, characterizes corporate and municipal credit markets, including both securities and bank
loans. In addition, there are enormous numbers of relatively small issues and investors in these mar-
kets. As a result, secondary trading in the cash markets for individual securities and loans is sparse.
And, in turn, the amount of capital devoted to intermediation in these markets is limited, resulting
in relatively low levels of liquidity compared to market size. As a frequently discussed example,
bond and credit mutual funds and exchange-traded funds (ETFs) own assets that would take longer
to sell than the period in which they are required to pay redemption proceeds, so they are subject to
regulatory requirements to manage their liquidity risks. These risks differ based on structure, hold-
ings, redemption practices, and other factors, and would also vary if a fund were faced with general
market stress and/or sudden, relatively large requests for redemptions. The COVID-19 economic
shock induced large, simultaneous redemption shocks that strained liquidity in the market. This
strain was exacerbated by the fact that, in the face of the severe buy-sell order mismatch, dealers
also might have been reluctant to buy and thus meet sellers’ liquidity needs.

2.1. Corporate Bond Market
During the COVID-19 economic shock and related market stress, the corporate bond market
experienced greater risk and, therefore, various market actions including increased trading volumes
and increased trading costs (presumably as a result of elevated credit spreads). Compared to the
preceding two years, the average daily trading volumes for corporate bonds in March and April
increased by approximately 48% and remained elevated through May, before returning to their
typical levels in June and July.

Prior to the Federal Reserve’s decisive action to add liquidity, transaction costs, as measured by
effective bid-ask spreads, spiked to historical levels in March 2020. Recent research by staff of the
Federal Reserve Bank of New York shows that bid-ask spreads spiked by as much as 100 basis
points for high-yield (HY) bonds and 150-200 basis points for investment grade (IG) bonds in
March, before declining rapidly after the announcement of the Federal Reserve’s corporate credit
facilities. By April, bid-ask spreads had stabilized, though they remained mildly elevated relative to
the period before the COVID-19 economic shock.

A number of factors affect bid-ask spreads, including liquidity, economic uncertainty, asymmetric
information, and willingness to absorb inventory and take on the attendant risks. All these factors
were likely at play in March, though it is difficult to determine precisely how much any one factor
contributed to the behavior of spreads. The Federal Reserve Bank of Philadelphia’s recent research

6 | U.S. SECURITIES AND EXCHANGE COMMISSION
focuses on the inventory held by dealers. In particular, the authors estimate that dealer inventories
began declining in early March, contemporaneously with widening bid-ask spreads. In this regard,
it is noteworthy that dealers began accommodating customer demand again (by absorbing more
inventory) only after the Federal Reserve introduced the Primary and Secondary Market Corporate
Credit Facilities later in the month, which also may have been a factor in increasing (or sustaining the
increase in) trading volumes.

Finally, though many observers have been concerned about the ability of bond funds to access
liquidity to meet redemption requests during periods of market stress, these concerns did not
materialize during the market turmoil in March. Commission staff estimate that bond mutual funds
experienced $255 billion of net outflows during March 2020, with another $21 billion in outflows
from bond ETFs. However, the overall trading volume in the corporate bond market dwarfs these
values during the same period and, therefore, it is reasonable to conclude that bond fund redemptions
did not materially disrupt this market or materially add to stresses experienced by the market. We
also believe that the actions of the Federal Reserve and, subsequently, the CARES Act, substantially
ameliorated the potential for fund redemption-driven stresses to contribute to the adverse impact on
the market.

Secondary trading in corporate loans experienced generally analogous trading dynamics. This market
segment, while closely interconnected with the corporate bond segment, is much smaller in size and
structurally distinct, partly as a result of the packaging of certain corporate loans into collateralized
loan obligations (CLOs).

In summary, the corporate bond market saw significantly elevated trading volumes in March and
April of 2020, at the same time that trading costs and credit spreads witnessed peak levels. The
increases in spreads were likely driven by a combination of elevated economic uncertainty and
structural issues in the market—in particular, fragmented liquidity in the cash market and reduced
dealer inventories. The Federal Reserve’s introduction of the corporate credit facilities and other
actions (including purchasing ETFs) were instrumental in stabilizing this market. In addition, the
price and consumer confidence stabilizing actions of the Treasury and Congress through the CARES
Act have added further stability, including in the new issue market.

2.2. Municipal Securities Market
Municipal bond investors generally are retail, long-term holders of municipal securities, either directly
or through funds. There are relatively few non-retail oriented active investors in the market.

Secondary market trading in the municipal securities market averages $13.4 billion, which amounts
to 0.3% of the outstanding par amount of approximately $4 trillion. Further, there are approximately
38,500 securities traded per day or about 3.8% of all outstanding CUSIPs. Low trading frequency
can frustrate the price discovery process and contributes to the municipal securities market’s reliance
on pricing models and matrixes. As a result, municipal securities are vulnerable to less accurate and
idiosyncratic valuations, which can mask the true cost of liquidity for a particular municipal issuer or
individual CUSIP.

                                         U.S. SECURITIES AND EXCHANGE COMMISSION | 7
This market structure can be viewed as potentially amplifying the effects of the market stress around the COVID-19 economic shock, including relatively sudden outflows from municipal bond mutual funds and municipal bond ETFs. When funds become net sellers of municipal securities to raise cash in response to customer redemptions, the secondary trading markets in municipal securities not only experience increased selling pressure, but they lose important buyers. Given the tax and retail-oriented characteristics of this market, few other natural purchasers of municipal securities are in a position to respond quickly to provide additional liquidity to the market. In prior years, municipal bond dealers may have provided greater liquidity through their balance sheets, in response to market imbalances and increases in yields. However, in recent years, municipal bond dealer balance sheets have shrunk as dealers have shifted their intermediation activity from a principal to an agency-like business model. This and other structural changes, as well as general economic uncertainty, not only increased the costs of trading, but also impaired the ability of municipalities to raise funds in March 2020. The short-term new issue market was particularly stressed during this period. Again, this stress was relieved by the direct and indirect effects of the multi-faceted actions of the Federal Reserve as well as the price and consumer confidence stabilizing actions of the Treasury and Congress through the CARES Act. 3. Long-Term Credit Markets: Current and Potential Stresses The COVID-19 economic shock in March 2020 was among the worst the U.S. economy has ever encountered. While the long-term economic impact from COVID-19 is still playing out and the long-term effects are difficult to predict, it is clear that the performance of certain key long-term credit markets in periods of severe stress warrants further monitoring and analysis. It should be recognized that: (i) long-term credit—e.g., residential and commercial mortgages, corporate bonds and leveraged loans, and municipal bonds—accounts for a large fraction of the $54 trillion of credit in the U.S. financial system; (ii) as a general matter, these markets are most affected by aggregate and sector-specific macroeconomic conditions and interest rates; and (iii) however, in times of stress, these markets become significantly more affected by (interconnected with) the performance of other markets, particularly including the short-term credit markets. 3.1. Credit Concentration Of the $54 trillion of credit in the U.S. financial system, $13.2 trillion of credit exposure is concentrated in banks, $9.4 trillion is concentrated in federal agencies and government- sponsored enterprises (GSEs), and $5.7 trillion is concentrated in investment companies.1 Banks’ ownership of credit includes residential and commercial mortgages and corporate loans. In the wake of the COVID-19 economic shock, in Q1 and Q2 of 2020, banks booked near-historically high amounts of current and estimated future loan losses. Because banks were well capitalized and generally were not carrying large inventories of credit-sensitive instruments, they have not experienced significant balance-sheet stresses in coping with the general economic shock. The institutional stability, combined with and enhanced by the actions of the Federal Reserve and other governmental actions, in particular, the CARES Act, has enhanced market stability. However, long-term uncertainties about the economic effects of COVID-19 on the performance 8 | U.S. SECURITIES AND EXCHANGE COMMISSION
of credit remain. In addition to credit exposure, banks’ performance and health more generally
depend on the economic health of their borrowers. Thus, banks and other financial institutions
remain exposed to potential long-term adverse economic effects related to COVID-19.

The federal agencies and GSEs retain most of the credit risk associated with the $9.4 trillion
mortgage credit portfolio they intermediate. Large-scale unemployment in March–April 2020, due
to the COVID-19 economic shock, has led to increased incidence of and risk of mortgage payment
defaults as well as forbearance. Forbearance rates peaked at 8.55% of mortgages outstanding in
June 2020.2 However, housing prices have remained relatively stable, likely due to a combination
of the easing of mortgage credit, forbearance measures, and consumer-oriented fiscal stimulus,
including the Paycheck Protection Program in the CARES Act. As with banks’ credit portfolio, the
long-term impact has yet to unfold, but the uncertainty is a potential risk to be managed by the
federal agencies and GSEs.

Over the past several years, the GSEs issued credit risk transfer securities (CRTs), which were
designed to transfer a portion of mortgage credit risk from the GSEs to CRT investors. More
specifically, CRTs were designed to transfer a slice of mortgage credit risk from taxpayers and the
GSEs to a diversified pool of investors. The CRTs account for the credit risk of a reference pool
of approximately $2 trillion of mortgages. A potential risk with CRTs is that the CRT market
itself is exposed to stress because some investors finance their CRT exposure in a manner that
creates potential stresses. For example, using CRTs as collateral to secure short-term funding can
be viewed as akin to adding leverage to an already implicitly levered instrument, putting in place
a structure that, in the context of an unexpected shock, may require a rapid unwind, potentially
transferring risk and stress to those funding markets.

Banks, followed by GSEs and insurance companies, are concentrated holders of CRE mortgages—
typically the nonstandard mortgage loans (e.g., floating-rate, construction, or owner-occupied)—
and hold nearly $2 trillion of this risk. If the COVID-19 economic shock adversely affects CRE
property prices, CRE mortgages, and therefore banks, will experience increased stress. It can be
expected that, if this market comes under increased pricing pressure, banks will act to further
reduce their exposure.

3.2. Corporate Bonds
In recent years, the composition of corporate bonds has skewed toward BBB-rated bonds—i.e.,
low investment grade rated (IG) bonds. While issuers’ market-valued leverage and interest
coverage ratios in 2019Q4, the period leading up to the COVID-19 economic shock, were at
near historically low levels, extended disruption from COVID-19 could cause financial stress in
the corporate bond market. Such longer term stress could lead investors—for example, insurance
companies and pension funds—to incur significant losses as these bonds are downgraded/repriced.
Insurance companies own $5.6 trillion of credit with a substantial fraction of it through corporate
bonds. As monitoring and analysis continue, it is important to note that many of the investors in
longer term credit operate with leverage.

                                        U.S. SECURITIES AND EXCHANGE COMMISSION | 9
3.3. Institutional Leveraged Loan and CLO Market Institutional leveraged loans account for a relatively small portion of total debt outstanding in U.S. markets. Nonetheless, leveraged loan and collateralized loan obligation (CLO) markets have connections across a wide range of participants in U.S. capital markets. As with corporate bonds more generally, they expose levered lenders like banks and insurance companies to highly levered borrowers (e.g., leveraged buyouts). Thus, despite their small size, these markets should be monitored, including because they provide insight into market function and have the potential to contribute to certain market stresses. CLOs hold about half of the $1.2 trillion in leveraged loans outstanding. Registered investment companies (RICs) and private funds hold the bulk of the remainder, each accounting for approximately 15% of the leveraged loans outstanding. A wide range of institutional investors own CLO securities. Insurance companies, U.S. bank holding companies, and RICs respectively hold 25%, 16%, and 9% of CLOs outstanding, and they collectively account for approximately half of the total. These entities typically hold high-rated CLO tranches. Private funds, pension funds, and CLO sponsors hold the other, lower rated tranches and the equity layer. The risk profile of the leveraged loan and CLO market has increased in recent years, including as a result of a greater concentration of covenant-lite (“cov-lite”) loans (i.e., loans lacking maintenance covenants, which, as a result, provide holders with fewer rights relative to more senior lenders in times of issuer stress) entering into the CLO loan pools. The COVID-19 economic shock to date has not appeared to significantly impair the CLO market. If leveraged issuers suffer financially in the future, their defaults could adversely affect CLO prices and potentially create defaults in the lower rated tranches of the CLO securities. Risk to the financial system more generally appears to be mitigated as a result of various factors, including because the CLO investor pool is diversified across bank holding companies, insurance companies, pension funds, RICs, and hedge funds, and as a general matter CLO structures have features designed to match funding and absorb risk. These factors should continue to be monitored. An Overview of Six Key Segments of U.S. Credit Markets The summary below presents the size and other general characteristics of six key segments of the U.S. credit markets. These characteristics provide a grounding for our analysis of the functioning and, importantly, the interconnections among these market segments under various conditions, including times of stress. To varying degrees, the functioning of the markets discussed below in response to the COVID-19 economic shock illustrates starkly the highly interconnected nature of the U.S. credit markets. While the size of these markets varies, each experienced market stress in March 2020. Those stresses were inextricably linked through (i) direct connections among market segments, with the STFM being a focal point of interdependency; (ii) the actions of financial intermediaries and other market participants; (iii) broader economic conditions; and (iv) monetary and fiscal policy. 10 | U.S. SECURITIES AND EXCHANGE COMMISSION
1. Short-Term Funding Market
The STFM finances the government, financial markets, and nonfinancial corporations
collectively with a size of approximately $10 trillion. The STFM comprises several sub-markets,
including repo financing, CP, securities lending, prime brokerage, and lines of credit.
Repo market: The approximately $4 trillion repo market provides secured, short-term, marked-
to-market funding against various forms of securities collateral. The market is critical to the
liquidity and, accordingly, to the operations of various market participants including market
makers in virtually all sectors of the capital markets.
Commercial paper and certificates of deposit market: In March 2020, CP and CDs outstanding
were approximately $2.5 trillion. CP is a broad term encompassing various forms of short-term
debt (various maturities of less than 1 year) issued by financial firms, nonfinancial firms, and
municipalities to meet short-term financing and liquidity needs. CP can be asset-backed (for
example, backed by a pledge of receivables) or, more simply, backed by the general credit of the
issuing entity.
Securities lending market: Securities lending supports the orderly operation of capital markets,
principally by enabling the establishment of short positions and thereby facilitating price
discovery and hedging. The Financial Stability Oversight Council (FSOC) Annual Report
estimates the global securities lending activity to be $2.4 trillion with around 55% or $1.3
trillion of it attributed to the United States (as of September 2019).
Prime brokerage: Financial institutions’ prime brokerage activity includes the provision of
secured financing to hedge funds and other active participants in the capital markets. A market
participant’s portfolio generally backs this lending. Staff understand that the size of this activity is
approximately $800 billion–$1 trillion.
Lines of credit: As of year-end 2019, revolving credit-line commitments extended to businesses
by large banks reached $3.6 trillion.
2. Corporate Bond Market
The U.S. corporate bond market is approximately $9.1 trillion in size. Corporate bond
ownership is widely dispersed among insurance companies, RICs, pension funds, and family
offices. Banks own only a small amount of corporate bonds in their capacity as dealers. Although
the corporate bond market is large, the number of bond issues is in the tens of thousands, with
the median size of an issue approximately $500 million. The diversified and in some ways
fragmented nature of the bond market spreads risk, but it also reduces liquidity in the cash
market for bonds.
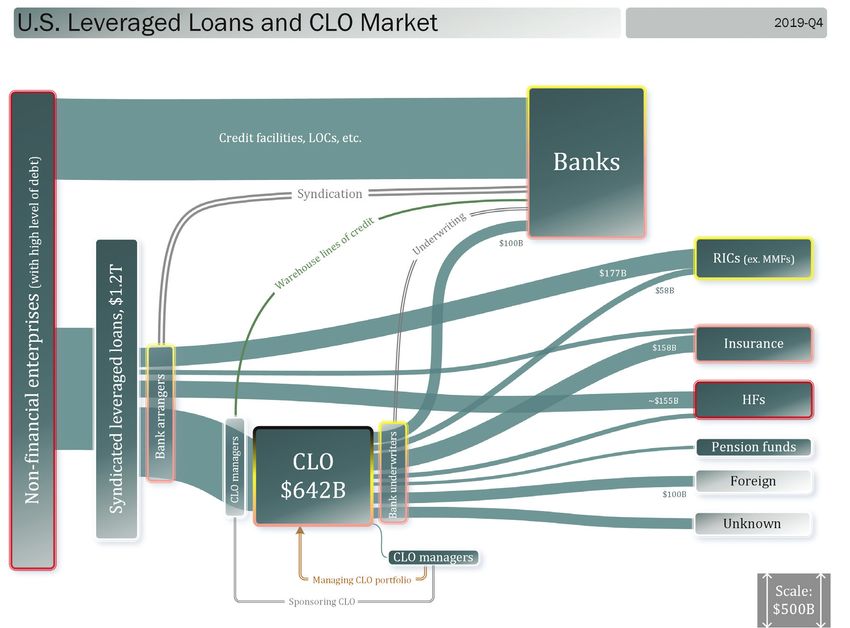
U.S. SECURITIES AND EXCHANGE COMMISSION | 113. Leveraged Loan and CLO Market
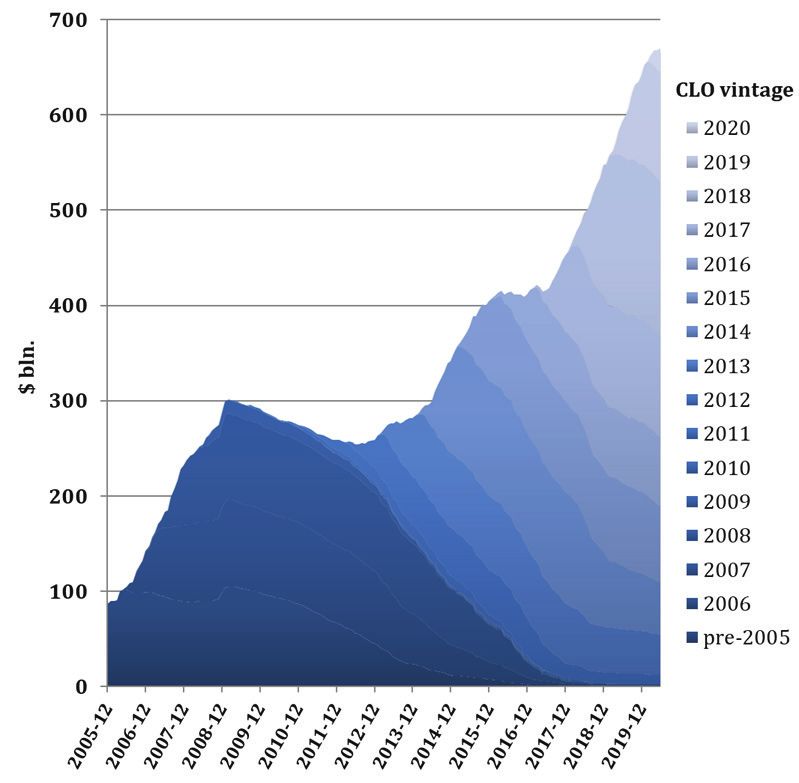
Following rapid growth since 2012, $1.2 trillion of syndicated leveraged loans are currently
outstanding in the United States, and CLOs account for about half of those loans. As the market
for leveraged loans has expanded, the risk profile of CLO pools has increased. The average credit
rating of loans in the CLO pools has steadily declined, and currently more than 85% of the loans
are cov-lite.
4. Municipal Securities Market
The U.S. municipal securities market has nearly $4 trillion outstanding (par value) spread across
approximately one million securities issued by more than 50,000 municipal entities (representing
an even larger number of ultimate borrowers). States, counties, cities, school districts, and other
municipal entities issue municipal securities to finance infrastructure and other projects—e.g.,
hospitals, transportation systems, school buildings, and utilities.
5. Residential Mortgage Market
Residential mortgage debt outstanding was $10.6 trillion in 2019Q4. Of this, federal agencies
and GSEs intermediate about $7 trillion, but they retain the credit risk. The GSEs sell the
mortgages as agency MBS to a diversified pool of investors, including the federal, state, and
local governments; insurance companies; pension funds; RICs; mREITs; and banks. Banks own
approximately $3.2 trillion of the mortgage loans retaining the credit risk. Residential mREITs
invest about $335 billion in agency MBS financed with a highly levered, short-maturity capital
structure.
The federal agencies and GSEs sell CRT securities on a reference mortgage pool of
approximately $2 trillion. These securities transfer credit risk of the reference pool of mortgages
to the investor in the CRT security, including hedge funds, real estate investment trusts (REITs),
RICs, insurance companies and banks.
6. Commercial Real Estate Market
CRE mortgage debt grew steadily over the last decade to $4.6 trillion by 2019Q4. CRE
mortgage risk is concentrated among a few entities: Banks are the largest holders of CRE
mortgages followed by GSEs and insurance companies. The CRE loans on the banks’ balance
sheets are often nonstandard mortgages compared to the loans banks supply to commercial MBS
(CMBS) for securitization.
1 Investment companies include open-end funds, closed-end funds, unit investment trusts, and ETFs.
2 Mortgage Bankers Association, “Share of Mortgage Loans in Forbearance Increases to 8.55%,”
June 16, 2020.
12 | U.S. SECURITIES AND EXCHANGE COMMISSIONChapter 1: Overview Of The
U.S. Credit Markets
Key Highlights
1. At the end of 2019, the aggregate U.S. credit outstanding was $54 trillion with a
diverse set of issuers and holders of credit and numerous intermediaries who facilitate
about $23 trillion of credit transmission.
2. Banks are a concentrated holder of credit risk of $13.2 trillion. Federal agencies and
GSEs intermediate about $9.4 trillion of residential mortgages. They retain most of
the credit risk on mortgages, but sell (intermediate) the underlying mortgages as
agency MBS.
3. Pension funds and insurance companies are large holders of corporate bonds.
4. MMFs intermediate about $3.6 trillion of short-maturity credit and RICs and REITs
intermediate $6.4 trillion of mostly long maturity credit.
The stress induced by the COVID-19 economic shock has affected and may continue to affect
the U.S. credit markets. Understanding the breadth and complexity of the U.S. credit markets
is fundamental to any assessment of the events of March 2020. While identifying all relevant
connections within the U.S. credit markets is challenging, some connections, such as ownership
and funding relationships, are transparent and direct. Other connections, such as leverage and
synthetic exposure, are obscure and indirect. We begin by identifying the amount of credit
issued and outstanding in the U.S. capital markets. We then identify credit risk transmission and
distribution from the origins to the ultimate holders of this risk—investors. Many intermediaries
facilitate the flow of credit from the issuers to the holders of credit.
The size and composition of the credit market is not static. All types of debt grew in the last
decade in nominal terms, and most of them grew relative to GDP, with the notable exceptions of
mortgage and municipal debt, which have declined relative to GDP (See Figure 1.1). Moreover,
the composition of aggregate debt has changed: the relative size of mortgage and municipal debt
has declined, while federal and corporate debt has increased.
As of the end of 2019, we are able to track the origin and transmission of $54 trillion of U.S.
credit issued and outstanding (See Appendix). We are able to identify the ultimate holders of
about $52 trillion of the credit, held both directly and indirectly through chains of intermediaries.
Figure 1.2 maps the distribution of all credit in the U.S. credit markets. An immediate takeaway
from this figure is that the U.S. credit markets are a complicated mosaic of connections large and
small among a diverse set of institutions. Each of them connects with the rest through numerous
holders of credit and credit intermediaries.
U.S. SECURITIES AND EXCHANGE COMMISSION | 13The high-level view of the credit market in this report excludes several critical features of
the market in the interest of simplicity. For example, the report does not focus on credit risk
exposure between financial institutions that might arise from derivative securities, committed
lines of credit, credit guarantees, and central clearing parties and advisory and credit evaluation
entities (consumer credit reporting agencies, investment advisors, and pricing services/index
providers). Instead, subsequent chapters address the following in the context of individual
markets to give a deeper insight into the U.S. credit market: (i) STFM, which includes repo
financing, CP/CDs, securities lending, prime brokerage, and lines of credit; (ii) the corporate
bond market; (iii) the market for leveraged loans and CLOs; (iv) the municipal securities market;
(v) the residential mortgage market and other consumer lending markets; and (vi) the CRE
mortgage market.
Figure 1.1. Public and Private Debt by Category, 1980-2020
The left panel plots the amount of debt for several borrower types in trillions of dollars, and the right panel scales the amounts
by GDP. Sources: Financial Accounts of the United States and the Federal Reserve Board.
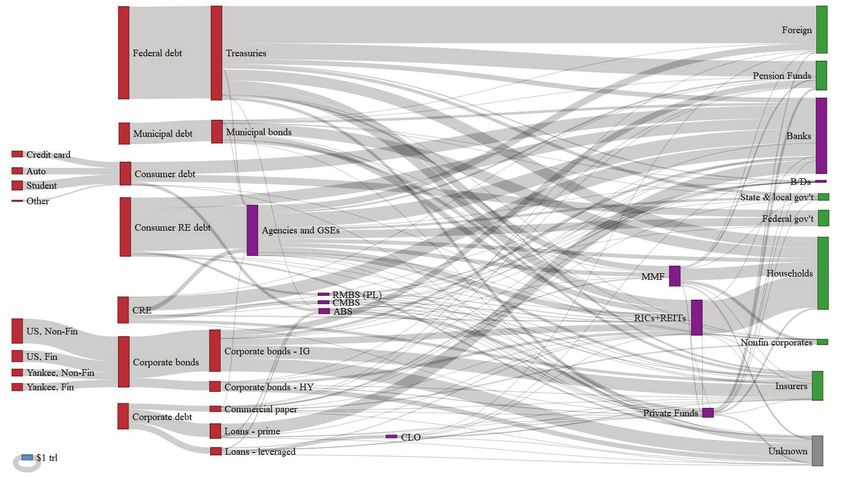
14 | U.S. SECURITIES AND EXCHANGE COMMISSIONFigure 1.2. Overview of U.S. Credit Outstanding as of December 31, 2019
This figure shows ultimate borrowers (sources of credit risk, in red) on the left, and ultimate lenders (owners of credit risk, in green)
on the right, with financial intermediaries in purple. Credit risk flows from left to right, and money flows from right to left. The width
of the shaded bands represents the stock of credit outstanding as of December 31, 2019 ($1 trillion shown at bottom left for scale).
Data sources and other technical details are in the Appendix.
Several observations emerge from the high-level view of the credit risk map. First, the federal
government ($16.6 trillion), households ($10.6 trillion of mortgages and $4.2 trillion of other
consumer debt), and corporations ($13.7 trillion in bonds and loans) are the primary issuers of
credit. Naturally, the amount of credit differs across issuers, and the issuers themselves are not
homogenous. While the risk of credit issued and outstanding from the U.S. federal government
is low, the risk of credit issued and outstanding from corporations can vary from those issuing
lower risk IG bonds and CP to those issuing higher risk HY bonds.
Second, the largest ultimate holders of credit are households with about $14 trillion of credit
risk exposure ($4.4 trillion directly and $9.2 trillion indirectly through nonbank financial
intermediaries, e.g., mutual funds). Another important channel of households’ exposure to credit
risk is banks that own $13.2 trillion of credit risk. Households, in turn, have deposits in banks
and are thus exposed to the (minimal) credit risk of such deposits. Other major holders of credit
in the capital market are foreign buyers who hold more than $10.9 trillion, insurance companies
that hold about $5.6 trillion, and pension funds with more than $4.8 trillion. The latter two
categories also create indirect credit risk exposure for households and businesses that hold
insurance or pension claims or for pension plan sponsors that may guarantee pension payments.
The map also does not display household and corporate claims on banks through their deposits.
U.S. SECURITIES AND EXCHANGE COMMISSION | 15Third, nonbank intermediaries are salient in the U.S. credit markets. They account for
approximately $23 trillion of credit that flows from issuers to holders of credit.3 Federal agencies
and GSEs intermediate $9.4 trillion, MMFs intermediate $3.6 trillion, and RICs and REITs
another $6.4 trillion. Smaller intermediaries include private funds with $1.6 trillion, and private-
label CMBS, residential MBS, CLO, and other asset-backed securities (ABS) with $2.6 trillion.
Fourth, the credit claims, while many and diversified across different types of entities, exhibit
pockets of concentration that pose potential risk in times of economic stress and/or market
disruption. For example, federal agencies and GSEs own a significant share of residential real
estate claims (72%) and, correspondingly, the mortgage market depends on agencies and GSEs.
Banks hold the majority of corporate loans (62%) and half of CRE loans; hence, corporations
depend on banks and banks’ credit policies for the extension of credit. Similarly, CLOs own the
majority of leveraged corporate loans (54%). Insurance companies own close to one third of all
corporate bonds.
Finally, households invest directly in Treasury and municipal securities but have exposure to
other types of debt primarily through intermediaries like MMFs and RICs.
3 The numbers in this section represent only the credit portion of the total assets of the intermediaries;
some credit exposure goes through several intermediaries before reaching the ultimate lender.
16 | U.S. SECURITIES AND EXCHANGE COMMISSIONChapter 2: Short-Term Funding Market
Key Highlights
1. The U.S. STFM provides approximately $10 trillion of funding to the federal
government, state and local governments, banks, and other financial and
nonfinancial firms.
2. The uncertainty and market volatility from the COVID-19 economic shock caused
a sharp, unexpected increase in demand for cash and short-dated, near-cash
investments and disrupted the STFM. This disruption resulted in significantly
constrained liquidity, higher funding costs, increased bid-ask spreads, and increased
margin requirements and collateral haircuts.
3. Initially, stresses were observed in the U.S. Treasury and MBS markets, which caused
a feedback loop as levered investors were forced to unwind.
4. Securities dealers are central to market participants and serve as liquidity providers
facilitating provisioning of credit, risk transfer, and price discovery for other market
participants. During March 2020, facing internal limits, their ability to continue
intermediation was constrained.
5. The Federal Reserve’s timely and sizable interventions restored confidence in the
market participants and the STFM.
Market Overview
A well-functioning STFM is critical to the performance of the real economy as well as to the
broader credit and equity markets.4 Using data from the Financial Accounts of the United States
in conjunction with industry sources, we size the STFM at approximately $10 trillion. These
markets consist of several key, interconnected segments. The market uncertainty induced by
the COVID-19 economic shock caused a sharp, unexpected increase in demand for cash and
short-dated, near-cash investments and related liquidity. This demand shift disrupted the STFM,
resulting in higher funding costs, increased bid-ask spreads, and increased margin requirements
and collateral haircuts in some market segments. The Federal Reserve’s timely and sizable
interventions in mid-March restored confidence in the stability and operation of these markets,
resulting in increased liquidity, tighter spreads and funding costs in line with historical norms.
The COVID-19 economic shock in March 2020 dramatically slowed macroeconomic activity,
lowered valuations of financial assets such as equities, bonds, and real estate, and generally
reduced the risk appetite of market participants. These factors adversely affected the STFM,
directly and through the multiple connections between the STFM and both the real economy and
U.S. SECURITIES AND EXCHANGE COMMISSION | 17other financial markets. The most immediate and direct effect on the STFM was due to a steep increase in demand for safety and liquidity. That resulted in demand for the most cash-equivalent assets and selling pressure in virtually all other markets, including in the more long-dated and relatively less secure segments of the STFM. The sharp shift in market participants’ preferences, labeled by some as a “dash for cash,” and the resulting market conditions led to additional stresses. For example, heightened volatility and lower valuations of various financial assets triggered margin calls in certain segments of the short term credit markets (e.g., repo markets) and also prompted dealers to demand larger collateral haircuts. These risk-mitigating actions by providers of collateral-based credit had the effect of removing liquidity from the STFM. The CP market also became constrained, resulting in higher costs of borrowing as issuers’ risk profiles worsened in absolute terms while investor demand shifted to relatively safer short-term investments.5 The spike in demand for safe, liquid assets, which was initially driven by a shift in investor demand, was exacerbated by de-levering transactions as some market participants were forced to unwind leveraged exposures. Collectively, these factors led to increased spreads, mismatch in the supply of and demand for short-term funding, and a magnified liquidity-induced stress, and had the potential to further magnify, the effects of the COVID-19 economic shock on the STFM. Below, we discuss the size, structure, and role of the STFM, including its functioning in both ordinary market conditions as well as during the COVID-19 economic shock of March 2020. We believe an understanding of the STFM is critical because of its importance, which has grown substantially over time, in both absolute terms and relative to bank lending, in providing short- term liquidity to the real economy and financial markets. In short, the STFM is essential to both—and a key link between—the real economy and the financial markets more generally. The discussion below presents a granular view of key segments and the primary market participants of the STFM and provides detailed observations from March 2020. Short-Term Funding Market Structure The STFM encompasses many large (e.g., MMFs) and small participants, many sub- markets (e.g., repo financing, CP, securities lending, and prime brokerage), and it has many interconnections among these participants as well as participants outside of the STFM, e.g., corporations, hedge funds, mREITs, and households. The complexity of the STFM is evident from Figure 2.1, which portrays various participants, their relative size, and their interconnections. Instead of describing the entire STFM as one single market, or separate market segments, the discussion below summarizes the structure of each sub-market along with its interconnections to other segments, as well as how those segments performed and the interconnections operated in response to the COVID-19 economic shock. 18 | U.S. SECURITIES AND EXCHANGE COMMISSION
You can also read