GLOBAL EV OUTLOOK Understanding the Electric Vehicle Landscape to 2020 - April 2013
←
→
Page content transcription
If your browser does not render page correctly, please read the page content below

GLOBAL
EV
OUTLOOK
Understanding the Electric Vehicle Landscape to 2020
April 2013
GLOBAL
EV
OUTLOOK
Understanding the Electric Vehicle Landscape to 2020
April 2013

PG_04        MAP — Electric Vehicles Initiative (EVI)

PG_06        KEY TAKEAWAYS

PG_07        INTRODUCTION & SCOPE

PG_09        DATA & ANALYSIS

PG_23        TIMELINE — A Brief History of Electric Vehicles

PG_25        CHALLENGES & OPPORTUNITIES

PG_34        OPPORTUNITY MATRIX — Pathways to 2020

PG_36        CONCLUSION

PG_38        GLOSSARY

PG_39        END NOTES

PG_40        ACKNOWLEDGMENTS
Global EV Outlook MAP 4
ELECTRIC VEHICLES The Electric Vehicles Initiative (EVI) is a multi-government policy forum dedicated to accelerating the introduction and
INITIATIVE (EVI)
adoption of electric vehicles worldwide. EVI is one of several initiatives launched in 2010 under the Clean Energy Ministerial,
a high-level dialogue among energy ministers from the world’s major economies. EVI currently includes 15 member
governments from Africa, Asia, Europe, and North America, as well as participation from the International Energy Agency (IEA).
EVI MEMBER COUNTRIES HELD OVER 90% OF WORLD ELECTRIC VEHICLE (EV) STOCK IN 2012
DENMARK
EV Stock: 1,388
EVSE Stock: 3,978
NETHERLANDS
EV Stock: 6,750 SWEDEN
EVSE Stock: 3,674 EV Stock: 1,285
EVSE Stock: 1,215
0.7% FINLAND
EV Stock: 271
0.1%
EVSE: 2
(does not include electric block
UNITED KINGDOM
heaters also used for charging)
0.7%
EV Stock: 8,183 CHINA
EVSE Stock: 2,866 4.4% 3.6% 3% GERMANY EV Stock: 11,573
EV Stock: 5,555 EVSE Stock: 8,107
11%
FRANCE EVSE Stock: 2,821
38%
0.9%
UNITED STATES EV Stock: 20,000 0.4%
EV Stock: 71,174 EVSE Stock: 2,100 1% ITALY
EVSE Stock: 15,192 EV Stock: 1,643 6.2%
SPAIN EVSE Stock: 1,350
EV Stock: 787 24%
EVSE Stock: 705
0.8%
PORTUGAL JAPAN
EV Stock: 1,862 EV Stock: 44,727
EVSE Stock: 1,350 EVSE Stock: 5,009
INDIA
%: Approximate Percentage of Global Electric Vehicle Stock, EV Stock: 1,428
2012 (Total EV Stock = 180,000+) EVSE Stock: 999
EV Stock: Cumulative Registration/Stock of Electric Vehicles, 2012
EVSE Stock: Non-Residential “Slow” and “Fast” Electric Vehicle Supply
Equipment (EVSE) Stock, 2012
Electric vehicles are defined in this report as passenger
car plug-in hybrid electric vehicles (PHEV), battery electric SOUTH AFRICA
vehicles (BEV), and fuel cell electric vehicles (FCEV).
EV Stock: N/A
See the Glossary on page 41 for more information.
EVSE: N/A
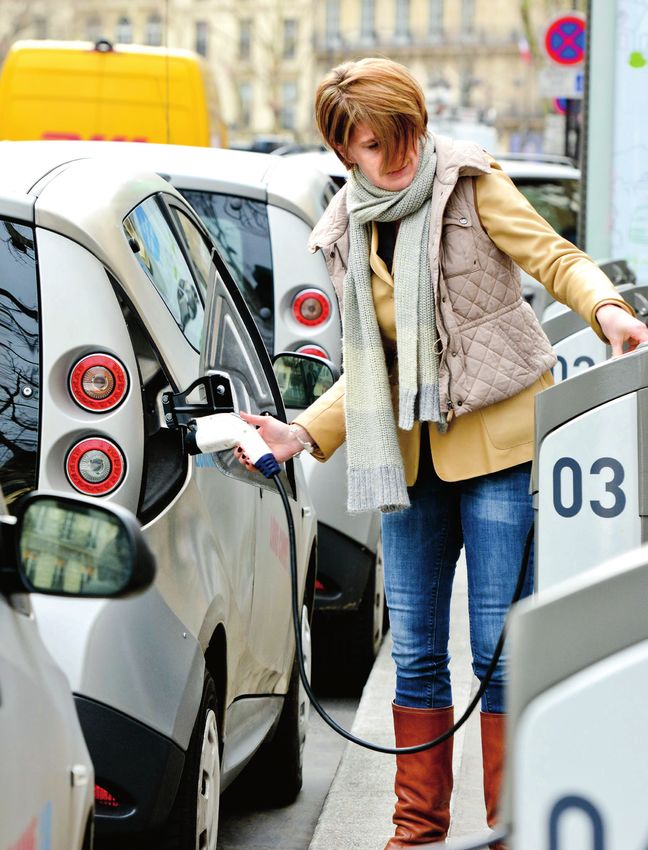
Autolib Charging Station — Paris, France, December 2012
Global EV Outlook
 Key Takeaways
 The Global EV Outlook represents the collective effort of two years of primary data gathering and analysis from the

 Electric Vehicles Initiative’s 15 member governments. Below are key takeaways and insights from this work.

          Global EV Stock                            Global EV Sales More                            RD&D is Paying Off
               (through end of 2012)
                                                    Than Doubled Between                        Research, development, and demonstration
    represents 0.02% of total passenger cars
                                                        2011 and 2012                               (RD&D) efforts are paying off with

       180,000+                                           Approximate Annual Sales
                                                                                                    EVI governments providing over
                                                                                                USD 8.7 billion in investment since 2008,
                                                                                                   helping to address one of the major
                                                                            113,000
                                                                                                 hurdles to EV adoption by significantly
                                                           45,000                                        reducing battery costs.
                 EVI Goal
                                                            2011              2012
represents 2% of total passenger cars (projected)

    20 million                                                                                               USD
                                                                                                           1,000
                                                                                                                             USD
                                                                                                                            485
             on the road                                    EVI Members                                      kWh            kWh

         by 2020
                                                                                                            2008            2012
                                                                    include

                                                         8 of the 10                                     EVSE Stock in
                                                      largest vehicle markets in the world
                                                                                                         EVI Countries
                                                                    63%                               (approximate, through end of 2012)

                                                                                                        represents non-residential
                                                       of the world’s total vehicle demand                   charging points

                                                                    83%
                                                             of EV sales between
                                                           now and 2020 (projected)

                                                    Commitment is Strong
         100,000 EVs                                                                                 46,000 slow          1,900 fast
                                                       Through their actions and words,
         Global EV stock, end of 2012
                                                        governments and industry have
                                                    reaffirmed their commitment to vehicle
                                                    electrification. Even more public-private          Moving Forward
                                                     coordination will be required to meet
      % of 2012 Global                                    the 20 million by 2020 goal.
                                                                                                 EVI is facilitating the coordination and

  EV Stock in EVI Countries                                                                         communication among key public

        90%+
                                                                                                   and private stakeholders worldwide
                                                                                                   to address the challenges of vehicle
                                                                                                    electrification across the areas of
                                                                                                 technology, finance, market, and policy.
Global EV Outlook INTRODUCTION & SCOPE      7

INTRODUCTION
& SCOPE
  As countries seek to address future energy requirements in a rapidly growing and changing world, achieving sustainable

  transportation has emerged as a vital mission. Electric vehicles (EVs), in particular, represent one of the most promising

  pathways to increased energy security and reduced emissions of greenhouse gases and other pollutants.

  By helping to diversify the fuel mix, EVs reduce dependence on petroleum and tap into a                                                      IN THIS REPORT
  source of electricity that is often domestic and relatively inexpensive. Just as important,
                                                                                                                                               // Presentation of primary
  EVs have the potential to unlock innovation and create new advanced industries that                                                          data collected from EVI
  spur job growth and enhance economic prosperity.                                                                                             member governments on EV
                                                                                                                                               and related infrastructure
  In the long-term, EVs are important to countries seeking to decarbonise the transport
                                                                                                                                               deployment goals; policies,
  sector. Figure 1 illustrates the key role of transport CO2 reductions in the International
                                                                                                                                               programmes, and incentives;
  Energy Agency’s (IEA) “2DS” scenario (2°C Scenario), which describes a future energy
                                                                                                                                               deployment progress; and
  system that would limit average global temperature increases to 2°C by 2050. In this                                                         investment in research,
  scenario, the transport sector’s potential share of overall CO2 reductions would be 21%                                                      development, and demonstration
  by 2050. In order to meet this share, three-fourths of all vehicle sales by 2050 would                                                       (RD&D); all of which informs an
  need to be plug-in electric of some type.                                                                                                    analysis of global market trends
                                                                                                                                               and progress in electric vehicle
                                                                                                                                               deployment and the implications
  Figure 1. Role of Transport in CO2 Reduction (% = 2050 estimate)
                                                                                                                                               for technology and policy.*
  Source: IEA, ETP 2012. NOTE: Sector percentages represent cumulative contributions to emissions reductions relative to the
  4DS (4°C Scenario, which is based on proposed policies).
                                                                                                                                               // Identification of challenges
                                                                                                                                               to EV deployment as well as
                  60                                                                                                                           opportunities to address those
                                                                                                                                6DS
                                                                                                                                               challenges.
                  50
                                                                                                                                               // An outline of areas of
Gigatonnes CO 2

                  40                                                                                                            4DS            opportunity for governments
                                                                                                                 TRANSPORT                     and industry to accelerate
                  30
                                                                                                                                               adoption of electric vehicles:
                  21                                                                                                                           Opportunity Matrix:
                                                                                                                                2DS
                                                                                                                                               Pathways to 2020.
                  10

                   0

                   2009                  2020                     2030                        2040                           2050

  SECTORS
                  Power Generation 42%                                    Buildings 12%
                  Transport 21%                                           Other Transformation 7%
                  Industry 18%                                            Additional Emissions 6DS (6°C Baseline Scenario)

  *See also, IEA’s “Tracking Clean Energy Progress,” April 2013.
Global EV Outlook INTRODUCTION & SCOPE   8

THE THIRD AGE OF ELECTRIC VEHICLES                             THE ROLE OF THE ELECTRIC VEHICLES INITIATIVE
Electrified road transport has been around in some form        EVI seeks to facilitate the global deployment of at least
for more than 100 years, although by the 1930s its use by      20 million passenger car EVs, including plug-in hybrid
light-duty passenger cars was displaced almost entirely        and fuel cell electric vehicles, by 2020. This goal is based
by the petroleum-fueled internal combustion engine (ICE).      in part on countries’ deployment targets and on other
EVs appeared on the market both in the early 1900s             factors such as IEA scenarios. EVI will enable progress
and briefly in the 1990s. In the last 10 years the world       toward this goal by:
has again considered vehicle electrification in light of
                                                               1. Encouraging the development of national deployment
increasing and volatile oil prices, deteriorating urban
                                                                 goals, as well as best practices and policies to achieve
air quality, and climate change. This renewed interest
                                                                 those goals;
represents a “third age” of electric vehicles, starting with
the mass-market introduction of EVs in 2010.1                  2. Leading a network of cities to share experiences and

(See Timeline on page 23.)                                       lessons learned from early EV deployment in urban
                                                                 areas and regions;
! A number of governments are now establishing
  clear deployment goals for EVs, which include                3. Sharing information on public investment in RD&D

  PHEVs, BEVs, and FCEVs.                                        programmes to ensure that the most crucial global gaps
                                                                 in vehicle technology development are being addressed;
! Automobile manufacturers and consumers are also
  embracing this technological shift, driven in part           4. Engaging private-sector stakeholders to better align

  by stricter fuel efficiency regulations and a desire           expectations, discuss the respective roles of industry

  to mitigate risks from oil price fluctuations.                 and government, and focus on the benefits of continued
                                                                 investment in EV technology innovation and EV
! Robust rates of growth in sales in a number of major
                                                                 procurement for fleets.
  markets, new car models from a variety of manufacturers,
  and significant cost reductions in components such as        REPORT SCOPE
  batteries are helping to grow the nascent EV market.         Although the Global EV Outlook does not provide data or
                                                               specific projections for every country that supports vehicle
! Innovative products and business models such as
                                                               electrification, the progress and pathways of EVI countries
  wireless charging, car sharing, and workplace charging
                                                               represent a reliable bellwether for global EV readiness. EVI
  are contributing to a new ecosystem that is further
                                                               members include 8 of the 10 largest vehicle markets in the
  enabling electrification. Governments are assisting
                                                               world, account for about 63% of the world’s total vehicle
  in this market transformation by providing sizable
                                                               demand, and are projected to account for 83% of EV sales
  investments in research and development as well as
                                                               between now and 2020.2 Moreover, many of EVI’s members
  consumer incentives.
                                                               rank high on researchers’ lists of top EV countries: 9 of the
While early sales of EVs have been strong, with over           top 10 most developed markets in McKinsey & Company’s
180,000 passenger car EVs sold worldwide through 2012,         “electric vehicle index” are EVI members, as are 8 of the 10
they represent only 0.02% of the total passenger car stock     top EV markets according to Pike Research.3
at present. In order to meet ambitious deployment targets
                                                               EVI is therefore assembling a unique and highly valuable
established by a number of countries, greater adoption
                                                               global perspective of the burgeoning EV market while
rates will need to be achieved in the years up to 2020.
                                                               identifying important market trends and best practices.
Global EV Outlook DATA & ANALYSIS          9

DATA & ANALYSIS
EVI is uniquely positioned to track the initial years of mass-market deployment of EVs. The data presented in this section

describe a rapidly growing market, but with a long way to go before achieving high rates of market penetration.

EV DEPLOYMENT TARGETS & PROGRESS

EVI deployment targets show that several countries have                                  CORRELATION BETWEEN SALES AND PRODUCT VARIETY
set EV sales and/or stock targets to signal their long-term                              As Figure 5 shows, there has been an increase over the
commitment to vehicle electrification. Target-setting is by                              past two years of both cumulative EV sales and the number
no means a prerequisite for, or determinant of, successful                               of vehicle models being offered. In 2010 there were 16 EV
EV deployment, but it is useful for understanding the                                    models on sale and around 20 in 2012. However, only 2-3
level of ambition and support from national policymakers.                                EV models on the market in 2010 were widely available to
                                                                                         consumers, which increased in 2012 to about 6-8 EV models
Figures 2 and 3 show cumulative sales and stock targets for
                                                                                         widely available to the general public in several countries.
the 9 out of the 15 EVI members that have official targets.*
                                                                                         The numbers show a strong correlation between sales
Together these targets add up to 5.9 million in sales and
                                                                                         and product variety. This suggests that more EV models
20 million of stock by 2020. There are other countries outside
                                                                                         coming to market will result in more choices for the consumer,
of the EVI member group that have official targets, but the
                                                                                         and could further increase sales.
bulk of EV sales until 2020 will likely take place in EVI
member countries, which can therefore be considered a
useful benchmark for EV deployment in the near term.

National sales and stock targets are not meant to be
forecasts, but they can be used for creating national
roadmaps that outline steps to be taken to achieve the
goals while also tracking progress.**

EV DEPLOYMENT PROGRESS
At the end of 2012, total worldwide electric vehicle stock
numbered over 180,000, with over 90% of this stock in
the EVI membership group [ Figure 4 ]. The largest
non-EVI stock can be found in Norway, which numbers
about 10,000.4

These figures only include passenger cars, and not buses,
motorcycles or heavy-duty vehicles. In fact, China alone
has almost 180 million fully electric two-wheelers, which far
surpasses any other EV fleet.5 Unless noted otherwise, EVs
will refer to passenger cars throughout this report.

                                                                                            Car2Go — Amsterdam, the Netherlands, November 2011

*Some countries include vehicle types other than PHEVs and BEVs in their targets. Where possible, vehicle types were counted separately.
**For more information, see IEA’s “Technology Roadmap: Electric and Plug-in Hybrid Electric Vehicles,” June 2011, and IEA’s “Tracking Clean Energy Progress,” April 2013.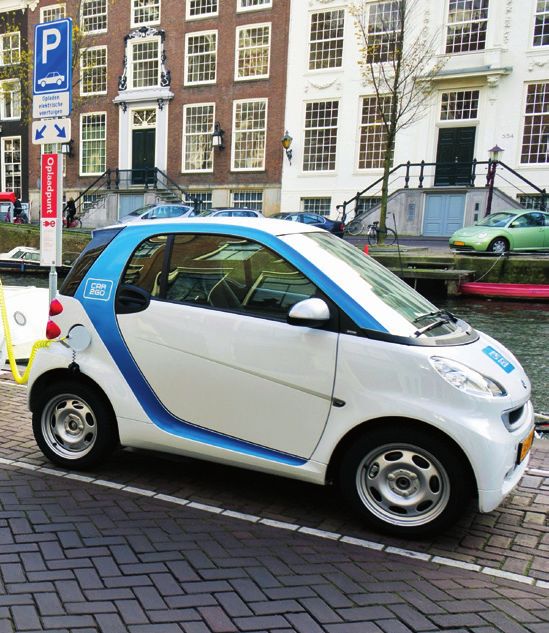
Global EV Outlook DATA & ANALYSIS 10
EV DEPLOYMENT TARGETS & PROGRESS [ continued ]
Figure 2. EV Sales Targets [ select EVI members ] Figure 3. EV Stock Targets [ select EVI members ]
Source: EVI. Note: A 20% compound annual growth rate is assumed for countries without Source: EVI. Note: A 20% compound annual growth rate is assumed for countries without
a specific sales target (i.e., only a stock target) or with targets that end before 2020. a specific stock target (i.e., only a sales target) or with targets that end before 2020.
20,000,000
6,000,000
India
Netherlands
India
16,000,000 Portugal
5,000,000 Netherlands Germany
Portugal
Germany France
France
4,000,000 12,000,000 Spain
Spain
Units
Japan
Units
3,000,000 Japan
8,000,000
2,000,000 United United
States States
4,000,000
1,000,000
China China
2010 2012 2014 2016 2018 2020 2010 2012 2014 2016 2018 2020
Figure 4. EV Stock in EVI Countries, 2012 Figure 5. Global EV Model Diversity and Sales
Source: EVI. Source: MarkLines Database.
80
70
200,000 25
60 NUMBER OF MODEL S
160,000 AVAIL ABLE
20
Number of Models Available
Units, Thousand
50
120,000
Cumulative Sales
40 15
80,000
30
CUMUL ATIVE SALES 10
40,000
20
5
10 20,000
N/A 0
2010 2011 2012
na
a
k
d
ce
y
a
y
n
ds
al
n
es
en
om
ic
di
al
an
ar
an
ai
pa
ug
at
an
an
ed
hi
fr
It
gd
In
Sp
m
m
Ja
nl
St
rt
C
Fr
A
rl
Sw
en
er
in
Fi
Po
he
d
h
K
G
D
te
ut
et
d
ni
So
N
te
U
ni
U
CRUNCHING THE NUMBERS: SALES & STOCK TARGETS FOR 2020
The aggregated goal for all countries with known deployment targets is 7.2 million in EV sales and 24 million
in EV stock. Of this goal, EVI countries account for cumulative sales of 5.9 million and stock of 20 million.Global EV Outlook DATA & ANALYSIS 11
EV DEPLOYMENT TARGETS & PROGRESS [ continued ]
2012 NOTABLE DISTINCT GEOGRAPHIC DISTRIBUTION
EV EVENTS 2012 EVI data show a distinct geographic distribution for PHEV and BEV sales
// World EV sales exceeded
[ Figures 6a, 6b ].
100,000 units for the first time. ! The largest share of the worldwide PHEV market is in the United States, due to the
// Motor Trend magazine named predominance of the Chevrolet Volt. Japan claims the second spot, largely due to
the Tesla Model S its 2013 Car increasing sales of the Toyota plug-in Prius.
of the Year, marking the first time
a non-petrol powered vehicle
! In the worldwide BEV market, Japan holds the largest share due to sales of the
won the accolade. Nissan LEAF, followed by the United States, then China, due in part to the use of
electric taxis in Shenzhen and Hangzhou. France is in the fourth spot, in part due
to Bolloré’s Bluecar, a part of the Paris EV car sharing scheme Autolib.
! The total number of FCEVs is very low due to a limited number of models on the
market, limited infrastructure, and higher costs compared to a BEV or PHEV.
MARKET SHARE
As shown in Figure 7, EV sales in Q1-Q3 2012 only reached 1% of total vehicle sales in
// Toyota launched its plug-in
Norway and Japan, but as EVs begin to penetrate the automotive market, the shares
version of the Prius, which
quickly outsold three other
are likely to increase. In fact, in the last quarter of 2012 EV sales reached over 1% of total
BEV models in 2012. vehicle sales in both the Netherlands and the United States, furthering gains in market
share. At the end of 2012, the highest sales shares of EVs were in Norway, Japan, Ireland,
// The Chevrolet Volt ranked the
highest in Consumer Reports’
the Netherlands, and the United States. The main PHEV and BEV markets can be found in
owner satisfaction survey for the 15 EVI countries with worldwide sales shares being about 96% and 89%, respectively.
the second consecutive year.
Analysis of EVI data show that to reach the EVI goal of 5.9 million in annual sales of
// EVI and partner organisations EVs in 2020, the 2011 EV market (approximately 45,000) would need to grow by 72%
published the EV City Casebook, compounded each year until 2020. Meeting this target of course becomes more of a
a guide to EV deployment efforts
challenge each year, but as 2012 came to a close, total sales numbered approximately
worldwide, featuring 16 cities in
113,000, a more than doubling of the market. While this one-year growth is ahead of
9 countries across 3 continents.
bit.ly/EVCityCasebook
the curve, it will be much more difficult to double sales in later years, e.g. between 2019
to 2020, than in the first year. Nevertheless, the result is that the market has doubled
and the growth rate is ahead of both IEA’s 2DS scenario and cumulative EVI sales/stock
targets to date.
EV CITY
CASEBOOK
A LOOK AT THE GLOBAL ELECTRIC VEHICLE MOVEMENT
2012Global EV Outlook DATA & ANALYSIS 12
EV DEPLOYMENT TARGETS & PROGRESS [ continued ]
Figure 6a. 2012 World PHEV Sales, by Country
Source: EVI, MarkLines Database.
Netherlands 8% United States 38,585
Canada 2% Japan 6,528
United States Japan China 2%
Netherlands 4,331
70% 12% Canada 1,288
Other 6%
China 1,201
Other 3,266
Figure 6b. 2012 World BEV Sales, by Country
Source: EVI, MarkLines Database.
Japan 15,937
United States 14,592
Norway 7%
United States China France China 8,733
Germany 2%
Japan 26% 16% 11% France 6,067
28% UK 2% Norway 3,883
Other 9% Germany 1,294
United Kingdom 1,167
Other 5,009
Figure 7. EV Uptake Comparison, Q1 -Q3 2012
[ EV sales as % of total passenger vehicle sales ]
Source: Bloomberg New Energy Finance. Note: Q3 sales data for China and some European countries was incomplete at time of publication.
Q3 2012
Norway
Q2 2012
Japan Q1 2012
Ireland
Netherlands
France
United States
Denmark
Switzerland
Austria
United Kingdom
Spain
Germany
Italy
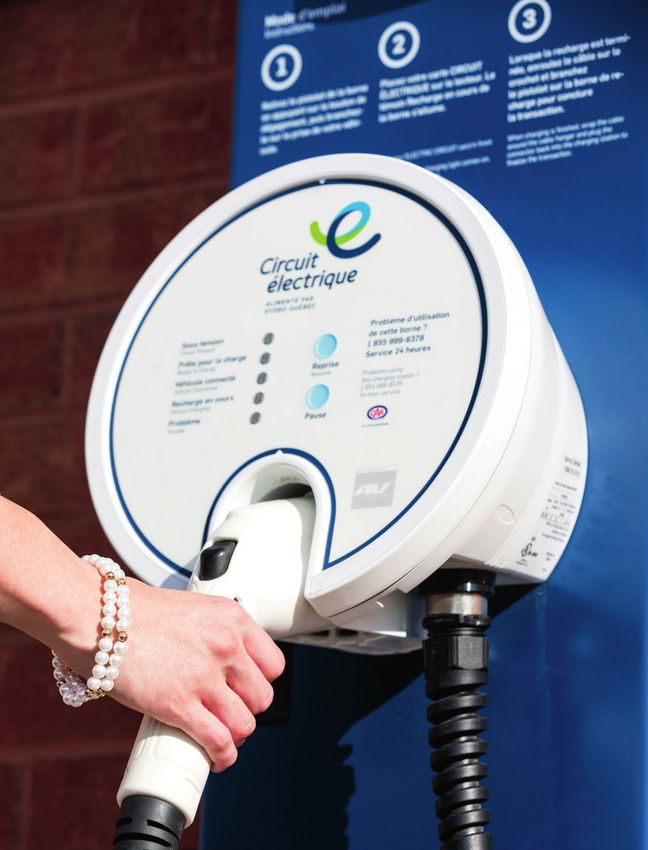
0% 1% 2% 3% 4%Circuit Electrique Public Charging Station — Laval, Canada, September 2012
Global EV Outlook DATA & ANALYSIS 14
EVSE DEPLOYMENT TARGETS & PROGRESS
Electric Vehicle Supply Equipment (EVSE) deployment
is taking place across different locations — residential, SLOW CHARGING
office, fleet, retail, street, other — and by different modes The most common type of charging provides
of charging, which can be generally grouped into the alternating current to the vehicle’s battery from
an external charger. Charging times can range
categories of “slow” and “fast”. Definitions of slow and from 4 to 12 hours for a full charge.
fast charging often vary by country and/or region.
FAST CHARGING
The definitions used in this report attempt to capture
Also known as “DC quick charging”, fast
the range of charging times typically experienced. charging stations provide a direct current
of electricity to the vehicle’s battery from an
By 2020, EVI countries have cumulative targets for external charger. Charging times can range
from 0.5 to 2 hours for a full charge.
approximately 2.4 million slow chargers and 6,000 fast
chargers. Japan accounts for the bulk of this goal, with an
official government target to deploy 2 million slow chargers
and 5,000 fast charging points by 2020. As part of its
Figure 8. Non-Residential EVSE Stock in EVI Countries
nationwide demonstration project, the United States is
by Slow/Fast, 2012
targeting the deployment of over 22,000 chargers, including Source: EVI.
350 fast chargers, by 2014. The Netherlands aims to have
16
20,000 slow chargers and 100 fast chargers by 2015. 1.6
14
Slow Chargers 1.4
EVSE DEPLOYMENT BY SLOW AND FAST CHARGING POINTS 12 Fast Chargers
Slow Chargers, Thousand
Fast Chargers, Thousand
1.2
Figure 8 details the existing deployment of non-residential 10
1.0
EVSE by slow and fast charging points, by country. 8
0.8
Figure 9 shows an increase over the past five years of both 6 0.6
slow and fast chargers. EVSE deployment rose in 2010 as
4 0.4
governments prepared the necessary infrastructure for
2 0.2
impending EV market introduction in 2011. The EVI total
N/A
0 0
at the end of 2012 for slow chargers was 47,462 and for fast
na
k
d
ce
y
a
y
n
Po d s
A l
a
Sw n
es
K de n
te dom
ga
ic
di
al
an
ar
an
ai
pa
at
an
an
hi
fr
It
So r tu
In
Sp
m
chargers 1,907. However, this slow charger number does not
m
e
Ja
nl
St
U i ng
C
Fr
rl
en
er
Fi
he
d
h
G
D
ut
et
d
ni
N
te
include 1.5 million electric block heaters in Finland, which
ni
U
can also be used to charge electric vehicles. Additionally,
the slow charger number is certainly an underestimate Figure 9. Non-Residential EVSE Growth in EVI Countries
Source: EVI.
as almost no country keeps track of home installations
of slow chargers. Unless otherwise noted, EVSE refers to 50
non-residential charging points.* SLOW CHARGERS
Slow/Fast Chargers, Thousand
40
30
20
10
FA ST CHARGERS
0
2008 2010 2012
*Where possible, EVSE locations were counted separately.Global EV Outlook DATA & ANALYSIS 15
EVSE DEPLOYMENT TARGETS & PROGRESS [ continued ]
EVSE TO EV RATIOS DIFFERENT APPROACHES FOR DIFFERENT COUNTRIES
The absolute number of chargers is not the sole driver of EV The three EVI members selected in Figure 11 show how
development, of course. More EVSE is not necessarily better. countries are approaching non-residential EVSE
Figure 10 shows EVI ratios of EVSE/EV, which appear to be deployment in very different ways. Japan has already
declining or stabilizing as vehicle deployment increases and installed 1,381 fast chargers, which is the highest amount
countries take stock of their existing EVSE capabilities. for any country worldwide, but has placed less emphasis
on slow chargers to date. In the United States, conversely,
Figure 10. Non-Residential EVSE/EV Ratio the emphasis appears to be on slow charging, perhaps due
[ EVI Countries ] to more reliance on home charging and the prevalence of
Source: EVI.
PHEVs. Finally, in the Netherlands a mix of slow and fast
0.35
chargers is being employed, resulting in the most EVSE
0.025
0.30
FA ST CHARGER / per capita worldwide. There is no one correct path, rather
E V R ATIO
0.020
different EVSE networks based on local needs.
Slow Charger/EV Ratio
Fast Charger/EV Ratio
0.25
0.20 0.015
Figure 11. Different EVSE Deployment Profiles, 2012
0.15
0.010
[ Select EVI Members ]
0.10 Source: EVI.
SLOW CHARGER / 0.005
0.05 E V R ATIO
0.035 0.6
0.00 0.000
2008 2010 2012 0.030 0.5
Slow Charger/EV Ratio
Fast Charger/EV Ratio
0.025
0.4
Early estimates of adequate non-residential EVSE/EV 0.020
0.3
ratios range from 0.08 to 0.3.6 Figure 10 shows that EVI 0.015
0.2
countries currently fall within this range for slow charging. 0.010
While fast charging ratios are much lower, it is also possible 0.005 0.1
that fast chargers are not as widely needed as previously 0.000 0.0
Japan Netherlands United States
thought. Preliminary research suggests, in fact, that a
well-designed system would only need a few fast charging Fast Charger/EV Ratio Slow Charger/EV Ratio
stations instead of blanketing a wide area. In one U.S. study,
100-200 fast charging locations were deemed sufficient
for good initial geographic coverage for the majority of
drivers in California.7 Further research is needed to better
understand the EVSE mix best suited to a given region’s
EV fleet. China, for example, is aiming for a 1.25 EVSE/EV
ratio by 2020 for slow chargers, but is waiting for market
developments to determine the best fast charger ratio.
EV Charging Point — Newcastle-upon-Tyne, United Kingdom, Autumn 2011Global EV Outlook DATA & ANALYSIS 16
RESEARCH, DEVELOPMENT & DEMONSTRATION (RD&D)
Research, development & demonstration (RD&D) are spending including consumer incentives.* These subsidies
key activities for countries seeking to help technological will come to an end eventually, but in the near term they are
innovation reach full market potential. The IEA tracks public aiding EV market development and figure prominently in
sector energy RD&D among its 28 member countries. As seen many vehicle electrification efforts worldwide. Infrastructure
in Figure 12, there is a decreasing relative share of global spending is relatively sparse, though this is perhaps due to
RD&D spending since tracking began in 1981, though an the lower costs of deploying charging points than funding
increasing trend in absolute figures since the mid-1990s. long-term research programmes, but also because the private
sector and cities are focusing their financial support on
There is a spike in funding in 2009 due to the U.S. economic
infrastructure, suggesting that national governments have
stimulus, though several other countries, such as Germany
a larger role to play in RD&D and fiscal incentives.
and Japan, also increased RD&D in order to boost their
automotive sectors and overall economies. The ripple effects
of the 2009 stimulus spending will likely continue for some Figure 13. RD&D Spending by EVI Countries
Source: EVI. Note: Missing countries indicate incomplete data.
time, especially given the substantial investments made in
battery research and development. 2,500
China
Denmark
2,000 Finland
Figure 12. Public Sector Energy RD&D in IEA Countries France
Source: IEA databases, 2012 cycle. Germany
1,500
India
USD Million
Energy Efficiency Hydrogen & Fuel Cells
Japan
25 Fossil Fuels Other 15% 1,000
Renewable Energy Sources Nuclear Netherlands
Share of Energy RD&D of Total RD&D
USD Billion (2011 Prices and PPP)
13%
Portugal
20
11% 500
Incl. American Recovery & Spain
Reinvestment Act of 2009 9%
15 (stimulus spending) Sweden
7% 0 United States
10 5% 2008 2009 2010 2011 2012
3%
5
1%
0 0% Figure 14. EV Spending by EVI Countries, 2008-2102
1974 1979 1983 1987 1991 1995 1999 2003 2007 2011
[ by Category ]
Source: EVI.
Figure 13 details RD&D spending on electric vehicles by
9.0
EVI countries from 2008-2012. Like overall energy RD&D,
8.0
U.S. spending on EV RD&D spiked in 2009, with Japan RD&D
7.0
and Germany showing similar jumps in 2010 and 2011.
6.0
Encouragingly, public investment in RD&D after 2009
USD Billion
remained at a high level, which signals continuing 5.0
commitment to EV innovation. 4.0
3.0
INFRASTRUCTURE, FISCAL AND RD&D SPENDING FISCAL
2.0
Figure 14 shows cumulative spending by EVI countries
in terms of fiscal expenditures (e.g. consumer incentives), 1.0
INFRASTRUCTURE
infrastructure (e.g. EVSE), and RD&D. There is an emphasis 0
on RD&D, which is logical considering the early market phase
of EVs. Similarly, significant funding is directed to fiscal
*Fiscal spending is defined here as financial support for vehicle purchases, such as consumer tax credits or rebates, but not including spending on infrastructure installations.Global EV Outlook DATA & ANALYSIS 17
RESEARCH, DEVELOPMENT & DEMONSTRATION (RD&D) [ continued ]
which compares with Deutsche Bank’s more conservative
Figure 15. Breakdown of RD&D Spending by EVI Countries
7.5%, albeit at a lower starting cost point. As a point of
2008-2012 [ by Category ]
Source: EVI. comparison, laptop batteries developed at a rate of 15%
in the 1997-2012 period.
2,500
The reduction in battery cost shows how targeted RD&D
2,000 can aid the technological development and market
deployment of electric vehicles. Battery costs are not just
1,500
coming down in absolute terms, but in the near term battery
USD Million
costs may be less than half the cost of an EV. Beyond batteries
1,000
there is an opportunity to diversify the RD&D scope for
bringing down overall EV costs. Other opportunity areas
500
include vehicle lightweighting, which can extend a vehicle’s
electric range. Advancements in electric-drive systems can
0
D D D re &D ns
:
ns
: also offer cost reductions through fully integrating motors
R& ) R& R& tu
rR tio se tio se
r y road e ll le r uc R & D e ra ic U r a te U
tt e -
el
C h ic s t th t
s l s t
on v a
and electronics, using wide bandgap semiconductors, and
B a le o n Fu Ve f ra O on b
m Pu m Pri
i In
ob De De non-rare earth motors.
(m
Figure 15 displays EVI support for RD&D by category,
cumulatively for the 2008-2012 period. These numbers are Figure 16. Estimated Costs of EV Batteries through 2020
Source: IEA, U.S. DOE, Deutsche Bank.
likely an underestimate as they only count national-level
support, and for some countries data were not available 1,200
BATTERY COST
for all categories. There is relatively more focus on (10% VARIANCE)
1,000
battery and fuel cell RD&D, which is a logical priority
given that these components are still the largest cost of 800
USD per kWh
an EV. Demonstrations also received significant funding, IEA ESTIMATE FOR
600
ICE PARITY TARGET
reflecting the desire of governments to monitor and learn
from initial vehicle and infrastructure deployment. 400 USD 300
U.S. DOE kWh
DEVELOPMENT
BATTERY COSTS ARE FALLING 200 COSTS DEUTSCHE BANK
ESTIMATED PRICE
Battery costs are coming down at a rapid pace, more
0
than halving in the past four years. According to the
2010 2012 2014 2016 2018 2020
U.S. Department of Energy (U.S. DOE), battery costs
based on development efforts have gone from USD 1,000
per kilowatt hour (kWh) in 2008 to USD 485/kWh of usable
energy at the end of 2012.8 These cost gains may take 3-4
years to be realised by industry, but the numbers give an
indication as to what is possible in the near term.* For
potential costs in 2020, Figure 16 looks at the projected
compound annual growth of the learning rate, which
describes the reduction in cost of batteries through
Volvo V60 — Brussels Motor Show, Belgium, January 2012
economies of scale. IEA estimates a learning rate of 9.5%,
*Costs do not include warranty costs or profit, and are based on a production volume of at least 100,000 batteries per year.Global EV Outlook DATA & ANALYSIS 18
MARKET TRENDS
vehicle (HEV). Sales of three of the four EV models are
currently above where the Prius HEV was at a corresponding
point in time. Sales of the Chevrolet Volt increased in 2012,
demonstrating consumer interest in the flexibility of a PHEV,
whereas sales of battery electric models such as the Nissan
LEAF and Mitsubishi i-MiEV have only recently been on the
up-tick. Of course, comparing PHEVs and BEVs to the market
development of an HEV is not a perfect “apples-to-apples”
comparison (for example, does not take share of overall
vehicle market into account, nor potential subsidy effects), but
it nevertheless provides a useful understanding of how EVs
Nissan LEAF — Brussels Motor Show, Belgium, January 2012 are faring in terms of monthly sales and market development.
For this momentum to keep going, the market needs to
Trends suggest that PHEVs have more market momentum
traverse the so-called “valley of death” from a niche market
than BEVs, perhaps reflecting consumers’ desire to keep fuel
to widespread adoption. Overall, sales numbers to date are
flexibility for greater range; though with increased EVSE
considered lower-than-expected by some car manufacturers
and consumer education it is conceivable that BEVs could
and market watchers, but in a weak car market during a
similarly gain momentum.
recession, the doubling of sales between 2011 and 2012 can
Figure 17 compares sales since market introduction for two at least be considered progress for vehicle electrification.
PHEVs, two BEVs, and the Toyota Prius hybrid electric
Figure 17. Sales Since Market Introduction
(updated through December 2012).
Source: EVI, MarkLines Database, Nissan, Toyota, hybridcars.com. Note: Date indicates when model was first released. Different models were released at different times in various locations,
but this graph is an attempt to approximate worldwide market deployment. All types of a model have been included, e.g. the Opel Ampera counts as sales under the Volt PHEV category.
4,000
Prius HEV (Dec 1997)
3,500 i-MiEV EV (Jul 2009)
Volt PHEV (Dec 2010)
3,000 LEAF EV (Dec 2010)
Prius PHEV (Jan 2012)
New Vehicle Sales
2,500
2,000
1,500
1,000
500
0
2 4 6 8 10 12 14 16 18 20 22 24 26 28 30 32 34 36
MonthsGlobal EV Outlook DATA & ANALYSIS 19
NATIONAL POLICY INITIATIVES
EVI data show where mass EV deployment is occurring. time-of-use rates. Local governments are pursuing fleet
A look at the policy support and market dynamics in acquisitions and partnering with the private sector on local
those locations yields important insights into the level mobility initiatives. Car sharing, for example, is proving a
of global deployment efforts [ Table 1 ]. natural fit with EVs since it allows drivers to reap the benefits
of electrified transport without having to face the higher
In most cases, strong government support on both the
upfront cost.
demand and supply sides have contributed to rising
market penetration. Well-designed financial incentives On the supply side, RD&D on batteries, fuel cells, and
for consumers at the national and local levels are lowering vehicle systems are having a positive impact on the market.
upfront costs for EVs and EVSE, quickening sales and Battery development costs have dropped significantly,
infrastructure deployment in a number of global markets. thereby reducing the largest cost barrier to mass-market
Such incentives are not only of benefit to early adopters, EV deployment.
but give car manufacturers and other consumers confidence
Pilot cities are learning not only from their initial experiences,
in market development.
but also from each other. By doing so, cities seeking to
A mix of non-financial incentives is also bearing fruit. transform local markets do not have to bear all the costs
EV access to restricted roadways is spurring uptake, of a first-mover, but can learn from other early leaders.
especially in California, the United States’ largest vehicle Policymakers are promoting inter-city and international
market. Utilities are demonstrating support through forums to share feedback from early market introduction.
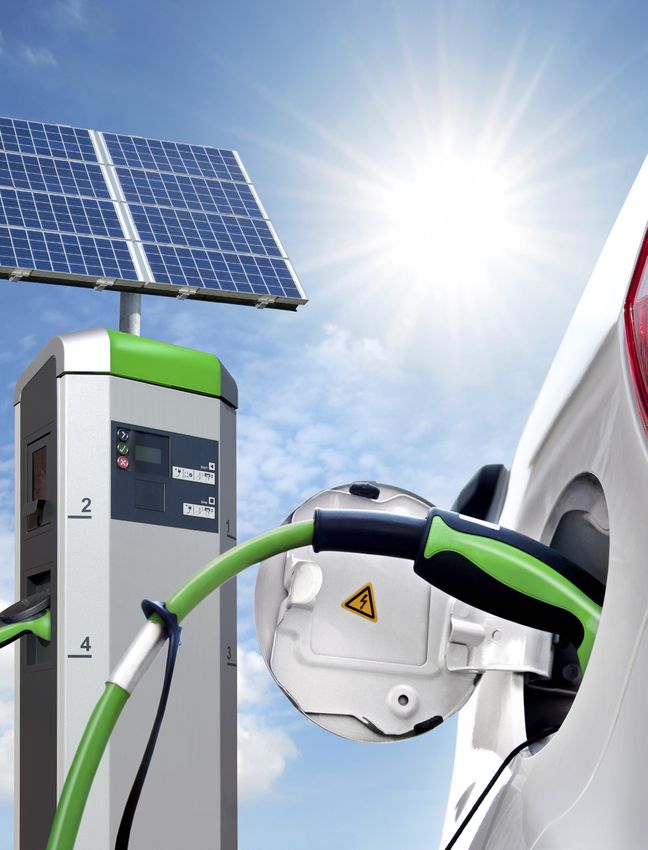
Smart Electric Drive Charging Station — Frankfurt, Germany, September 2011Global EV Outlook DATA & ANALYSIS 20
Table 1. Current National Policy Initiatives
Source: EVI. Note: Some countries are missing, and some cells are empty, due to incomplete data. May not include regional or local government initiatives.
EVI MEMBERS FINANCIAL INFRASTRUCTURE RD&D
Purchase subsidies for vehicles RMB 6.95 billion for
China of up to RMB 60,000.
---
demonstration projects.
Exemption from registration DKK 70 million for development of Focus on integrating EVs into
Denmark and road taxes. charging infrastructure. the smart grid.
EUR 5 million reserved for EUR 5 million reserved for
vehicles participating in national infrastructure as part of the national
Finland EV development programme, EV development programme,
---
ending in 2013. ending in 2013.
EUR 450 million in rebates given to
consumers buying efficient vehicles, EUR 50 million to cover
EUR 140 million budget with
France with 90% of that amount from fees on 50% of EVSE cost (equipment
focus on vehicle RD&D.
inefficient vehicles. Remaining 10% and installation).
(EUR 45M) is a direct subsidy.
Financial support granted for R&D
for electric drivetrains, creation
Four regions nominated as showcase and optimisation of value chain,
Germany Exemption from road taxes.
regions for BEVs and PHEVs. information and communications
technology (ICT), and
battery research.
Building R&D capability through
INR 100,000 or 20% of cost of vehicle, The National Mission for Electric joint efforts across government,
India whichever is less. Reduced excise Mobility will facilitate installation industry, and academia.
duties on BEV/PHEVs. of charging infrastructure. Focus on battery cells and
management systems.
EUR 1.5 million for consumer
Italy incentives, ending in 2014.
--- ---
Support to pay for 1/2 of the price
Support to pay for 1/2 of the price
gap between EV and corresponding
Japan ICE vehicles, up to YEN 1 million
of EVSE (up to YEN 1.5 million Major focus on infrastructure RD&D.
per charger).
per vehicle.
Tax reduction on vehicles amounting 400 charging points supported Focus on battery RD&D
Netherlands to 10-12% net of the investment. through incentives. (30% of 2012 spending).
Public incentives for a pilot
Incentives up to 25% of vehicle
demonstration project. Incentives
purchase price before taxes, up to Five major RD&D programmes
for charging infrastructure
Spain EUR 6,000. Additional incentives of
in collaboration between the
are operational with incentives
up to EUR 2,000 per EV/PHEV also for specific projects.
national government and
possible.
regional administrations.
EUR 4,500 for vehicles with
No general support for charging
emissions of less than 50 grams of
Sweden CO2 /km. EUR 20 million for
points besides RD&D funding EUR 2.5 million for battery RD&D.
(EUR 1 million in 2012).
2012-2014 super car rebate.
GBP 37 million for thousands of
The UK Technology Strategy Board
charging points for residential, street,
United Kingdom ---
railway, and public sector locations.
has identified 60 collaborative R&D
projects for low-carbon vehicles.
Available until 2015.
A tax credit of 30% of the cost, not to
exceed USD 30,000, for commercial
Up to USD 7,500 tax credit for
EVSE installation; a tax credit of up 2012 budget of USD 268 million
vehicles, based on battery capacity.
United States Phased out after 200,000 vehicles
to USD 1,000 for consumers who for battery, fuel cell, vehicle systems
purchase qualified residential EVSE. and infrastructure R&D.
from qualified manufacturers.
USD 360 million for infrastructure
demonstration projects.STRENGTHENING
electric mobility is clean and sustainable. Others stated
that concerns about EV readiness are outdated — that
PUBLIC-PRIVATE the EV market is ready to expand aggressively, given
proper consumer education and continued, robust
ENGAGEMENT government policies.
STUTTGART, OCTOBER 2012
The Electric Vehicles Initiative is engaging in a EVI convened a follow-up public-private roundtable
robust public-private dialogue between its member in Stuttgart, Germany, between representatives from
governments and relevant electric vehicle stakeholders. EVI member governments and major car manufacturers.
It is part of a collaboration that will be important in Participants shared experiences and feedback from
accelerating the global scale-up of EVs. Much of the manufacturers’ efforts to introduce EVs in global
Global EV Outlook is informed by this dialogue and markets, as well as governments’ efforts to realise EV
EVI will continue to absorb its key insights into goals through a variety of policies and programmes.
future analyses. Participants were encouraged by progress to date and
reaffirmed their commitment to vehicle electrification.
LONDON, APRIL 2012
However, it was noted that patience will be required
At the 3rd Clean Energy Ministerial a high-level
since significant market penetration will likely unfold
roundtable discussion was held between energy
over a number of years.
ministers and senior representatives from utilities,
fleet operators, and car and battery manufacturers, A major theme emerging from the roundtable was
among others. the need to align expectations between the various
EV stakeholders, particularly governments and
Participants shared an optimistic outlook for the
manufacturers. Common expectations about timescales
EV industry and committed to pursuing additional
should be aligned first, followed by coordination to
innovations, including wireless charging and the
implement market growth measures. These measures
creation of a luxury EV market. Car manufacturers
will benefit the market by signalling to consumers and
are responding by introducing and continually
investors that EV technology is viable today and will
improving vehicles to take advantage of the
continue to transform the market in the future.
growing market.
NEW DELHI, APRIL 2013
Participants discussed the benefits of EVs in
EVI launched the Global EV Outlook at the 4th
commercial and government fleets, which can play
Clean Energy Ministerial in New Delhi, India, further
a key role in scaling EV production and promoting
strengthening the interaction between governments
mass adoption by showing that the technology works.
and relevant electric vehicle stakeholders.
Participants also noted some challenges to EV
deployment, including high costs and inadequate
charging infrastructure. They agreed on the need for
more R&D, targeted consumer incentives, increased
public-private partnerships, and better coordination
between transport and energy systems to ensureGlobal EV Outlook DATA & ANALYSIS 22
CITY AND REGIONAL EV DEPLOYMENT EFFORTS
In May 2012, EVI and partner organisations published ! Several cities are leading by example and have already
the EV City Casebook, detailing local EV deployment efforts added EVs to municipal fleets and public transportation.
in 16 cities and regions across nine countries and three They are placing charging spots at public buildings and,
continents. The 16 cities and regions together held about in some cases, offering discounted electricity rates for
30% of worldwide EV stock and represent the early leaders EV users through municipal-owned utilities.
who are identifying challenges and best practices.
! The experiences of urban drivers and the pioneering
policies of local governments are accelerating the
transition to clean and sustainable mobility.
! Car sharing schemes (Berlin, Nagasaki, Brabantstad,
Amsterdam) are giving urban citizens first-hand
experience with driving an EV, which can then be
used to make informed decisions about EV purchasing.
Also, car sharing and EVs allow the two to be a
demonstrable solution for innovative mobility, while
lowering emissions, noise, and traffic.
! Fleets, including taxis (Amsterdam), buses (Los Angeles,
Shanghai), freight (Berlin), and two-wheelers (Barcelona),
are not just end-goals by themselves but also help propel
the city’s ability to electrify the rest of the passenger
vehicle stock (Stockholm).
! Cities are “living labs” for EV deployment efforts and can Participating cities and regions: Amsterdam, Barcelona,
offer early lessons to help other cities understand what is Berlin, Brabantstad (the Netherlands), Goto Islands/Nagasaki,
working, what is not working, and why. Hamburg, Helsinki, Kanagawa, Los Angeles, New York City,
North East England, Portland, Research Triangle (North
! Incentives need to be contextualised to best fit the needs
Carolina, United States), Rotterdam, Shanghai, Stockholm.
of a given city, including access to bus lanes (Portland),
use of free parking (Amsterdam), and additional fiscal
incentives (Kanagawa).
! Financial incentives have been effective in certain markets,
though other motivators including priority access to
parking have shown to be powerful incentives as well.
! Many cities are employing a mix of financial and
non-financial consumer incentives to boost demand
for vehicles and charging infrastructure. These include EV CITY
rebates or tax credits on EVs and EVSE, discounted tolls CASEBOOK
A LOOK AT THE GLOBAL ELECTRIC VEHICLE MOVEMENT
and parking fares, as well as preferential parking spaces,
access to restricted highway lanes, and expedited
permitting and installation of charging units. 2012Global EV Outlook TIMELINE 23
A BRIEF HISTORY OF
ELECTRIC VEHICLES 2008
Oil prices reach more than
USD 145 per barrel.
From Europe to North America to Asia, the history of electric mobility is a demonstration of the world’s 1908
persistent ingenuity and adaptation in transportation. The future of electric mobility — still to be written — The petrol-powered Ford Model T 2010
will stand, in part, on the achievements and lessons learned from these earlier periods. is introduced to the market. The BEV Nissan LEAF is launched.
1966
The U.S. Congress introduces legislation
1909 2011
recommending electric vehicles as a
William Taft becomes the first The world’s largest electric car sharing
means of reducing air pollution.
U.S. President to purchase an service, Autolib, is launched in Paris
automobile, a Baker Electric. 1973 with a targeted stock of 3,000 EVs.
1888
German engineer Andreas Flocken The OPEC oil embargo causes high
1912 2011
builds the first four-wheeled electric car. oil prices, long lines at petrol filling stations,
The electric starter, invented by GLOBAL EV STOCK REACHES
and renewed interested in EVs. NEW HISTORICAL PEAK OF 50,000
Charles Kettering, obviates the need for
1897
the hand-crank, making it easier for more 1976
The first commercial electric vehicles 2011
people to drive petrol-powered cars.
enter the New York City taxi fleet. France’s government launches French government fleet consortium
The carmaker, Pope Manufacturing Co., the “PREDIT” programme commits to purchase 50,000 EVs
1912
becomes the first large-scale EV accelerating EV RD&D. over four years.
GLOBAL EV STOCK REACHES
manufacturer in the United States. HISTORICAL PEAK OF 30,000
1996 2011
1899 1930s To comply with California’s Zero Nissan LEAF wins
1832–39 The “La Jamais Contente,” built in By 1935, EVs become all-but-extinct Emission Vehicle (ZEV) requirements European Car of the Year award.
Robert Anderson, of Scotland, builds the France, becomes the first electric vehicle due to the predominance of internal of 1990, General Motors produces and
first prototype electric-powered carriage. to travel over 100 km per hour. combustion engine (ICE) vehicles and begins leasing the EV1 electric car. 2012
availability of cheap petrol. The PHEV Chevrolet Volt outsells
1834 1900 1997 half the car models on the U.S. market.
Thomas Davenport, of the United States, Electricity-powered cars become the 1947 In Japan, Toyota begins sales of the Prius,
invents and installs the first direct current top-selling road vehicle in the United Oil rationing in Japan leads carmaker the world’s first commercial hybrid car. 2012
electrical motor in a car that operates States, capturing 28% of the market. Tama to release a 4.5hp electric car 18,000 are sold in the first production year. GLOBAL EV STOCK EXCEEDS 180,000
on a circular electrified track. with a 40V lead acid battery.
18 01–18 5 0 18 51–19 0 0 19 01–19 5 0 19 51–2 0 0 0 20 01–
THE BEGINNING THE FIRST AGE THE BOOM & BUST THE SECOND AGE THE THIRD AGE
The earliest electric vehicles are invented Electric vehicles enter the marketplace EVs reach historical production peaks High oil prices and pollution cause Public and private sectors recommit
in Scotland and the United States. and find broad appeal. only to be displaced by petrol-powered cars. renewed interest in electric vehicles. to vehicle electrification.
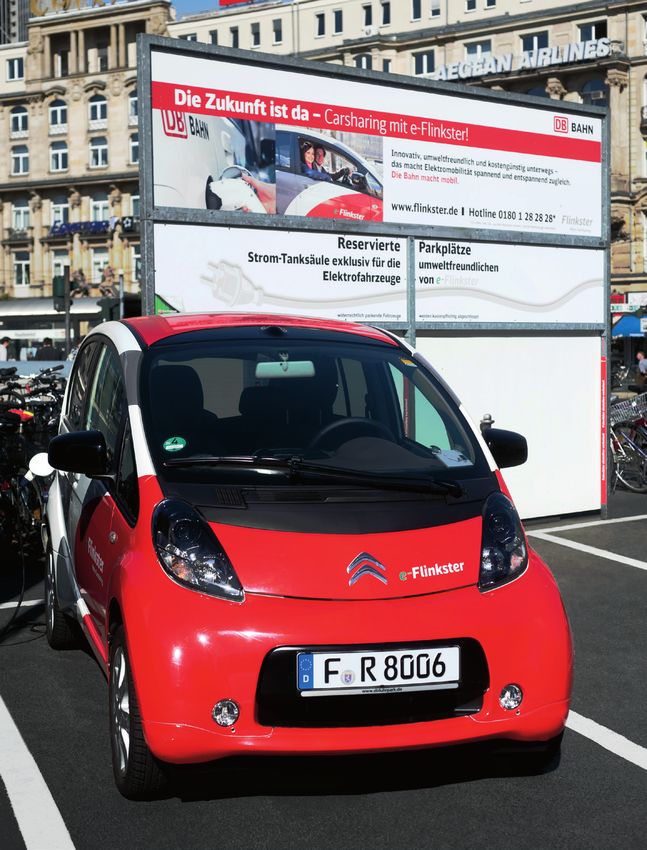
Sources: Curtis D. Anderson and Judy Anderson, Electric and Hybrid Cars: A History, McFarland and Company, 2012 ; burnanenergyjournal.com; pbs.org/now/shows/223/electric-car-timeline.e-Flinkster Charging Station — Frankfurt am Main, Germany, September 2011
Global EV Outlook CHALLENGES & OPPORTUNITIES    25

CHALLENGES
& OPPORTUNITIES
Despite the advances that vehicle electrification has made in the past two years, there are still significant barriers that stand

in the way of widespread adoption. Technological, financial, market, and policy challenges could hinder market transformation

if not addressed through further RD&D investments, public-private collaboration, and innovative policy and business solutions.

This section identifies the most pressing challenges to deployment and offers a number of opportunities that governments,

in coordination with the private sector and the broader EV stakeholder community, can pursue to make a positive impact. While

many EV challenges can be region-specific, those outlined below are some of the major issues facing both early market leaders

and countries still contemplating initial approaches to electrification. For highlights, see the Opportunity Matrix on page 34.

       TECHNOLOGY

COST
The most significant technological challenges currently              are scheduled to expire soon. As government subsidies begin
facing electric-drive vehicles are the cost and performance          to phase out, the upfront purchase price will revert to higher
of their components, particularly the battery. Price per usable      levels unless substantial cost reductions are achieved.
kilowatt hour of a lithium-ion battery ranges between
USD 500-650 and thus makes up a large portion of a                   RANGE LIMITATIONS: REAL AND PERCEIVED
vehicle’s cost, depending on the size of the battery pack.    9
                                                                     The sizable EV price premium perhaps would be acceptable
A Nissan LEAF, for example, has a 24 kWh battery that costs          to a large number of consumers if the vehicles offered more
approximately USD 12,000, which represents about a third             range or differentiated functionality than is currently on the
of the vehicle’s retail price. Similarly, Ford uses a battery
                            10
                                                                     market. With a usable range of about 100 kilometres (km),
that costs between USD 12,000-15,000 for its Focus Electric,         the 24 kWh battery-powered Nissan LEAF achieves about
an electric version of its petrol-powered Focus that itself          a fifth of the range of a comparable ICE vehicle. All-electric
sells for around USD 22,000. PHEVs may be even more
                                 11
                                                                     vehicles with larger battery packs, such as the 85 kWh Tesla
expensive due to the cost and complexity of dual powertrains.        Model S, may offer much greater range (480 km) but also
A Chevrolet Volt only uses a 16 kWh battery pack, but its            come with significantly higher retail prices, which will likely
purchase price is nearly USD 5,000 more than a LEAF, due             deter most consumers. PHEVs eliminate range constraints,
in large part to its hybrid technology.                              but many only offer about 15-65 km of electric-only range and
                                                                     thus may not fully deliver the benefits of electric drive (such
Most EVs will remain more expensive in the near term than
                                                                     as cheaper fuel and lower emissions) if driven predominantly
their petrol vehicle equivalents even when combined with
                                                                     in petrol-mode.
government purchase subsidies offered in many countries.
Twelve EVI member governments offer some type of fiscal              These range limitations appear to be holding back many
incentive at the national level for purchasing electric              potential customers. One survey of American consumers
vehicles, usually in the form of tax credits or direct rebates.      found that 75% of respondents considered range to be either
Many governments cap purchase subsidies at a certain                 a major disadvantage or somewhat of a disadvantage of EVs.12
amount of money or manufacturer sales volume, and some               Another survey showed that consumers in the United States
Global EV Outlook CHALLENGES & OPPORTUNITIES 26
TECHNOLOGY [ continued ]
and France were the most sensitive to range.13 Yet in the cost and performance enhancements by 2020. Lithium-ion
United States the average daily vehicle distance travelled technology is still far from its theoretical energy density
per person is 46 km and average vehicle trip distance is limit. Improvements in battery pack energy density,
15 km. Given the fact that U.S. average travel distances
14
operating temperature range, and cycle life will all be
are the longest in the world, it is likely that most of today’s important innovations that further reduce cost and increase
electric vehicles have sufficient range for a majority of range and battery life.
consumers worldwide. Nonetheless, as long as this gap
remains between range expectations and actual average OPPORTUNITY
driving needs, negative perceptions about EV range and International RD&D cooperation and coordination
notions of range anxiety will persist. can help address common areas of need, spread costs,
and accelerate technological breakthroughs.
SAFETY AND RELIABILITY
Perceptions regarding the safety and reliability of EVs
Increasing the usable range of EVs is necessary to address
also remain an issue throughout the market. Fire-related
consumer anxiety and open the market to drivers who need
incidents in China and the United States in 2011, for instance,
longer range vehicles. This will require a significant increase
attracted high-profile media attention.15 While extensive
in battery energy density, which could be achieved through
testing and evaluation have demonstrated that EVs do not
longer-term research into next-generation battery chemistries,
pose a greater risk of fire than petrol-powered vehicles,
such as lithium-sulfur, zinc-air, and lithium-air.19 More reliable
these incidents have brought extra scrutiny of EV safety.16
manufacturing and further research into battery abuse
(By comparison, there is usually little media reporting on
tolerance will improve both actual and perceived reliability.
the more than 250,000 ICE vehicle fires per year recorded
in the United States.17 ) EVI member governments have already made substantial
and consequential RD&D investments in the last five years,
Other reports of battery failures, recalls, and climate-related
with USD 8.7 billion in collective spending since 2008.
battery degradation have further raised doubts about EV
Many are committing to making further investments in the
technology.18 Thus, the bar appears to be set quite high
next five years. These research commitments represent an
in the public mind in terms of EV safety and reliability,
opportunity for government support to make significant
and remains an issue that needs to be addressed.
impacts on the EV market so cost-parity can be achieved
PROGRESS THROUGH RESEARCH AND DEVELOPMENT without purchase subsidies. Indeed, continued government
Recently, the cost of batteries has been steadily decreasing RD&D can help provide the technology push needed to make
as a result of both public and private sector advances and meaningful leaps in innovation and help create a more
will likely drop even further in the next five years due to sustainable market for EVs. International cooperation and
pack design optimisation and cell count reduction, lower coordination on RD&D can also help by filling gaps in the
cost of cell materials, economies of scale, and improved most pressing areas, sharing costs, and accelerating
manufacturing processes. technological breakthroughs.
OPPORTUNITY
Government funding for research can help achieve long-term
cost-parity without the need for purchase subsidies.
Sustained R&D investment by industry and governments
is necessary to achieve some of the more consequentialGlobal EV Outlook CHALLENGES & OPPORTUNITIES 27
FINANCE
SUSTAINABLE INFRASTRUCTURE FINANCING
Perhaps the most urgent need in all EV markets is in
financing charging infrastructure. When the mass-market
introduction of electric vehicles began two years ago there
was much debate about a so-called “chicken and egg”
dilemma facing the nascent market: should EVSE be
deployed first in order to spur EV sales, or does vehicle
uptake need to occur before charging infrastructure takes
shape? In 2013, the question is largely irrelevant. The reality
is that EVs and EVSE are being deployed simultaneously
in a mostly market-driven manner, with governments at
the national, regional, and local levels contributing to
infrastructure investment. EVI member governments
The immediate challenge of high purchase prices exposes alone have collectively made about USD 800 million in
the need for different EV financing options than are widely infrastructure spending already.
available at present. Should cost reductions in batteries and
vehicle systems not materialise quickly enough, attractive
OPPORTUNITY
financing mechanisms may be needed to maintain sales
Identify and employ sustainable business models
growth, particularly as government purchase subsidies are
to best match charging infrastructure supply
phased out. Vehicle leasing is one potential pathway, and
and demand, especially in public locations.
there is some evidence that competitive lease rates have
already helped to bolster EV sales.20
IDENTIFYING BUSINESS MODELS
OPPORTUNITY The most salient issue going forward is to identify and
Attractive vehicle financing can buoy sales, particularly employ sustainable business models to best match supply
as government purchase subsidies are phased out. and demand for charging infrastructure, especially in public
locations. That is, how will private EVSE investment increase
However, leasing options may remain limited in emerging as early government support declines? A number of financing
economies that do not yet have an established vehicle schemes exist in the deployment of non-residential charging
financing market, in which case there may be a need to infrastructure. Pricing and operating models often depend
identify other methods for financing EV purchases. on the ultimate owner of the EVSE and the cost recovery
(In China, for example, only 10% of total car buyers currently mechanisms available. Public and semi-public EVSE can be
choose financing. ) Such options include leasing only
21
deployed by property owners, who pay the capital costs of
the battery while purchasing the rest of the vehicle, or purchasing and installing EVSE, then levy fees for its use —
providing some guaranteed residual value for the vehicle either by electricity consumed or by the length of time spent
or the battery at the end of its use. Renault offers battery charging. Many retailers, restaurants, and other private
leasing for its Zoe and Twizy models, as does Daimler for businesses deploy publicly-accessible EVSE in such a
its Smart Fortwo. These models charge a monthly fee of manner, typically receiving payment directly at the charging
about USD 100 to lease the battery and often come with station via credit card. In some instances, these businesses
replacement guarantees. 22
may offer free charging as a way of attracting customers.You can also read