Upgrade verification note for the CAMS real-time global atmospheric composition service
←
→
Page content transcription
If your browser does not render page correctly, please read the page content below

ECMWF COPERNICUS REPORT

Copernicus Atmosphere Monitoring Service

           Upgrade verification note for the
           CAMS real-time global
           atmospheric composition service
           Evaluation of the e-suite for the
           CAMS 47R2 upgrade of 18 May 2021

           Issued by: KNMI
           Date: 11 May 2021
           Ref: CAMS84_2018SC3_D3.2.1-202105_esuite
This document has been produced in the context of the Copernicus Atmosphere Monitoring Service (CAMS).
The activities leading to these results have been contracted by the European Centre for Medium-Range Weather Forecasts,
operator of CAMS on behalf of the European Union (Delegation Agreement signed on 11/11/2014). All information in this
document is provided "as is" and no guarantee or warranty is given that the information is fit for any particular purpose.
The user thereof uses the information at its sole risk and liability. For the avoidance of all doubts, the European Commission
and the European Centre for Medium-Range Weather Forecasts has no liability in respect of this document, which is merely
representing the authors view.
Copernicus Atmosphere Monitoring Service

               Upgrade verification note for the CAMS
               real-time global
               atmospheric composition service
               Evaluation of the e-suite for the
               CAMS 47R2 upgrade of 18 May 2021
               AUTHORS:
               H. J. Eskes (KNMI), S. Basart (BSC), A. Benedictow (MetNo), Y. Bennouna (CNRS-LA),
               A.-M. Blechschmidt (IUP-UB), Q. Errera (BIRA-IASB), K. M. Hansen (AU),
               J. Kapsomenakis (AA), B. Langerock (BIRA-IASB), A. Richter (IUP-UB),
               N. Sudarchikova (MPG), M. Schulz (METNO), C. Zerefos (AA)

               REPORT OF THE COPERNICUS ATMOSPHERE MONITORING SERVICE,
               VALIDATION SUBPROJECT.

               CITATION:
               Eskes, H. J., S. Basart, A. Benedictow, Y. Bennouna, A.-M. Blechschmidt, Q. Errera, K. M.
               Hansen, J. Kapsomenakis, B. Langerock, A. Richter, N. Sudarchikova, M. Schulz, C.
               Zerefos, Upgrade verification note for the CAMS real-time global atmospheric
               composition service: Evaluation of the e-suite for the CAMS 47R2 upgrade of 18 May
               2021, Copernicus Atmosphere Monitoring Service (CAMS) report,
               CAMS84_2018SC3_D3.2.1-202105_esuite.pdf, May 2021, doi: 10.24380/1ef3-gq26.

               STATUS:
               Version 1.0, final

               DATE:
               11 May 2021

CAMS84_2018SC3_D3.2.1-202105_esuite - Evaluation e-suite                                      Page 3 of 64
Copernicus Atmosphere Monitoring Service

Executive Summary
The Copernicus Atmosphere Monitoring Service (CAMS, http://atmosphere.copernicus.eu) is a
component of the European Earth Observation programme Copernicus. The CAMS global near-real
time (NRT) service provides daily analyses and forecasts of reactive trace gases, greenhouse gases
and aerosol concentrations.
The CAMS service includes an activity (CAMS-84) dedicated to the validation of the service products.
The latest validation results for the CAMS-global near-real time service (the o-suite) products can be
found in Schulz et al. (2020) and the activity is described in Eskes et al. (2015). The observational
datasets used for this validation are described in Eskes et al. (2021). These validation reports and
the verification websites can be found at http://atmosphere.copernicus.eu/user-
support/validation/verification-global-services.
Before each upgrade, the new model and assimilation configuration is operated in parallel (the e-
suite) to the operational NRT service (the o-suite, e.g., CY47R1) for about half a year. For the 18 May
2021 upgrade to CY47R2, the e-suite run has experiment id "0075", with class=mc, and is available
from 5 January 2021 onwards, so there are only a few months of data in the wintertime available to
the evaluation. The corresponding control run, without the assimilation of the atmospheric
composition satellite data, has experiment id "hig6", class =rd. The GHG delayed mode analysis and
forecast runs are not evaluated (no e-suite data available).
Below a set of quick-look validation results are presented from a comparison of the performance of
the e-suite runs with the operational run (o-suite) and independent observations. The main
conclusions are listed below, and the evidence for these findings is presented in section 2 in the
form of a series of plots comparing e-suite, o-suite and independent observations. The o-suite and
e-suite system changes are discussed in section 1.
Main conclusions on the performance of the e-suite
The upgrade of the CAMS global system of May 2021 (CY47R2) involves only minor model changes
(listed in section 1) which are reflected in the validation results presented. Overall, the quality of the
e-suite is very comparable to the o-suite. Four small improvements and two small degradations are
reported for the e-suite and no major degradation was observed for any specific species or regions.
Based on these findings we can give a positive advice for the e-suite implementation. The scorecard
below summarises the results.
Global Aerosol
The comparison between o-suite and e-suite and the respective control simulations show very
similar results for the global aerosol properties (section 2.1), except a very small decrease in black
carbon optical depth going from the o-suite to the e-suite (-8%).

CAMS84_2018SC3_D3.2.1-202105_esuite - Evaluation e-suite                                        Page 4 of 64

Copernicus Atmosphere Monitoring Service

Property                                            Rel.  Property                                 Rel.
                                                    score                                          score

Global AOD                                            n    CO surface                                n

Ångstrøm exponent                                     n    CO profiles (aircraft)                    n

Dust AOD                                              n    CO columns (satellite, FTIR)              +

Dust PM10 Mediterranean                               n    Tropospheric NO2 column                    -

Surface PM10, Europe and US                           n    HCHO column                               n

Surface PM2.5, Europe and US                          n    Surface ozone, Arctic                     n

Ozone, free troposphere                               n    Surface ozone, Midlatitude                +

Ozone stratospheric profile                           n    Surface ozone, Antarctic                   -

Ozone column                                          +    Surface ozone, Europe                     +

Table S1. Scorecard for the relative performance of the e-suite versus the performance of the o-suite
against independent observations. Meaning of the “relative score” symbols:
++     e-suite performs significantly better than the o-suite;
+      e-suite shows small improvements;
n      (neutral) no significant difference between o-suite and e-suite;
-      score is somewhat degraded in the e-suite;
--     e-suite performs significantly worse than the o-suite.

Dust and aerosol evaluation over North Africa, the Middle East and Europe
The e-suite and o-suite are showing nearly identical results for AOD/DOD in North Africa, the Middle
East and Europe, compared to surface remote sensing AOD observations from AERONET. The same
holds for PM2.5/PM10 in Europe, compared to EEA-EIONET surface observations (section 2.2).
Tropospheric ozone (O3)
Ozone in-situ surface concentrations have been compared with NOAA ESRL stations (Section 2.3)
and European Airbase observations (Section 2.4). For most regions, the USA, Europe and Asia,
Southern Hemisphere, Arctic, the e-suite and o-suite and the respective control runs show nearly
identical biases. For the Antarctic, there is some indication of a slightly increased negative bias. The
e-suite, however, reduces somewhat the positive offset observed in the o-suite over central
European Airbase stations, but the e-control and control runs are nearly identical.

CAMS84_2018SC3_D3.2.1-202105_esuite - Evaluation e-suite                                      Page 5 of 64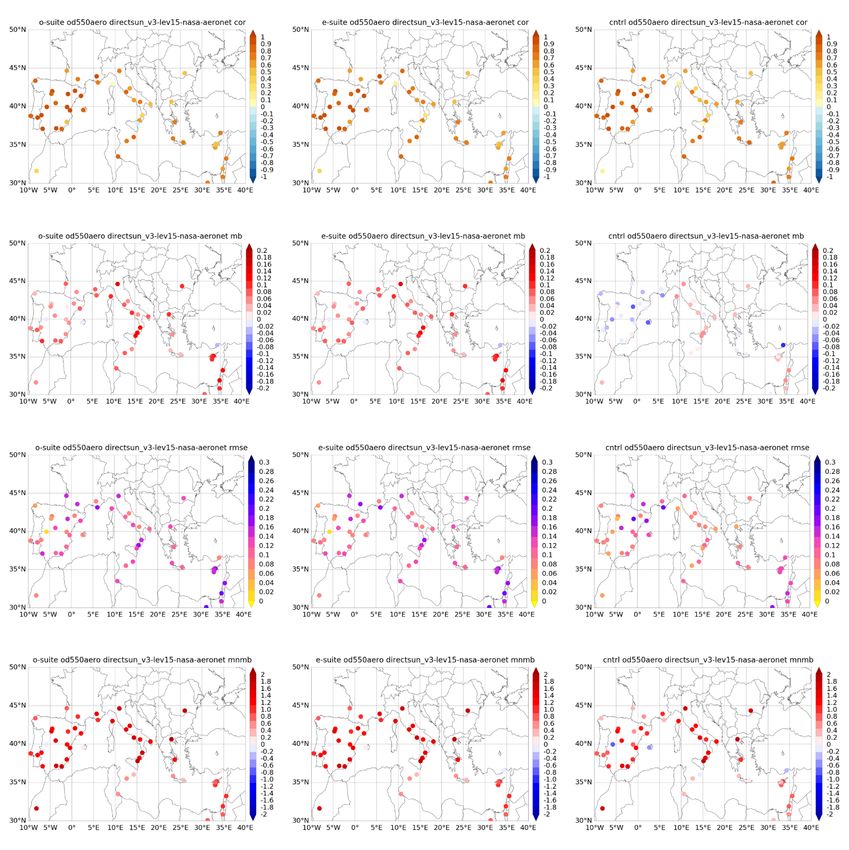
Copernicus Atmosphere Monitoring Service

For ozone comparisons against IAGOS aircraft measurements, both profile and cruise data
comparisons have been carried out (Section 2.5). The results from the e-suite (0075) and o-suite
(0001) for both analysis and forecast are very similar for the different regions sampled. Only a slight
difference is found in the surface layer over Europe where the e-suite provides slightly better
performance (MNMB) than the o-suite, and conversely over India.
Surface ozone mixing ratios predicted with the 0075 e-suite was evaluated against measurements
from two sites within the Arctic: Svalbard and the Villum Research Station (Greenland) from 5
January - 31 March 2021 (Section 2.6). Differences between the e-suite and the o-suite are very
small, with a slightly lower bias for the e-suite (0.04-0.05) than for the o-suite (0.06-0.07), whereas
the correlations are slightly higher for the o-suite (0.21-0.29) than for the e-suite (0.18-0.26).
The comparisons with METOP-B IASI ozone shows that model configurations are in good agreement
with the observations. The e-suite shows small improvements compared to the o-suite, which is
reflected in the regional and temporal bias reduction (Section 2.7).
Tropospheric Carbon Monoxide (CO)
Carbon monoxide surface concentrations have been compared with European Airbase surface
observations (Section 2.8). There are no significant changes between e-suite and o-suite, or e-
control and o-control in terms of both MNMBs and correlations between modelled and observed
values.
For CO, comparisons against IAGOS aircraft observations of profile and cruise data have been
carried out (Section 2.9). No notable difference is found in the performance from the e-suite (0075)
and o-suite (0001) for both analysis and forecast for the different regions sampled. However, the e-
suite presents slightly worse performance (MNMB) than the o-suite in the surface over Eastern Asia
for the month of February and conversely in March. A slight difference is also found at the surface
in February over India with slightly better performance (MNMB) for the e-suite. Over Western
Africa slight differences are found in both surface and free troposphere with a smaller bias from the
e-suite at the surface and conversely in the free troposphere.
The CO total columns from the o-suite, control run and e-suite have been compared to MOPITT V8
(thermal infrared radiances) and IASI satellite retrievals (section 2.10). In general, both model runs
are in relatively good agreement with the MOPITT observations and almost equal in most of the
regions. The e-suite shows small improvements compared to the o-suite, reflected in the slightly
smaller negative bias, especially over the Southern Hemisphere.
Tropospheric CO total, tropospheric and stratospheric columns were compared against NDACC FTIR
(section 2.11). Overall, the relative bias against FTIR observations of the e-suite did not change
compared to the o-suite.
Tropospheric Nitrogen dioxide (NO2)
The e-suite and o-suite have been compared against Sentinel-5P TROPOMI NO2 observations
(Section 2.12). Time series comparisons show that the e-suite produces higher NO2 and compares
worse than the o-suite to TROPOMI retrievals. All model runs are positively biased compared to
TROPOMI IUP-UB retrievals. Differences between the e-suite and e-suite control are relatively small

CAMS84_2018SC3_D3.2.1-202105_esuite - Evaluation e-suite                                       Page 6 of 64

Copernicus Atmosphere Monitoring Service

and only apparent for East-Asia and North-Africa for Jan 2021. The same is true when comparing to
the operational offline product, with the exception for the regions over Africa, where negative
biases are found. Map-based comparisons show positive biases over emission hotspots apart from a
few exceptions. There are only small differences in general between e-suite and e-suite control.
Comparison with the Cabauw Maxdoas NDACC data (Section 2.13) did not reveal a significant
difference between performance of the e-suite and o-suite run.
Formaldehyde (HCHO)
Regional time series comparisons and global maps (Section 2.14) against TROPOMI HCHO satellite
observations show very similar values for the e-suite, e-suite control and o-suite and differences to
TROPOMI are small. Global map comparisons for March 2021 show positive differences (retrievals
larger than simulations) over South America and Northern Australia for all model runs, negative
differences are found over South Africa and South Asia.
Comparison with the Cabauw and De Bilt Maxdoas NDACC data did not reveal a significant
difference between the performance of the 47R2 e-suite and 47R1 o-suite run (Section 2.14).
Stratospheric ozone
Ozone concentrations in the stratosphere for the Cy47R2 experiments have been compared with
satellite observations from MLS V4.2 offline and OMPS-LP v2.5 and shows no significant changes in
performance (Section 2.15).
The stratospheric partial column comparison against NDACC LIDAR and UVVIS ZENITH shows no
change in performance (Section 2.16).

CAMS84_2018SC3_D3.2.1-202105_esuite - Evaluation e-suite                                   Page 7 of 64

Copernicus Atmosphere Monitoring Service

Table of Contents
1. Description of the o-suite and e-suite                                                                                                       9
1.1 o-suite: model and data assimilation aspects........................................................................... 9
1.2 o-suite control ....................................................................................................................... 12
1.3 High-resolution CO2 and CH4 forecasts and delayed-mode analyses ....................................... 12
1.4 e-suite ................................................................................................................................... 13

2. Upgrade evaluation results: e-suite versus o-suite                                                                                         14
2.1 Global aerosol evaluation ...................................................................................................... 14
2.2 Dust and aerosol evaluation over North Africa, the Middle East and Europe ......................... 18
2.3 Verification with ESRL-GMD surface ozone observations ....................................................... 22
2.4 Verification of surface ozone in Europe ................................................................................. 24
2.5 Verification with IAGOS ozone observations .......................................................................... 25
2.6 Verification with ozone surface data in the Arctic .................................................................. 31
2.7 Ozone validation with IASI satellite observations .................................................................. 32
2.8 CO validation with European Airbase Surface Observations................................................... 34
2.9 CO validation with IAGOS Aircraft observations..................................................................... 36
2.10 Comparisons with MOPITTv8 and IASI CO data .................................................................... 42
2.11 CO validation with NDACC and TCCON surface remote-sensing observations....................... 45
2.12 Tropospheric nitrogen dioxide comparisons with TROPOMI ................................................ 46
2.13 Tropospheric nitrogen dioxide comparisons with MAXDOAS ............................................... 48
2.14 Formaldehyde (HCHO) ......................................................................................................... 49
2.15 Stratospheric ozone: Comparison with satellite observations .............................................. 52
2.16 Stratospheric ozone: Comparison with NDACC observations ............................................... 56

3. References                                                                                                                                 57

Annex 1: Acknowledgements for measurements used                                                                                               60

CAMS84_2018SC3_D3.2.1-202105_esuite - Evaluation e-suite                                                                            Page 8 of 64

Copernicus Atmosphere Monitoring Service

1. Description of the o-suite and e-suite

Below a short model description is given on both the CAMS o-suite operational data-assimilation
and forecast run and the new e-suite.

1.1 o-suite: model and data assimilation aspects
This section provides information on the CAMS global data-assimilation and forecast operational
configuration (the CAMS o-suite). The dates of the last upgrade are listed in Table 1.1. Table 1.2
provides information on the satellite data used in the o-suite. Further details on the model runs and
their data usage can be found at http://atmosphere.copernicus.eu/documentation-global-systems.
The o-suite consists of the IFS-CB05 chemistry combined with the CAMS bulk aerosol model. The
chemistry is described in Flemming et al. (2015) and Flemming et al. (2017), aerosol is described in
Morcrette et al. (2009). The forecast length is 120 h. The o-suite data is stored under expver ‘0001’
of class ‘MC’. On 21 June 2016 the model horizontal resolution has seen an upgrade from T255 to
T511, and forecasts are produced twice per day.
A short summary of the main model specifications:
    •   The modified CB05 tropospheric chemistry is used (Williams et al., 2013), originally taken
        from the TM5 chemistry transport model (Huijnen et al., 2010)
    •   Stratospheric ozone during the forecast is computed from the Cariolle scheme (Cariolle and
        Teyssèdre, 2007) as already available in IFS, while stratospheric NOx is constrained through a
        climatological ratio of HNO3/O3 at 10 hPa.
    •   Monthly mean dry deposition velocities are based on the SUMO model provided by the
        MOCAGE team.
    •   Data assimilation is described in Inness et al. (2015) and Benedetti et al. (2009) for chemical
        trace gases and aerosol, respectively. Satellite data assimilated is listed in Table 2.2 and Fig.
        2.1.
    •   Anthropogenic and biogenic emissions are based on MACCity (Granier et al., 2011) and a
        climatology of the MEGAN-MACC emission inventories (Sindelarova et al., 2014).
        Anthropogenic emissions changed to CAMS_GLOB v2.1 with the July 2019 update.
    •   NRT fire emissions are taken from GFASv1.2 (Kaiser et al. 2012).

Table 1.1: Overview of the operational model runs used as reference in this validation report.

  Forecast           Exp. ID    Brief description                 Upgrades (e-suite ID)     Cycle
  system
   O-suite           0001       Operational CAMS DA/FC run        20201006-present          47R1

  Control            hdir       Control forecast run without DA   20201006-present          47R1

  GHG run            hd7v       Tco399L137 NRT CO2, CH4           20201101-present          47R1
                                analyses (~25km)
                     he9h       High resolution Tco1279 (~9km)    20201101-present          47R1
                                NRT CO2, CH4 forecast

CAMS84_2018SC3_D3.2.1-202105_esuite - Evaluation e-suite                                       Page 9 of 64
Copernicus Atmosphere Monitoring Service

Table 1.2: Satellite retrievals of reactive gases and aerosol optical depth that are actively assimilated
in the o-suite in Cy47R1.
  Instrument       Satellite      Provider         Version     Type                   Status
  MLS              AURA           NASA             V4          O3 Profiles            20130107 -
  OMI              AURA           NASA             V883        O3 Total column        20090901 -
  GOME-2           Metop-A        Eumetsat         GDP 4.8     O3 Total column        20131007 - 20181231
  GOME-2           Metop-B        Eumetsat         GDP 4.8     O3 Total column        20140512 -
  GOME-2           Metop-C        Eumetsat         GDP 4.9     O3 Total column        20200505 -
  SBUV-2           NOAA-19        NOAA             V8          O3 21 layer profiles   20121007 - 20201005
  OMPS             Suomi-NPP   NOAA /                          O3 13-layer profiles   20170124 – 20190409
                               EUMETSAT                                               20201006-
  OMPS             NOAA-20     NOAA /                          O3 13 layer profiles   20201006-20201215
                               EUMETSAT
  TROPOMI          Sentinel-5P ESA                             O3 column              20181204-
  IASI             MetOp-A        LATMOS/ULB -                 CO Total column        20090901 - 20180621
                                  Eumetsat                                            20180622 - 20191118
  IASI             MetOp-B        LATMOS/ULB -                 CO Total column        20140918 - 20180621
                                  Eumetsat                                            20180622 -
  IASI             MetOp-C        Eumetsat                     CO total column        20191119 -
  MOPITT           TERRA          NCAR             V5-TIR      CO Total column        20130129 -
                                                   V7-TIR                             20160124 - 20180626
                                                   V7-TIR                             20180626
                                                   Lance
                                                   V8-TIR                             20190702
  OMI              AURA           KNMI             DOMINO      NO2 Tropospheric       20120705 -
                                                   V2.0        column
  GOME-2           MetOp-A        Eumetsat         GDP 4.8     NO2 Tropospheric       20180626 - 20200504
                                                               column
  GOME-2           MetOp-B        Eumetsat         GDP 4.8     NO2 Tropospheric       20180626 -
                                                               column
  GOME-2           MetOp-C        Eumetsat         GDP 4.9     NO2 Tropospheric       20200505-
                                                               column
  GOME-2           MetOp-A        Eumetsat         GDP 4.8     SO2 Total column       20150902 -
  GOME-2           MetOp-B        Eumetsat         GDP 4.8     SO2 Total column       20150902-20200414
  GOME-2           MetOp-C        Eumetsat         GDP 4.9     SO2 Total column       20200505-
  MODIS            AQUA /         NASA             Col. 5      Aerosol total          20090901 -
                   TERRA                           Deep Blue optical depth,           20150902 -
                                                   Col. 6, 6.1 fire radiative power   20170124 -
  PMAp             METOP-A        EUMETSAT                     AOD                    20170124 -
                   METOP-B                                                            20170926 -

CAMS84_2018SC3_D3.2.1-202105_esuite - Evaluation e-suite                                            Page 10 of 64
Copernicus Atmosphere Monitoring Service
Figure 2.1: Satellite observation usage in the real-time analysis, for ozone, CO, aerosol AOD and
NO2, from October 2014 onwards. Top rows (in green): products assimilated using averaging
kernels. Sentinel-5P TROPOMI ozone is assimilated since Dec. 2018 and other products from
TROPOMI are monitored.
The aerosol model includes 14 prognostic variables (Remy et al., 2019).
• 3 size bins each for sea-salt and desert dust
• 2 bins (hydrophibic and hydrophobic) each for organic matter and black carbon
• 1 bin for sulphate
• 2 bins (fine and coarse) for nitrate (New since 46R1)
• 1 bin for ammonium (New since 46R1)
The SO2 precursor for sulphate aerosol no longer exists as a separate prognostic in the aerosol
scheme, which since 46R1 couples directly to the SO2 in the chemistry scheme instead. Likewise, the
precursors for the new nitrate and ammonium aerosol (nitric acid and ammonia) are also part of the
chemistry scheme rather than the aerosol scheme.
Aerosol total mass is constrained by the assimilation of MODIS and PMAp AOD (Benedetti et al.
2009). A variational bias correction is currently applied for the PMAp AOD based on the approach
used also elsewhere in the IFS (Dee and Uppala, 2009).
A history of updates of the o-suite is documented in earlier MACC-VAL and CAMS reports and can
be found at https://atmosphere.copernicus.eu/node/326. This includes a list with changes
concerning the assimilation system. The CAMS o-suite system is upgraded regularly, following
CAMS84_2018SC3_D3.2.1-202105_esuite - Evaluation e-suite Page 11 of 64Copernicus Atmosphere Monitoring Service updates to the ECMWF meteorological model as well as CAMS-specific updates such as changes in chemical data assimilation. The last major upgrade of the CAMS global system is based on IFS version cy47r1_CAMS. For the aerosol and reactive trace gas components the upgrade took place on 6 October 2020. For the greenhouse gases the upgrade to 47R1 took place on 1 November 2020. see https://atmosphere.copernicus.eu/cycle-47r1 or https://confluence.ecmwf.int/display/COPSRV/Current+global+production+suites. The validation for this 47r1 upgrade is described in Eskes et al. 2020: https://atmosphere.copernicus.eu/sites/default/files/2020-10/CAMS84_2018SC2_D3.2.1- 202009_esuite.pdf The meteorological changes can be found on the ECMWF-IFS CY47R1 page, https://confluence.ecmwf.int/display/COPSRV/Implementation+of+IFS+cycle+47r1. 1.2 o-suite control The control run (relevant expver = hdir since 06/10/2020) applies the same model settings as the o- suite cy47r1, except that data assimilation is not switched on. The meteorology in the control run is initialized with the meteorological fields from the o-suite. 1.3 High-resolution CO2 and CH4 forecasts and delayed-mode analyses The pre-operational forecasts of CO2 and CH4 use an independent setup of the IFS at a resolution of TL1279, i.e. ~16 km horizontal, and with 137 levels. This system runs in real time and does not apply data assimilation for the greenhouse gases. The land vegetation fluxes for CO2 are modelled on-line by the CTESSEL carbon module (Boussetta et al., 2013). A biogenic flux adjustment scheme is used in order to reduce large-scale biases in the net ecosystem fluxes (Agusti-Panareda, 2015). The anthropogenic fluxes are based on the annual mean EDGARv4.2 inventory using the most recent year available (i.e. 2008) with estimated and climatological trends to extrapolate to the current year. The fire fluxes are from GFAS (Kaiser et al., 2012). Methane fluxes are prescribed in the IFS using inventory and climatological data sets, consistent with those used as prior information in the CH4 flux inversions from Bergamaschi et al. (2009). The anthropogenic fluxes are from the EDGAR 4.2 database (Janssens-Maenhout et al, 2012) valid for the year 2008. The biomass burning emissions are from GFAS v1.2 (Kaiser et al., 2012). The high-resolution forecast experiments also included a linear CO scheme (Massart et al., 2015). The greenhouse gas configurations are not discussed in this report because there is no e-suite configuration available. Readers are referred to the latest validation report (Sudarchikova et al., 2021) and the 47R1 e-suite report (Eskes et al. 2020). CAMS84_2018SC3_D3.2.1-202105_esuite - Evaluation e-suite Page 12 of 64
Copernicus Atmosphere Monitoring Service

1.4 e-suite
The change of the CAMS system to cycle 47R2 is planned to be implemented on 18 May 2021 for
the aerosol and reactive trace gas components.
Details of the upgrade are provided on:
https://confluence.ecmwf.int/display/COPSRV/Implementation+of+IFS+cycle+47r2.
The e-suite data is available from ECMWF MARS under class=mc, expver=0075, and is evaluated
from 5 January 2021, and is compared with the 2021 o-suite described above.
The e-suite control run data is available from ECMWF MARS under class=rd, expver=hig6.

Meteorological content of the new cycle:
The meteorological changes can be found on the ECMWF-IFS CY47R2 page,
https://confluence.ecmwf.int/display/FCST/Implementation+of+IFS+cycle+47R2.

Atmospheric composition content of the new cycle:
Assimilation:
    •   No changes
Observations:
    •   No changes compared to the observations used in 47R1.
Emissions:
    •   Reduced volcanic outgassing of SO2 from certain volcanoes based on recent observations.
    •   Implemented cap on anthropogenic primary organic matter (OM) emissions to reduce
        excesses in highly polluted regions.
    •   Increased numerical precision in prescribed emission fields to remove artefacts.
Other model changes:
    •   Numerical improvements to the aerosol and chemistry schemes to accommodate running
        the forecasts in single precision as noted above.

CAMS84_2018SC3_D3.2.1-202105_esuite - Evaluation e-suite                                   Page 13 of 64
Copernicus Atmosphere Monitoring Service 2. Upgrade evaluation results: e-suite versus o-suite 2.1 Global aerosol evaluation Figure 2.1.1: February 2021 average fields of AOD (upper row), black carbon optical depth (middle row) and dust optical depth (lowest row) for o-suite (left) and e-suite (experiment 0075, right). None of the AOD fields has changed to any notable amount. CAMS84_2018SC3_D3.2.1-202105_esuite - Evaluation e-suite Page 14 of 64
Copernicus Atmosphere Monitoring Service

Figure 2.1.2: February 2021 average fields of nitrate (upper row), organics (middle row) and
sulphate optical depth (lowest row) for o-suite (left) and e-suite (experiment 0075, right).

CAMS84_2018SC3_D3.2.1-202105_esuite - Evaluation e-suite                                  Page 15 of 64
Copernicus Atmosphere Monitoring Service

Figure 2.1.3: February 2021 average fields of sea salt optical depth for o-suite (left) and e-suite
(experiment 0075, right).

Figure 2.1.4: February 2021 evaluation against global Aeronet v3 level1.5 AOD (OD550_AER, upper
row), for o-suite (left) and e-suite (experiment 0075; right) and Angstrøm exponent (ANG4487_AER,
lower row). The scores (bias (NMB+MNMB), RMS, correlation (R), fraction of simulated data within
factor 2 (Fact2)) for AOD and Ångstrøm exponent are almost equal.

CAMS84_2018SC3_D3.2.1-202105_esuite - Evaluation e-suite                                      Page 16 of 64
Copernicus Atmosphere Monitoring Service

Table 2.1.1. Mean global total and speciated AOD and surface PM10 and PM2.5 concentrations [µg
m-3] in the o-suite, o-suite control (CNTRL, experiment HDIR), e-suite (experiment 0075) and e-suite
control (E-CNTRL, experiment HIG6) for the February 2021 period. The right columns show the
relative change between o-suite and e-suite and the respective control simulations.

                           O-SUITE E-SUITE                 CNTRL E-CNTRL E-SUITE/ E-CNTRL/
                                                                          O-SUITE  CNTRL
      AOD@550                 0.160       0.159             0.090  0.090    +0%      +0%
      BC-OD@550               0.0049      0.0045            0.0023 0.0023   -8%      +0%
      Dust-OD@550             0.010       0.010             0.011  0.011    +0%      +0%
      NO3-OD@550              0.0049      0.0048            0.0036 0.0035   -1%      -1%
      OA-OD@550               0.037       0.037             0.019  0.018    +0%      -1%
      SO4-OD@550              0.064       0.063             0.016  0.016    +0%      +0%
      SS-OD@550               0.040       0.040             0.037  0.037    +0%      +0%
      PM2.5                  12.73        12.68              11.63 11.59    +0%      +0%
      PM10                   26.62        26.53              25.11 25.04    +0%      +0%

Table 2.1.2. MNMB and spatial correlation R of AOD and surface PM10 and PM2.5 concentrations
[µg m-3] in the o-suite, o-suite control (CNTRL, experiment HDIR), e-suite (experiment
ECMWF_ESUITE_0075) and e-suite control (E-CNTRL, experiment ECMWF_ESUITE_CNTRL (HIG6) )
for the February 2021 period. The values correspond to figure 2.1.2. Data are collocated on daily
basis before computing the statistics.

           MNMB [%]               O-SUITE             E-SUITE       CNTRL       E-CNTRL
           AOD@550                 +22.8               +22.3         -36.1        -37.1
           ANG4487                 +38.1               +38.3         +23.2       +23.0
           PM2.5                     -4.7                -5.2         -32          -32
           PM10                     -11.8               -12.5        -36.2        -36.5

           R                      O-SUITE             E-SUITE       CNTRL       E-CNTRL
           AOD@550                  0.80                0.80         0.79         0.79
           ANG4487                  0.57                0.57         0.63         0.63
           PM2.5                    0.77                0.75         0.81         0.80
           PM10                     0.71                0.69         0.76         0.75

CAMS84_2018SC3_D3.2.1-202105_esuite - Evaluation e-suite                                   Page 17 of 64
Copernicus Atmosphere Monitoring Service 2.2 Dust and aerosol evaluation over North Africa, the Middle East and Europe Figure 2.2.1. Dust AOD skill scores (correlation coefficient, MB, RMSE and MNMB) for 24-hour forecasts of CAMS o-suite (left column), e-suite (expid 0075, central column) and e-suite control (expid hig6, right column). Dust-filtered AOD at 550 nm from AERONET direct sun Version 3 Level 1.5 is the reference. Scores obtained using 3-hourly pairs for the period 5th January to 22nd March 2021. CAMS84_2018SC3_D3.2.1-202105_esuite - Evaluation e-suite Page 18 of 64
Copernicus Atmosphere Monitoring Service

Figure 2.2.2. Total AOD skill scores (correlation coefficient, MB, RMSE and MNMB) for 24-hour
forecasts of CAMS o-suite (left column), e-suite (expid 0075, central column) and e-suite control
(expid hig6, right column). AOD at 550 nm from AERONET direct sun Version 3 Level 1.5 is the
reference. Scores obtained using 3-hourly pairs for the period 5th January to 22nd March 2021.

CAMS84_2018SC3_D3.2.1-202105_esuite - Evaluation e-suite                                    Page 19 of 64
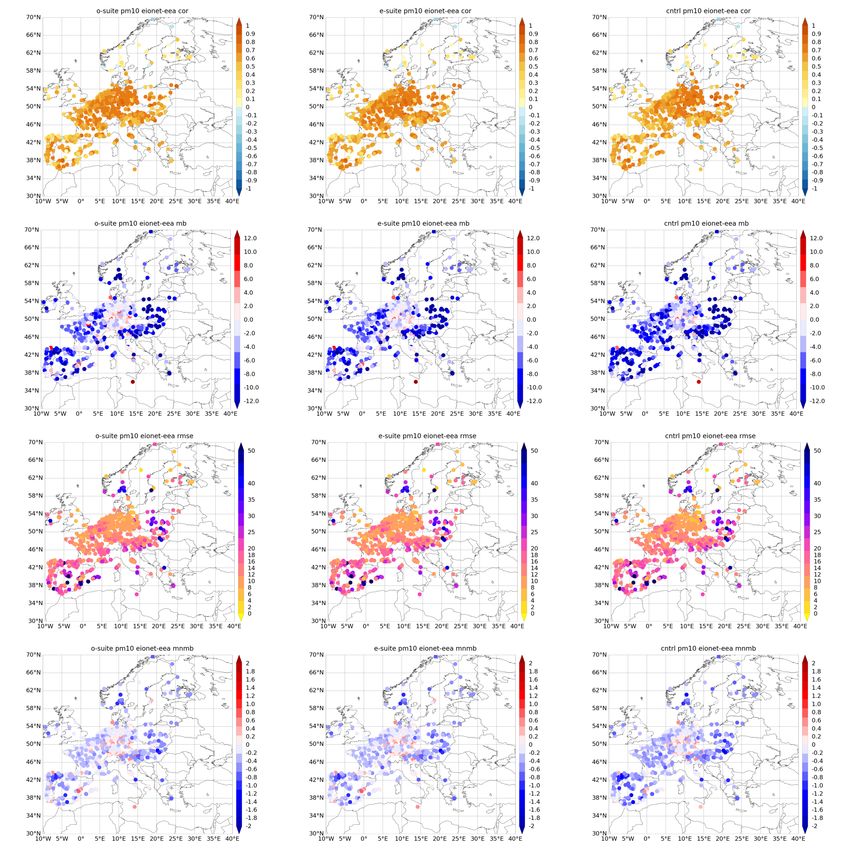
Copernicus Atmosphere Monitoring Service

Figure 2.2.3. PM2.5 skill scores (correlation coefficient, MB, RMSE and MNMB) for 24-hour forecasts
of CAMS o-suite (left column), e-suite (expid 0075, central column) and e-suite control (expid hig6,
right column) for the study period. PM2.5 from EEA-EIONET NRT dataset is the reference. Scores
obtained using 3-hourly pairs for the period 5th January to 22nd March 2021.

CAMS84_2018SC3_D3.2.1-202105_esuite - Evaluation e-suite                                  Page 20 of 64
Copernicus Atmosphere Monitoring Service

Figure 2.2.3. PM10 skill scores (correlation coefficient, MB, RMSE and MNMB) for 24-hour forecasts
of CAMS o-suite (left column), e-suite (expid 0075, central column) and e-suite control (expid hig6,
right column) for the study period. PM2.5 from EEA-EIONET NRT dataset is the reference. Scores
obtained using 3-hourly pairs for the period 5th January to 22nd March 2021.

CAMS84_2018SC3_D3.2.1-202105_esuite - Evaluation e-suite                                   Page 21 of 64
Copernicus Atmosphere Monitoring Service

2.3 Verification with ESRL-GMD surface ozone observations

Fig. 2.3.1. Comparisons with ESRL surface observations: Bias (MNMB, left) and correlation coefficient
(right) of o-suite (red, solid), e-suite (red, dashed) and control (blue, solid) and e-control (blue,
dashed) for the period 4 January 2021 -31 March 2021. Overall e-suite and o-suite behave similarly.

CAMS84_2018SC3_D3.2.1-202105_esuite - Evaluation e-suite                                  Page 22 of 64
Copernicus Atmosphere Monitoring Service

Fig. 2.3.2. Two examples of comparisons with NOAA ESRL surface observations: Time series for the
USA Table Mountain ESRL station and the tropical Mauna Loa station. Red: o-suite; red-dash: e-
suite; blue: o-suite control run; blue-dash: e-suite control run. Overall e-suite and o-suite behave very
similar and can hardly be distinguishes.

CAMS84_2018SC3_D3.2.1-202105_esuite - Evaluation e-suite                                      Page 23 of 64
Copernicus Atmosphere Monitoring Service

2.4 Verification of surface ozone in Europe

Fig. 2.4.1. Comparisons with Airbase surface ozone. Spatial distribution of e-suite modified
normalised mean bias (MNMB) in % (left) and the difference between e-suite and o-suite MNMB
(right), during the period: 4 January-31 March 2021 (1st row). The e-suite reduces somewhat the
positive offset observed in the o-suite over central European stations. Spatial distribution of e-suite
correlation coefficient [r] (left) and the difference between e-suite and o-suite explained variance [%]
(right) data during the periods: 4 January-31 March 2021 (2nd row). Over most stations there are no
significant changes between e-suite and o-suite in terms of correlations between modelled and
observed values.

Fig. 2.4.2. As 2.4.3, but for the control runs. There are no significant changes between e-control run
and control run in terms of both MNMBs and correlations between modelled and observed values.

CAMS84_2018SC3_D3.2.1-202105_esuite - Evaluation e-suite                                     Page 24 of 64
Copernicus Atmosphere Monitoring Service

2.5 Verification with IAGOS ozone observations

Figure 2.5.1: Time series of the bias (relative differences) in the daily profiles of ozone at Frankfurt
between 5 January and 31 March 2021, for the analysis from the e-suite on the top panel and the
analysis from the o-suite on the bottom panel.

CAMS84_2018SC3_D3.2.1-202105_esuite - Evaluation e-suite                                        Page 25 of 64
Copernicus Atmosphere Monitoring Service

Figure 2.5.2: Time series of the bias (relative differences) in the daily profiles of ozone at Frankfurt
between 5 January and 31 March 2021, for the one day forecast from the e-suite on the top panel
and the one day forecast from the o-suite on the bottom panel.

CAMS84_2018SC3_D3.2.1-202105_esuite - Evaluation e-suite                                        Page 26 of 64
Copernicus Atmosphere Monitoring Service

Figure 2.5.3: Time series of monthly MNMB from e-suite analysis (light red, empty circles) and o-
suite analysis (dark red, filled circle) for free tropospheric ozone between 5 January and 31 March
2021 in 7 regions (Top left: Europe (only Frankfurt airport), second row right: North America, second
row left: Eastern Asia, middle right: India, third row left: Western Africa, third row right: South
Africa, bottom left: Middle East). The histogram bars indicate the number of profiles (i.e. layer
values) based on available observations.

CAMS84_2018SC3_D3.2.1-202105_esuite - Evaluation e-suite                                   Page 27 of 64
Copernicus Atmosphere Monitoring Service

Figure 2.5.4: Time series of monthly MNMB from e-suite analysis (light red, empty circles) and o-
suite analysis (dark red, filled circle) for surface ozone between 5 January and 31 March 2021 in 7
regions (Top left: Europe (only Frankfurt airport), second row right: North America, second row left:
Eastern Asia, middle right: India, third row left: Western Africa, third row right: South Africa, bottom
left: Middle East). The histogram bars indicate the number of profiles (i.e., layer values) based on the
available observations.

CAMS84_2018SC3_D3.2.1-202105_esuite - Evaluation e-suite                                     Page 28 of 64
Copernicus Atmosphere Monitoring Service

Figure 2.5.5: Global maps of gridded averages (5°x5°) for ozone comparison with IAGOS cruise data
for the period 5 January – 31 March 2021. From left to right, first row: IAGOS ozone (in ppbv) and air
pressure (in hPa). Second row: ozone from the analysis of the CAMS e-suite (in ppbv) and associated
relative differences (in %) with respect to IAGOS. Third, fourth and fifth rows: same as second row
for the o-suite analysis, e-suite one day forecast, and o-suite one day forecast respectively.

CAMS84_2018SC3_D3.2.1-202105_esuite - Evaluation e-suite                                    Page 29 of 64
Copernicus Atmosphere Monitoring Service

Figure. 2.5.5: Continued.

CAMS84_2018SC3_D3.2.1-202105_esuite - Evaluation e-suite   Page 30 of 64
Copernicus Atmosphere Monitoring Service

2.6 Verification with ozone surface data in the Arctic

Fig. 2.6.1: Surface ozone mixing ratios at Svalbard (top), and the Villum Research Station (Bottom)
from January – March 2021 for the o-suite (red), for the e-suite (blue) and for the e-suite control
(magenta). The measured concentrations in March are dominated by ozone depletion events that
arise due to halogen chemistry, which is not represented by the CAMS model. Apart from this the
models predict the measured levels very well and the differences are small. The bias is slightly lower
for the e-suite.

CAMS84_2018SC3_D3.2.1-202105_esuite - Evaluation e-suite                                    Page 31 of 64
Copernicus Atmosphere Monitoring Service

2.7 Ozone validation with IASI satellite observations

Fig. 2.7.1: IASI Metop-B O3 total column (daytime), in Dobson units (DU), as a function of latitude
and time (top) for January-February 2021. Relative difference (in %) with CAMS o-suite (left), with e-
suite (middle) and with the control run (right side).

CAMS84_2018SC3_D3.2.1-202105_esuite - Evaluation e-suite                                    Page 32 of 64
Copernicus Atmosphere Monitoring Service

Fig. 2.7.2: Map of IASI METOP-B O3 total column (DU) for January and February 2021 and relative
difference (in %) with CAMS e-suite (left side), with control hig6 (middle) and with o-suite (right
side). The configurations are in good agreement with the observations. The e-suite shows small
improvements compared to o-suite configuration, which is reflected in the regional and temporal
bias reduction.

CAMS84_2018SC3_D3.2.1-202105_esuite - Evaluation e-suite                                   Page 33 of 64
Copernicus Atmosphere Monitoring Service

2.8 CO validation with European Airbase Surface Observations

Fig. 2.8.1. Comparisons with Airbase surface carbon monoxide. Spatial distribution of e-suite
modified normalised mean bias (MNMB) in % (left) and the difference between e-suite and o-suite
MNMB (right), during the period: 4 January-31 March 2021 (1st row). The e-suite reduces the
positive offset observed in the o-suite over central European stations. Spatial distribution of e-suite
correlation coefficient [r] (left) and the difference between e-suite and o-suite explained variance [%]
(right) data during the periods: 4 January-31 March 2021 (2nd row). There are no significant
changes between e-suite and o-suite in terms of both MNMBs and corelations between modelled
and observed values.

CAMS84_2018SC3_D3.2.1-202105_esuite - Evaluation e-suite                                     Page 34 of 64
Copernicus Atmosphere Monitoring Service

Fig. 2.8.2. Same as 2.8.1, but for the control runs. There are no significant changes between e-
control and control in terms of both MNMBs and corelations between modelled and observed
values.

CAMS84_2018SC3_D3.2.1-202105_esuite - Evaluation e-suite                                    Page 35 of 64
Copernicus Atmosphere Monitoring Service

2.9 CO validation with IAGOS Aircraft observations

Figure 2.9.1: Time series of the bias (relative differences) in the daily profiles of CO at Frankfurt
between 5 January and 31 March 2021, for the analysis from the e-suite on the top panel and the
analysis from the o-suite on the bottom panel.

CAMS84_2018SC3_D3.2.1-202105_esuite - Evaluation e-suite                                      Page 36 of 64
Copernicus Atmosphere Monitoring Service

Figure 2.9.2: Time series of the bias (relative differences) in the daily profiles of CO at Frankfurt
between 5 January and 31 March 2021, for the one day forecast from the e-suite on the top panel
and the one day forecast from the o-suite on the bottom panel.

CAMS84_2018SC3_D3.2.1-202105_esuite - Evaluation e-suite                                     Page 37 of 64
Copernicus Atmosphere Monitoring Service

Figure 2.9.3: Time series of monthly MNMB from e-suite analysis (light red, empty circles) and o-
suite analysis (dark red, filled circle) for free tropospheric CO between 5 January and 31 March 2021
in 6 regions (Top left: Europe (only Frankfurt airport), top right: North America, middle left: Eastern
Asia, middle right: India, bottom left: Western Africa, bottom right: South Africa). The histogram
bars indicate the number of profiles (i.e., layer values) based on available observations.

CAMS84_2018SC3_D3.2.1-202105_esuite - Evaluation e-suite                                     Page 38 of 64
Copernicus Atmosphere Monitoring Service

Figure 2.9.4: Time series of monthly MNMB from e-suite analysis (light red, empty circles) and o-
suite analysis (dark red, filled circle) for surface CO between 5 January and 31 March 2021 in 6
regions (Top left: Europe (only Frankfurt airport), top right: North America, middle left: Eastern Asia,
middle right: India, bottom left: Western Africa, bottom right: South Africa). The histogram bars
indicate the number of profiles (i.e., layer values) based on available observations.

CAMS84_2018SC3_D3.2.1-202105_esuite - Evaluation e-suite                                      Page 39 of 64
Copernicus Atmosphere Monitoring Service

Figure 2.9.5: Global maps of gridded averages (5°x5°) for the CO comparisons with IAGOS cruise
data for the period 5 January – 31 March 2021. From left to right, first row: IAGOS CO (in ppbv) and
air pressure (in hPa). Second row: CO from the analysis of the CAMS e-suite (in ppbv) and associated
relative differences (in %) with respect to IAGOS. Third, fourth and fifth rows: same as second row
for the o-suite analysis, e-suite one-day forecast and o-suite one-day forecast respectively.

CAMS84_2018SC3_D3.2.1-202105_esuite - Evaluation e-suite                                  Page 40 of 64
Copernicus Atmosphere Monitoring Service

Figure 2.9.5: Continued.

CAMS84_2018SC3_D3.2.1-202105_esuite - Evaluation e-suite   Page 41 of 64
Copernicus Atmosphere Monitoring Service

2.10 Comparisons with MOPITTv8 and IASI CO data

Fig. 2.10.1: MOPITT V8 CO total column as a function of latitude and time (top), for January-February 2021
(top). Relative difference (in %) with the CAMS o-suite (left), with the e-suite (middle) and with e-suite control
run (right). The e-suite shows improvements compared to the o-suite, reflecting in the slightly smaller
negative bias, especially over the Southern Hemisphere.

CAMS84_2018SC3_D3.2.1-202105_esuite - Evaluation e-suite                                               Page 42 of 64
Copernicus Atmosphere Monitoring Service

Fig. 2.10.2: Map of MOPITT v8 CO total column for January and February 2021 (top row) and relative
difference (in %) with CAMS o-suite (left side), with the e-suite (middle) and with the e-suite control run
(right). The e-suite shows small improvements compared to o-suite, reflecting in the slightly smaller negative
bias, especially over the Southern Hemisphere.

CAMS84_2018SC3_D3.2.1-202105_esuite - Evaluation e-suite                                            Page 43 of 64
Copernicus Atmosphere Monitoring Service

Fig. 2.10.3: Time series of CO total columns for MOPITT V8, IASI and the model runs over the selected
regions: e-suite (red, solid), control (blue, solid) o-suite (green, solid). Period: January-February 2021.
The e-suite is almost equal to the o-suite over all selected regions. Both model runs are in relatively
good agreement with the MOPITT observations, showing slight underestimation over all regions,
except East Asia and South Africa where the model runs are very close to the observations. The
control run shows higher negative bias compared to e-suite and o-suite.

CAMS84_2018SC3_D3.2.1-202105_esuite - Evaluation e-suite                                        Page 44 of 64
Copernicus Atmosphere Monitoring Service

2.11 CO validation with NDACC and TCCON surface remote-sensing observations

To understand the NDACC and TCCON results, it is important to mention that there is an overall bias
between NDACC and TCCON of approximately 6%, where TCCON is biased low compared to NDACC.

Fig. 2.11.1. Comparison of the e-suite 47R2 (light blue) and o-suite (red) CO total column comparison
against NDACC FTIR observations. Overall, the bias of the e-suite analysis, 1day forecast and control
run is similar as the o-suite.

Fig. 2.11.2. The e-suite 47R2 (bottom) and o-suite (top) 1d forecast CO tropospheric (left) and
stratospheric (right) partial column comparison against NDACC FTIR. Weekly biases of the e-suite
and o-suite are nearly identical.

CAMS84_2018SC3_D3.2.1-202105_esuite - Evaluation e-suite                                   Page 45 of 64
Copernicus Atmosphere Monitoring Service

2.12 Tropospheric nitrogen dioxide comparisons with TROPOMI

Figure 2.12.1: Time series of average tropospheric NO2 columns [1015 molec cm-2] from satellite
retrievals and model simulations over selected regions for Jan-Mar 2021: TROPOMI IUP-Bremen
product (black); TROPOMI operational offline product (grey); e-suite (orange); e-suite control (blue);
o-suite (red). The satellite data were gridded to the model resolution (i.e. 0.4° x 0.4° degree) and the
CAMS o-suite simulations were used as a-priori in the TROPOMI IUP-Bremen retrievals only. The
model simulations were interpolated to the satellite orbit.

CAMS84_2018SC3_D3.2.1-202105_esuite - Evaluation e-suite                                      Page 46 of 64
Copernicus Atmosphere Monitoring Service

Figure 2.12.2: Global map comparisons of satellite-retrieved and model-simulated tropospheric NO2
columns [molecules cm-2] for March 2021 for (first row) e-suite and e-suite control compared to
TROPOMI IUP-UB, (second row) e-suite and e-suite control compared to TROPOMI operational
offline, (third row) o-suite and control compared to TROPOMI IUP-UB and (fourth row) o-suite and
control compared to TROPOMI operational offline. The satellite data were gridded to model
resolution (0.4° x 0.4° degree) and CAMS o-suite simulations were used as a-priori in the TROPOMI
IUP-Bremen retrievals only. The model simulations were interpolated to the satellite orbit. Note that
the free tropospheric contribution is not yet well accounted for in the stratospheric correction
method used for the TROPOMI IUP-UB product, which leads to a negative offset in this preliminary
data version and will be improved by addition of tropospheric background values in the near future.

CAMS84_2018SC3_D3.2.1-202105_esuite - Evaluation e-suite                                   Page 47 of 64
Copernicus Atmosphere Monitoring Service

2.13 Tropospheric nitrogen dioxide comparisons with MAXDOAS

Fig. 2.13.1.: The e-suite 47R2 and o-suite 47R1 (red) tropospheric NO2 column comparison against
NDACC UVVIS DOAS OFFAXIS at Cabauw. At Cabauw the overall bias for the e-suite 47R2 is very
comparable to the o-suite. Similar results are obtained for the 1day forecast comparison and for the
control runs.

CAMS84_2018SC3_D3.2.1-202105_esuite - Evaluation e-suite                                  Page 48 of 64
Copernicus Atmosphere Monitoring Service

2.14 Formaldehyde (HCHO)

Figure 2.14.1: Time series of average tropospheric HCHO columns [1016 molec cm-2] from satellite
retrievals and model simulations over selected regions for Jan-Mar 2021: (black) TROPOMI IUP-
Bremen product, (grey) TROPOMI operational offline product, (orange) e-suite, (blue) e-suite control,
(red) o-suite. The regions differ from those used for NO2 to better focus on HCHO hotspots: East-Asia
(25-40°N, 110-125°E), Eastern US (30-40°N, 75-90°W), Northern Africa (0-15°N, 15°W-25°E) and
Indonesia (5°S-5°N, 100-120°E). The satellite data were gridded to model resolution (i.e. 0.4° x 0.4°
degree) and CAMS o-suite simulations were used as a-priori in the TROPOMI IUP-Bremen retrievals
only. The model simulations were interpolated to the satellite orbit.

CAMS84_2018SC3_D3.2.1-202105_esuite - Evaluation e-suite                                  Page 49 of 64
Copernicus Atmosphere Monitoring Service

Figure 2.14.2: Monthly mean tropospheric HCHO columns [molec cm-2] for March 2021 for (first row)
e-suite compared to TROPOMI IUP-UB, (second row) e-suite minus TROPOMI difference and e-suite
control, (third and fourth row) o-suite and o-suite control compared to TROPOMI IUP-UB. The
satellite data were gridded to model resolution (0.4° x 0.4° degree) and CAMS o-suite simulations
were used as a-priori in the TROPOMI IUP-Bremen retrievals. The model simulations were
interpolated to the satellite orbit.

CAMS84_2018SC3_D3.2.1-202105_esuite - Evaluation e-suite                               Page 50 of 64
Copernicus Atmosphere Monitoring Service

Fig. 2.14.3. A comparison of the overall bias against UV-VIS MAXDOAS HCHO observations shows no
significant changes in the e-suite run compared to the o-suite. The time series at Xianghe is limited.

CAMS84_2018SC3_D3.2.1-202105_esuite - Evaluation e-suite                                    Page 51 of 64
Copernicus Atmosphere Monitoring Service

2.15 Stratospheric ozone: Comparison with satellite observations

Fig. 2.15.1: Comparisons between Aura-MLS v4.2 and analyses from the o-suite and Cy47r2 (e-suite)
for the period Jan 10-Apr 10, 2021. Top figures show the mean profiles in five latitude bands from
South (left) to North (right) polar regions. Bottom figures show the normalized mean bias (NMB i.e.
Mean(Model-Observations)/Mean(Observations), solid lines referring to the bottom x-axis), the
associated normalized standard deviation (NSD i.e. STD_DEV(Model-
Observations)/Mean(Observations), envelopes around the NMB line referring to the bottom x-axis)
and the correlation between model and observations (dashed lines referring to the top x-axis).

Fig. 2.15.2: As Fig. 2.15.1 but for comparisons against OMPS-LP v2.5.

CAMS84_2018SC3_D3.2.1-202105_esuite - Evaluation e-suite                                 Page 52 of 64
Copernicus Atmosphere Monitoring Service

Fig. 2.15.3: (Top row) Daily mean bias between Aura MLS v4.2 and model outputs from the osuite
and Cy47r2 (esuite) between 1 and 3 hPa and in three latitude bands (from left to right 90°S-60°S,
30°S-30°N and 60°N-90°N). Osuite model data are the analysis (solid red lines), the 5 day forecast
(dashed red lines) and the control run (red dots). Similar values are shown for Cy47r2 in blue.
(Bottow row) Standard deviation associated to the daily mean bias shown in the top row.

Fig. 2.15.4: As Fig. 2.15.3 but between 3 and 10 hPa.

CAMS84_2018SC3_D3.2.1-202105_esuite - Evaluation e-suite                                   Page 53 of 64
Copernicus Atmosphere Monitoring Service

Fig. 2.15.5: As Fig. 2.15.3 but between 10 and 30 hPa.

Fig. 2.15.6: As Fig. 2.15.3 but between 30 and 70 hPa.

CAMS84_2018SC3_D3.2.1-202105_esuite - Evaluation e-suite   Page 54 of 64
Copernicus Atmosphere Monitoring Service

Fig. 2.15.7: As Fig. 2.15.3 but between 70 and 100 hPa.

CAMS84_2018SC3_D3.2.1-202105_esuite - Evaluation e-suite   Page 55 of 64
Copernicus Atmosphere Monitoring Service

2.16 Stratospheric ozone: Comparison with NDACC observations

Fig. 2.16.1. Ozone LIDAR profile differences for the o-suite (left) and e-suite 47R2 (right). The top row
shows the analysis at Haute Provence, the bottom row the 5d forecast at Hohenpeissenberg. Both
runs perform equally well.

Fig. 2.16.2. O-suite and e-suite 47R2 overall stratospheric column biases against NDACC UVVIS
ZENITH observations for both the analysis and the 5d forecast. Only minor changes in performance
are observed.

CAMS84_2018SC3_D3.2.1-202105_esuite - Evaluation e-suite                                      Page 56 of 64
Copernicus Atmosphere Monitoring Service

3. References
Albert, M. F. M. A., Anguelova, M. D., Manders, A. M. M., Schaap, M., and de Leeuw, G.: Parameterization of
oceanic whitecap fraction based on satellite observations, Atmos. Chem. Phys., 16, 13725–13751,
https://doi.org/10.5194/acp-16-13725-2016, 2016.
Agusti-Panareda, A., Monitoring upgrades of analysis/forecast system, MACC-III Deliverable D44.04, June
2015.
Basart, S, A. Benedictow, Y. Bennouna, A.-M. Blechschmidt, S. Chabrillat, Y. Christophe, E. Cuevas, H. J. Eskes,
K. M. Hansen, O. Jorba, J. Kapsomenakis, B. Langerock, T. Pay, A. Richter, N. Sudarchikova, M. Schulz, A.
Wagner, C. Zerefos, Upgrade verification note for the CAMS real-time global atmospheric composition
service: Evaluation of the e- suite for the CAMS upgrade of July 2019, Copernicus Atmosphere Monitoring
Service (CAMS) report, CAMS84_2018SC1_D3.2.1-201907_esuite_v1.pdf, July 2019, doi:10.24380/fcwq-yp50.
Benedetti, A., J.-J. Morcrette, O. Boucher, A. Dethof, R. J. Engelen, M. Fisher, H. Flentjes, N. Huneeus, L. Jones,
J. W. Kaiser, S. Kinne, A. Mangold, M. Razinger, A. J. Simmons, M. Suttie, and the GEMS-AER team: Aerosol
analysis and forecast in the ECMWF Integrated Forecast System. Part II : Data assimilation, J. Geophys. Res.,
114, D13205, doi:10.1029/2008JD011115, 2009.
Bergamaschi, P., Frankenberg, C., Meirink, J. F., Krol, M., Villani, M. G., Houweling, S., Dentener, F.,
Dlugokencky, E. J., Miller, J. B., Gatti, L. V., Engel, A., and Levin, I.: Inverse modeling of global and
regional CH4 emissions using SCIAMACHY satellite retrievals, J. Geophys. Res., 114, D22301,
doi:10.1029/2009JD012287, 2009.
Boussetta, S., Balsamo, G., Beljaars, A., Agusti-Panareda, A., Calvet, J.-C., Jacobs, C., van den Hurk, B.,
Viterbo, P., Lafont, S., Dutra, E., Jarlan, L., Balzarolo, M., Papale, D., and van der Werf, G.:
Natural carbon dioxide exchanges in the ECMWF Integrated Forecasting System: implementation and
offline validation, J. Geophys. Res.-Atmos., 118, 1–24, doi: 10.1002/jgrd.50488, 2013.
Cariolle, D. and Teyssèdre, H.: A revised linear ozone photochemistry parameterization for use in transport
and general circulation models: multi-annual simulations, Atmos. Chem. Phys., 7, 2183-2196,
doi:10.5194/acp-7-2183-2007, 2007.
Carn, S. A., V. E. Fioletov, C. A. McLinden, C. Li & N. A. Krotkov, A decade of global volcanic SO2 emissions
measured from space, Scientific Reports volume 7, Article number: 44095 (2017).
Dee, D. P. and S. Uppala, Variational bias correction of satellite radiance data in the ERA-Interim reanalysis.
Quart. J. Roy. Meteor. Soc.,135, 1830-1841, 2009.
Eskes, H., Huijnen, V., Arola, A., Benedictow, A., Blechschmidt, A.-M., Botek, E., Boucher, O., Bouarar, I.,
Chabrillat, S., Cuevas, E., Engelen, R., Flentje, H., Gaudel, A., Griesfeller, J., Jones, L., Kapsomenakis, J.,
Katragkou, E., Kinne, S., Langerock, B., Razinger, M., Richter, A., Schultz, M., Schulz, M., Sudarchikova, N.,
Thouret, V., Vrekoussis, M., Wagner, A., and Zerefos, C.: Validation of reactive gases and aerosols in the
MACC global analysis and forecast system, Geosci. Model Dev., 8, 3523-3543, doi:10.5194/gmd-8-3523-2015,
2015.
Eskes, H.J., S. Basart, A. Benedictow, Y. Bennouna, A.-M. Blechschmidt, S. Chabrillat, Y. Christophe, E. Cuevas,
H. Flentje, K. M. Hansen, J. Kapsomenakis, B. Langerock, M. Ramonet, A. Richter, M. Schulz, N. Sudarchikova,
A. Wagner, T. Warneke, C. Zerefos, Observation characterisation and validation methods document,
Copernicus Atmosphere Monitoring Service (CAMS) report,
CAMS84_2018SC2_D6.1.1-2020_observations_v5.pdf, January 2021. Available from:
http://atmosphere.copernicus.eu/user-support/validation/verification-global-services

CAMS84_2018SC3_D3.2.1-202105_esuite - Evaluation e-suite                                                Page 57 of 64
Copernicus Atmosphere Monitoring Service

Eskes, H. J., S. Basart, A. Benedictow, Y. Bennouna, A.-M. Blechschmidt, S. Chabrillat, Y. Christophe, K. M.
Hansen, J. Kapsomenakis, B. Langerock, M. Pitkänen, M. Ramonet, A. Richter, N. Sudarchikova, M. Schulz, A.
Wagner, T. Warneke (UBC), C. Zerefos, Upgrade verification note for the CAMS near-real time global
atmospheric composition service: Evaluation of the e-suite for the CAMS 47R1 upgrade of October 2020,
Copernicus Atmosphere Monitoring Service (CAMS) report, CAMS84_2018SC2_D3.2.1- 202009_esuite.pdf, 2
October 2020, doi:10.24380/fzdx-j890.
Flemming, J., Huijnen, V., Arteta, J., Bechtold, P., Beljaars, A., Blechschmidt, A.-M., Diamantakis, M., Engelen,
R. J., Gaudel, A., Inness, A., Jones, L., Josse, B., Katragkou, E., Marecal, V., Peuch, V.-H., Richter, A., Schultz, M.
G., Stein, O., and Tsikerdekis, A.: Tropospheric chemistry in the Integrated Forecasting System of ECMWF,
Geosci. Model Dev., 8, 975-1003, doi:10.5194/gmd-8-975-2015, 2015.
Flemming, J., Benedetti, A., Inness, A., Engelen, R. J., Jones, L., Huijnen, V., Remy, S., Parrington, M., Suttie,
M., Bozzo, A., Peuch, V.-H., Akritidis, D., and Katragkou, E.: The CAMS interim Reanalysis of Carbon Monoxide,
Ozone and Aerosol for 2003–2015, Atmos. Chem. Phys., 17, 1945-1983, doi:10.5194/acp-17-1945-2017, 2017.
Granier, C. et al.: Evolution of anthropogenic and biomass burning emissions of air pollutants at global and
regional scales during the 1980–2010 period. Climatic Change (109), 2011
Huijnen, V., et al.: The global chemistry transport model TM5: description and evaluation of the tropospheric
chemistry version 3.0, Geosci. Model Dev., 3, 445-473, doi:10.5194/gmd-3-445-2010, 2010.
Inness, A., Blechschmidt, A.-M., Bouarar, I., Chabrillat, S., Crepulja, M., Engelen, R. J., Eskes, H., Flemming, J.,
Gaudel, A., Hendrick, F., Huijnen, V., Jones, L., Kapsomenakis, J., Katragkou, E., Keppens, A., Langerock, B., de
Mazière, M., Melas, D., Parrington, M., Peuch, V. H., Razinger, M., Richter, A., Schultz, M. G., Suttie, M.,
Thouret, V., Vrekoussis, M., Wagner, A., and Zerefos, C.: Data assimilation of satellite-retrieved ozone, carbon
monoxide and nitrogen dioxide with ECMWF's Composition-IFS, Atmos. Chem. Phys., 15, 5275-5303,
doi:10.5194/acp-15-5275-2015, 2015.
Janssens-Maenhout, G., Dentener, F., Aardenne, J. V., Monni, S., Pagliari, V., Orlandini, L., Klimont, Z.,
Kurokawa, J., Akimoto, H., Ohara, T., Wankmueller, R., Battye, B., Grano, D., Zuber, A., and Keating, T.:
EDGAR-HTAP: a Harmonized Gridded Air Pollution Emission Dataset Based on National Inventories, JRC68434,
EUR report No EUR 25 299–2012, ISBN 978-92-79- 23122-0, ISSN 1831-9424, European Commission
Publications Office, Ispra (Italy), 2012.
Kaiser, J. W., Heil, A., Andreae, M. O., Benedetti, A., Chubarova, N., Jones, L., Morcrette, J.-J., Razinger, M.,
Schultz, M. G., Suttie, M., and van der Werf, G. R.: Biomass burning emissions estimated with a global fire
assimilation system based on observed fire radiative power, Biogeosciences, 9, 527-554, doi:10.5194/bg-9-
527-2012, 2012.
Massart, S., Flemming, J., Cariolle, D., Jones, L., High resolution CO tracer forecasts, MACC-III Deliverable
D22.04, May 2015, available from http://www.gmes-atmosphere.eu/documents/macciii/deliverables/grg
Morcrette, J.-J., O. Boucher, L. Jones, D. Salmond, P. Bechtold, A. Beljaars, A. Benedetti, A. Bonet, J. W. Kaiser,
M. Razinger, M. Schulz, S. Serrar, A. J. Simmons, M. Sofiev, M. Suttie, A. M. Tompkins, and A. Untch: Aerosol
analysis and forecast in the ECMWF Integrated Forecast System. Part I: Forward modelling, J. Geophys. Res.,
114, D06206, doi:10.1029/2008JD011235, 2009.
Rémy, S., Kipling, Z., Flemming, J., Boucher, O., Nabat, P., Michou, M., Bozzo, A., Ades, M., Huijnen, V.,
Benedetti, A., Engelen, R., Peuch, V.-H., and Morcrette, J.-J.: Description and evaluation of the tropospheric
aerosol scheme in the European Centre for Medium-Range Weather Forecasts (ECMWF) Integrated
Forecasting System (IFS-AER, cycle 45R1), Geosci. Model Dev., 12, 4627–4659, https://doi.org/10.5194/gmd-
12-4627-2019, 2019.

CAMS84_2018SC3_D3.2.1-202105_esuite - Evaluation e-suite                                                   Page 58 of 64
You can also read


