Using avalanche problems to examine the effect of large-scale atmosphere-ocean oscillations on avalanche hazard in western Canada
←
→
Page content transcription
If your browser does not render page correctly, please read the page content below

The Cryosphere, 15, 1567–1586, 2021
https://doi.org/10.5194/tc-15-1567-2021
© Author(s) 2021. This work is distributed under
the Creative Commons Attribution 4.0 License.

Using avalanche problems to examine the effect of large-scale
atmosphere–ocean oscillations on avalanche hazard in western
Canada
Pascal Haegeli1 , Bret Shandro1,2 , and Patrick Mair3
1 School for Resource and Environmental Management, Simon Fraser University, Burnaby, V5T 2P9, Canada
26 Point Engineering and Avalanche Consulting, Nelson, V1L 4H5, Canada
3 Dept. Psychology, Harvard University, Cambridge, MA 02138, USA

Correspondence: Pascal Haegeli (pascal_haegeli@sfu.ca)

Received: 31 May 2020 – Discussion started: 24 June 2020
Revised: 24 January 2021 – Accepted: 17 February 2021 – Published: 29 March 2021

Abstract. Numerous large-scale atmosphere–ocean oscilla-         add considerable value for these types of analyses. Since the
tions including the El Niño–Southern Oscillation (ENSO),         predictability of the most important atmosphere–ocean os-
the Pacific Decadal Oscillation (PDO), the Pacific North         cillations is continuously improving, a better understanding
American Teleconnection Pattern (PNA), and the Arctic            of their effect on avalanche hazard can contribute to the de-
Oscillation (AO) are known to substantially affect winter        velopment of informative seasonal avalanche forecasts in a
weather patterns in western Canada. Several studies have         relatively simple way.
examined the effect of these oscillations on avalanche haz-
ard using long-term avalanche activity records from high-
way avalanche safety programmes. We present a new ap-
proach for gaining additional insight into these relationships
that uses avalanche problem information published in public      1   Introduction
avalanche bulletins during the winters of 2010 to 2019. For
each avalanche problem type, we calculate seasonal preva-        Snow avalanches are an inherent natural hazard in moun-
lence values for each forecast area, elevation band, and sea-    tainous regions that receive substantial amounts of sea-
son, which are then included in a series of beta mixed-effects   sonal snow. In these regions, snow avalanches can threaten
regression models to explore both the overall and regional       communities, transportation corridors, critical infrastructure
effects of the Pacific-centered oscillations (POs; including     (e.g., hydroelectric dams, transmission and communication
ENSO, PDO, and PNA) and AO on the nature of avalanche            lines, pipelines), and resource extraction operations. In West-
hazard in the study area. We find significant negative effects   ern countries, most people killed in avalanches are recre-
of PO on the prevalence of storm slab avalanche problems,        ationists pursuing winter mountain activities such as back-
wind slab avalanche problems, and dry loose avalanche prob-      country skiing, mountain snowmobile riding, and out-of-
lems, which agree reasonably well with the known impacts of      bounds skiing. Avalanche hazard conditions continuously
PO on winter weather in western Canada. The analysis also        evolve in response to the weather conditions experienced
reveals a positive relationship between AO and the preva-        during a winter. Much of existing avalanche research is
lence of deep persistent slab avalanche problems, particularly   focused on examining the short-term effects of weather
in the Rocky Mountains. In addition, we find several smaller-    on avalanche conditions to support operational avalanche
scale patterns that highlight that the avalanche hazard re-      forecasting. However, examining the relationship between
sponse to these oscillations varies regionally. Even though      longer-term variations in weather patterns and the nature of
our study period is short, our study shows that the forecaster   avalanche hazard can also offer valuable insight that can lead
judgement included in avalanche problem assessments can          to the development of seasonal avalanche hazard forecasts

Published by Copernicus Publications on behalf of the European Geosciences Union.
1568                            P. Haegeli et al.: Effect of large-scale atmosphere–ocean oscillations on avalanche hazard

(McClung, 2013) and contribute to our understanding of the        advantage of the avalanche problem information included in
effect of climate change on avalanche hazard.                     public avalanche bulletins that follow the conceptual model
   The winter weather in western Canada is affected by            of avalanche hazard (Statham et al., 2018a). This approach
several prominent large-scale atmosphere–ocean oscillations       links the analysis more closely to backcountry avalanche
including the El Niño–Southern Oscillation, the Pacific           risk management and overcomes some of the shortcomings
Decadal Oscillation, the Pacific North American Telecon-          of previous studies. Even though linking avalanche hazard
nection Pattern, and the Arctic Oscillation. Since the effects    conditions to large-scale atmosphere–ocean oscillations is
of these large-scale atmosphere–ocean oscillations on win-        unable to provide direct insight for operational, day-to-day
ter temperature and precipitation patterns in the region are      avalanche safety decisions, a better understanding of these
well understood (e.g., Shabbar and Bonsal, 2004; Stahl et         relationships has the potential to allow the avalanche safety
al., 2006; Fleming and Whitfield, 2010), it is no surprise        community to take advantage of atmosphere–ocean oscilla-
that numerous studies have examined the effect of these           tion predictions that are routinely provided by meteorologi-
weather patterns on the seasonal avalanche hazard condi-          cal services to produce informative seasonal avalanche haz-
tions in the area. Fitzharris (1987) was the first in Canada to   ard forecasts. Being able to predict the general nature of sea-
consider anomalies in atmospheric circulation patterns to ex-     sonal avalanche conditions (e.g., there is a good chance that
plain major avalanche winters in Rogers Pass, BC. McClung         this winter will be dominated by a deep persistent avalanche
(2013) found significant correlations between avalanche ac-       problem) would help avalanche professionals and recreation-
tivity (overall, as well as dry-snow and wet-snow avalanches      ists to develop meaningful risk management expectations for
separately) and positive El Niño–Southern Oscillation phase       an upcoming season. As pointed out by LaChapelle (1980)
winters at Bear Pass and Kootenay Pass, British Columbia.         and McClung (2002), avalanche forecasting is a dynamic
Most recently, Thumlert et al. (2014) confirmed these re-         and iterative process that resembles Bayesian updating where
sults in their study examining the correlation between large-     having a prior or hypothesis is critical.
scale climate oscillations and yearly avalanche activity at six
highway programmes in British Columbia (Bear Pass, Co-
quihalla, Duffy Lake, Kootenay Pass, Ningunsaw, and New           2     Background
Denver to Kaslo). In addition, they found a similarly signif-
icant relationship between avalanche activity and the Pacific     2.1    Atmosphere–ocean oscillations affecting winter
Decadal Oscillation, with more wet avalanches during posi-               weather in western Canada
tive/warmer phase winters and more dry avalanches during
negative/colder phase winters. Thumlert et al. (2014) also        The most prominent large-scale atmosphere–ocean oscilla-
identified a positive correlation between the North Atlantic      tions affecting the winter weather in western Canada and
Oscillation, a climate oscillation related to the Arctic Os-      the Pacific Northwest of the United States is the El Niño–
cillation (Bjerknes, 1964), and the frequency of wet slab         Southern Oscillation (ENSO), which originates from an ir-
avalanches. Similar studies have been conducted in other ge-      regular fluctuation between unusually warm (El Niño) and
ographic regions including Iceland (Keylock, 2003) and the        unusually cold (La Niña) conditions in the eastern South
Pyrenees in northern Spain (García-Sellés et al., 2010).          Pacific off the coast of Peru (McPhaden et al., 2006). El
   While the Canadian studies offer valuable insight into         Niño and La Niña events typically occur every 2 to 7 years
the effect of atmosphere–ocean oscillations on the nature of      and have large effects on the weather in numerous regions
avalanche hazard in western Canada, they also have lim-           around the world. In western Canada and the Pacific North-
itations. For example, since all these studies focused on         west, El Niño winters are associated with a shift towards
avalanche observations from highway avalanche safety pro-         warmer-than-normal temperatures, whereas La Niña winters
grammes, they only represent point observations and are un-       are colder than normal (Shabbar and Khandekar, 1996; Shab-
able to provide a comprehensive perspective on the over-          bar and Bonsal, 2004; Bonsal et al., 2001). The signal in
all effect across western Canada. Furthermore, changes in         precipitation is less distinct. Shabbar et al. (1997) did not
avalanche risk mitigation practices along these transporta-       identify any precipitation anomalies during El Niño or La
tion corridors can add noise to avalanche activity records that   Niña winters in western Canada, but they found negative
make it more difficult to attribute the observed patterns to      anomalies for the winters following the onset of an El Niño
changes in winter weather (Bellaire et al., 2016; Sinickas et     and positive anomalies following a La Niña event. Lute and
al., 2016; Jamieson et al., 2017). Furthermore, the seasonal      Abatzoglou (2014) showed that La Niña events in the Pacific
magnitude of avalanche activity, even if separated into dry       Northwest are associated with more frequent and more in-
and wet avalanches, only provides a limited perspective on        tense snowfall events. Numerous studies (e.g., Fleming and
the nature of avalanche hazard.                                   Whitfield, 2010; Wise, 2010; Jin et al., 2006) have shown
   The objective of the present study is to complement the ex-    that these general patterns in ENSO anomalies are blurred
isting research on the effect of large-scale atmosphere–ocean     by considerable regional differences and temporal variabili-
oscillations on avalanche hazard in western Canada by taking      ties. Stahl et al. (2006), for example, showed that the coastal

The Cryosphere, 15, 1567–1586, 2021                                                  https://doi.org/10.5194/tc-15-1567-2021
P. Haegeli et al.: Effect of large-scale atmosphere–ocean oscillations on avalanche hazard                                     1569

regions of British Columbia (BC) exhibit a stronger temper-          and below-average precipitation during winter and spring.
ature response while BC’s interior shows a stronger response         Vincent et al. (2015), on the other hand, noted a positive asso-
in the precipitation patterns. Fleming and Whitfield (2010)          ciation of winter temperatures in northern BC with the North
highlight that the positive temperature signal of El Niño is         Atlantic Oscillation, a close relative to the AO (Fleming and
weaker in northern BC, and while El Niño tends to bring              Dahlke, 2014a). They did not find a significant signal in win-
drier conditions to the southern part of BC, it produces wet-        ter precipitation.
ter conditions along the northern coast. McAfee and Wise
(2016) suggest that the effects of ENSO are stronger in late         2.2   A meaningful characterization of avalanche
winter than early winter.                                                  winters
   The Pacific Decadal Oscillation (PDO) (Mantua and
Hare, 2002; Newman et al., 2016), a primarily interdecadal           One of the challenges for examining the relationship between
atmosphere–ocean oscillation linked to changes in the sea            atmosphere–ocean oscillations and the seasonal avalanche
surface temperatures in the northern mid-latitude Pacific            hazard is how to describe avalanche hazard in a mean-
basin, is primarily known for its modulating effect of ENSO-         ingful way. While existing studies have primarily focused
related temperature anomalies. The positive temperature              on the frequency of avalanches, the ratio between dry and
anomalies during El Niño winters are stronger and more               wet avalanches, or the number of avalanche cycles, Atkins
widespread during positive PDO winters (Mantua and Hare,             (2004) and Statham et al. (2018a) highlighted that the na-
2002; Bonsal et al., 2001), and simultaneously occurring             ture of avalanche hazard, its distribution in the terrain, and
negative ENSO and PDO phases have been linked to negative            its evolution throughout the season are much more impor-
temperature and increased precipitation anomalies in western         tant for avalanche risk management than the frequency of
Canada (Bonsal et al., 2001; Stahl et al., 2006; Fleming and         avalanches alone. The presence of a persistent weak layer
Whitfield, 2010).                                                    in the snowpack can dominate the nature of an avalanche
   The Pacific North America Teleconnection Pattern (PNA)            winter even if the number of associated avalanches is rela-
(Leathers et al., 1991) is a climate oscillation that affects tem-   tively small (Haegeli and McClung, 2007). Avalanche pro-
perature and precipitation distribution over the Pacific and         fessionals therefore commonly label winters according to
North America by modulating the jet stream and storm tracks          their standout avalanche hazard characteristic (e.g., excep-
over the region on intraseasonal and interannual timescales.         tional number of surface hoar layers, early November facet-
Relevant for western Canada, the positive pattern is gener-          rain crust combination). Hence, examining the relation-
ally associated with an anomalously deep Aleutian low and            ship between long-term atmosphere–ocean oscillations and
an enhanced ridge over western North America, which leads            avalanche hazard meaningfully requires a more comprehen-
to a more meridional flow pattern with warmer and drier air          sive way to describe the nature of avalanche winters.
and reduced snow cover. The negative PNA pattern has a                  Avalanche hazard assessments included in public
more zonal circulation pattern and colder-than-average tem-          avalanche bulletins offer a more comprehensive perspective
peratures and produces higher snow accumulation (Kluver              on avalanche hazard than avalanche observations alone.
and Leathers, 2015; Brown and Goodison, 1996; Stahl et al.,          When preparing bulletins, human forecasters assimilate
2006; Wallace and Gutzler, 1981).                                    a wide range of observations and assessments to develop
   Another atmosphere–ocean oscillation affecting the win-           a detailed picture of the regional hazard conditions. This
ter weather in western Canada and the Pacific Northwest is           human contribution circumvents some of the challenges of
the Arctic Oscillation (AO; Thompson and Wallace, 1998),             pure avalanche observation datasets. For example, human
which is distinctly different from the Pacific-orientated tele-      forecasters know that there are direct action avalanches
connections mentioned previously (Wu and Hsieh, 2004).               during a storm even if poor visibility prevents the observa-
The AO is a hemispheric-scale climate oscillation that mostly        tion of these avalanches. Human forecasters can also make
affects higher latitudes and represents differences in atmo-         informed extrapolations over space and time. However, the
spheric mass between the Arctic and mid-latitudes on month-          qualitative nature of the hazard description in avalanche
to-month timescales (Thompson and Wallace, 1998). Posi-              bulletins has traditionally prevented its use in systematic
tive AO anomalies with lower pressure over the Arctic and            climate analyses.
higher pressure in mid-latitudes result in stronger westerly            Since the winter of 2010, public avalanche forecast-
flows and higher springtime temperatures in northwestern             ers in Canada have been using the conceptual model of
BC, while negative-phase AO conditions have weaker merid-            avalanche hazard (CMAH; Statham et al., 2018a) to doc-
ional pressure gradients and therefore exhibit weaker west-          ument their assessments more systematically. The CMAH
erly flows (Fleming et al., 2006; Moore et al., 2009). Gobena        identifies key components of avalanche hazard and struc-
et al. (2013), who studied the effect of AO on stream flows          tures them in a systematic workflow to provide a meaning-
in the Columbia River basin of southeastern BC, only identi-         ful pathway for synthesizing available avalanche safety ob-
fied effects during negative AO anomalies with cooler-than-          servations (weather, snowpack, and avalanche observations),
average temperatures during December, January, and March             conceptualizing hazard conditions, and choosing appropri-

https://doi.org/10.5194/tc-15-1567-2021                                                   The Cryosphere, 15, 1567–1586, 2021
1570                                 P. Haegeli et al.: Effect of large-scale atmosphere–ocean oscillations on avalanche hazard

                                                                          3     Method

                                                                          3.1    Avalanche bulletin data

                                                                          The foundation for the present study is CMAH-compliant
                                                                          avalanche hazard assessments included in daily public
                                                                          avalanche bulletins published by Avalanche Canada, Parks
                                                                          Canada, and Alberta Parks during the winter seasons 2010 to
                                                                          2019.1 Together, the three agencies provide daily avalanche
                                                                          forecasts for all main mountain ranges in western Canada,
                                                                          which include the maritime Coast Mountains along the Pa-
                                                                          cific coast in the west, the continental Rocky Mountains
                                                                          along the BC–Alberta boarder in the east, and the Columbia
                                                                          Mountains that exhibit a transitional snow climate in between
                                                                          (McClung and Schaerer, 2006) (Fig. 1). During the first two
                                                                          winters (2010 and 2011), the dataset is limited to six large
                                                                          forecast areas of Avalanche Canada (Northwest BC, South
                                                                          Coast, North Columbia, South Columbia, Kootenay Bound-
                                                                          ary and South Rockies). In winter 2012, most of these re-
                                                                          gions were subdivided into subregions to provide recreation-
Figure 1. Overview of study area with avalanche forecast areas and
                                                                          ists with more location-specific avalanche hazard informa-
analysis regions. Labels of forecast areas express the relationship       tion. In the same season, Parks Canada and Alberta Parks im-
between the large forecast areas from the first two winters and the       plemented the use of the CMAH as the foundation for their
smaller forecast areas thereafter (e.g., Northwest BC (1) to split into   avalanche bulletins. This means that for the 2012 to 2019
Northwest Coastal (1a) and Northwest Inland (1b)).                        winter seasons our data consist of daily avalanche hazard
                                                                          analyses from 15 different forecast areas (Fig. 1). To increase
                                                                          consistency among forecast areas and winters, we only in-
ate risk treatment actions. A key component of the CMAH                   cluded bulletins that were published between 1 December
is the identification and characterization of avalanche prob-             and 15 April. The number of avalanche bulletins per sea-
lems (Haegeli et al., 2010; Lazar et al., 2012), which repre-             son and forecast area is typically 136 or 137, except during
sent operational avalanche safety concerns that emerge from               the first two winters when the number was slightly smaller
the preceding weather and snowpack conditions. Avalanche                  (range: 92 to 131).
hazard assessments typically include one or more avalanche                   For the present analysis, we grouped the forecast ar-
problems, which are described in terms of their avalanche                 eas into six large-scale regions: Coast-North, Coast-South,
problem type, where they can be found in the terrain,                     Columbias-North, Columbias-South, Rockies-North and
the likelihood of associated avalanches, and the destructive              Rockies-South (Fig. 1). The Glacier National Park forecast
size of these avalanches. The CMAH defines nine different                 area was excluded from the analysis as it is a small fore-
avalanche problem types, which represent typical, repeatable              cast area that is located right between Columbias-North and
patterns of avalanche hazard formation and evolution. Identi-             Columbias-South. Furthermore, it is the only Parks Canada
fying the type of an avalanche problem is a critically impor-             forecast area in the Columbia Mountains, and their daily
tant step in the hazard assessment process as it provides an              schedule for publishing the avalanche bulletin is different
overarching filter that sets expectations and influences sub-             from all the other areas. The complete avalanche bulletin
sequent decisions about relevant types of observation and ef-             dataset consisted of 16 867 daily avalanche bulletins over 10
fective approaches for risk reduction. The broad adoption of              seasons from 15 forecast areas grouped into six large-scale
the CMAH among North American avalanche safety practi-                    regions. Organizing the forecast areas into large-scale re-
tioners and public avalanche forecasters opens new opportu-               gions has several advantages for our analysis. First, it allows
nities for including avalanche bulletin information in formal             us to include the complete dataset in the analysis despite the
research (see, e.g., Shandro and Haegeli, 2018).                          splitting of some of the forecast regions after the first two
                                                                          winters. Second, it strengthens the relatively short dataset by
                                                                          including multiple observations per region, and third, it helps

                                                                             1 Winter seasons are labelled with the year when the winter fin-
                                                                          ishes. Hence 2010 represents the winter from December 2009 to
                                                                          April 2010.

The Cryosphere, 15, 1567–1586, 2021                                                           https://doi.org/10.5194/tc-15-1567-2021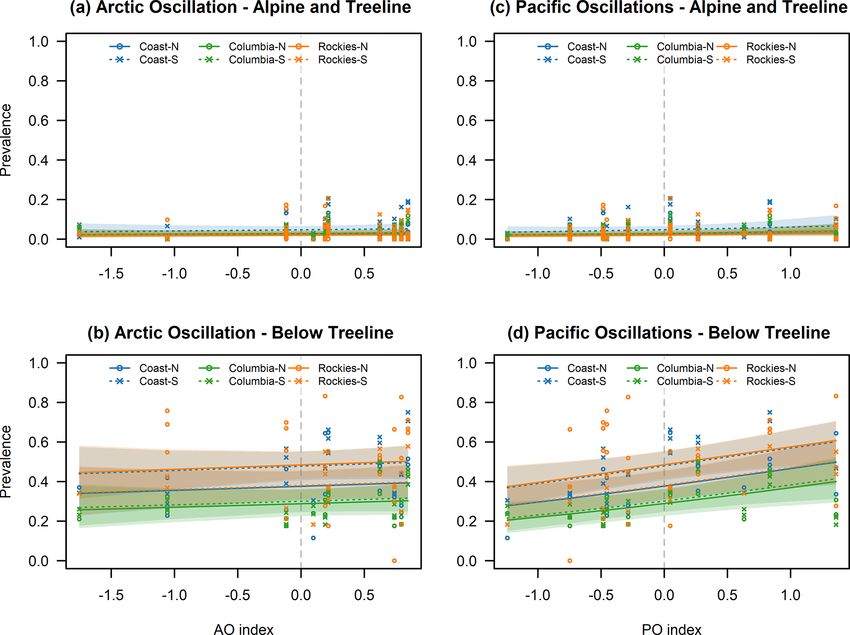
P. Haegeli et al.: Effect of large-scale atmosphere–ocean oscillations on avalanche hazard                                  1571

to smooth out small-scale variabilities that might be artifacts    outgoing longwave radiation for calculating the strength of
of the short dataset and difficult to interpret.                   ENSO. Bimonthly MEI.v2 values can be downloaded from
   Our analysis focused on the “day zero” avalanche haz-           the website of NOAA’s Physical Science Laboratory (2020).
ard assessment that avalanche forecasters make for the cur-        The intensity of the PDO is described with the PDO index,
rent day based on all available information before they pro-       which is calculated from monthly sea surface temperature
duce hazard forecasts for the upcoming days. To prepare            anomalies and the monthly mean global average sea sur-
the hazard assessments for the present analysis, we calcu-         face temperature anomaly (Mantua et al., 1997). The PNA is
lated fractions of forecast days when a specific avalanche         measured with the PNA index, which relates to anomalies in
problem type was present for each season, elevation band           the 700 and 500 mb geopotential height fields observed over
(alpine, treeline, and below treeline), and forecast region.       western and eastern North America (Zhao et al., 2013), with
This means that each winter season for a forecast area and         mean flow characterized by a trough in the eastern-central
elevation band is characterized by a set of eight percent-         Pacific and a ridge over the Rocky Mountains (Whitfield et
age values, one for each avalanche problem type (storm             al., 2010). The AO is described with the AO index (Thomp-
slab avalanche problems, wind slab avalanche problems,             son and Wallace, 1998), which incorporates non-seasonal
persistent slab avalanche problems, deep persistent slab           sea-level pressure variations north of 20◦ latitude. We down-
avalanche problem, wet slab avalanche problem, wet loose           loaded monthly values of the PDO, PNA, and AO indices
avalanche problem, dry loose avalanche problem, and cor-           from the website of NOAA’s National Centers for Environ-
nice avalanche problem). In addition, we also computed the         mental Information (2020).
fractions of days when no avalanche problems were present             Following established practices in hydrological studies
and the fractions of days with persistent or deep persistent       on the effect of atmosphere–ocean oscillations (e.g., Flem-
slab avalanche problems as forecasters have expressed chal-        ing and Dahlke, 2014a), we calculated seasonal indices for
lenges with reliably distinguishing these two avalanche prob-      the strength of the individual atmosphere–climate oscilla-
lems types (Grant Statham, personal communication, 2020).          tions by averaging the values of the winter months (MEI.v2:
While the avalanche hazard characterization method devel-          November–December to March–April; PNA, PDO, and AO:
oped by Shandro and Haegeli (2018) provides a more inte-           November to April) for each winter between 2010 and 2019.
grated perspective of conditions that also includes the sever-     While the study period is limited to 10 years, all four climate
ity of the conditions, we chose the simpler approach of fo-        indices exhibited both negative and positive anomalies and
cusing on the prevalence of individual avalanche problem           covered between 64 % and 84 % of the historical range (Ta-
types to make the results easier to interpret and simplifying      ble 2). Our study period includes ENSO observations near
the steps for reproducing the approach in other geographic         the historical minimum (2011), and the AO index exhibited
regions.                                                           its historical minimum in the winter of 2010.
   The prevalence values included in our dataset vary con-            Since the resulting seasonal indices for the Pacific-
siderably among avalanche problem types, forecast areas,           centered atmosphere–ocean oscillations were highly corre-
season, and elevation bands (Table 1 and Fig. 2). During           lated (Fig. 2; MEI.v2 vs. PDO: 0.71 (Pearson correlation co-
our study period storm slab avalanche problems, wind slab          efficient); MEI.v2 vs. PNA: 0.83; PDO vs. PNA: 0.54), it
avalanche problems, and persistent slab avalanche problems         would not be possible for our analysis to isolate their indi-
were the predominant avalanche problems in the alpine and          vidual effects in a meaningful way. To properly include the
treeline elevation bands. The most prevalent avalanche prob-       effect of these atmosphere–ocean oscillations in our analy-
lems below treeline were no avalanche problems, storm              sis and prevent inappropriate conclusions, we calculated a
slab avalanche problems, and persistent slab avalanche prob-       seasonal climate oscillation index for the combined strength
lems, whereas wind slab avalanche problems and cornice             of the Pacific-centered oscillations (POs) by averaging the
avalanche problems were rare.                                      ENSO, PDO, and PNA indices for each winter (Fig. 3). The
                                                                   time series of the seasonal AO index is distinctly different
3.2   Information on atmosphere–ocean oscillations                 from the Pacific-centered oscillations (Pearson correlations
                                                                   ranging between −0.24 and 0.20), and its correlation with
We used publicly available data from the National Oceanic          the combined PO index was only 0.05. This is consistent with
and Atmospheric Administration (NOAA) of the U.S. De-              the independence between PO and AO described in previous
partment of Commerce for characterizing the various                studies (e.g., Wu and Hsieh, 2004) and ideal for separating
atmosphere–ocean oscillations. Various indices are used to         the effects of the two types of atmosphere–ocean oscillations
identify the phase and describe the strength of ENSO. In           in the analysis.
this study, we used the revised version of the Multivariate
El Niño Index (MEI.v2; Wolter and Timlin, 2011; Zhang et           3.3   Statistical analysis
al., 2019), which considers five main parameters observed
over the tropical Pacific, including sea-level pressure, surface   While a 10-year dataset is relatively short for a climato-
zonal and meridional winds, sea surface temperature, and           logical study, our analysis approach aims to maximize the

https://doi.org/10.5194/tc-15-1567-2021                                                 The Cryosphere, 15, 1567–1586, 2021
1572                                     P. Haegeli et al.: Effect of large-scale atmosphere–ocean oscillations on avalanche hazard

Table 1. Avalanche problem types (Statham et al., 2018a) and summary of seasonal prevalence values (fractions of forecast days when a
specific avalanche problem type was present per season from 1 December to 15 April) for the three elevation bands alpine (ALP), treeline
(TL), and below treeline (BTL).

 Avalanche problem type                                     Description (Statham et al., 2018a)                         Seasonal prevalence values
                                                                                                                             (median | max.)
                                                                                                                           ALP         TL      BTL
 (a)     Storm slab avalanche problem                       Cohesive slab of soft new snow. Also called a direct-        35 | 65    36 | 62   25 | 53
                                                            action avalanche.
 (b)     Wind slab avalanche problem                        Cohesive slab of locally deep, wind-deposited snow.          57 | 98    50 | 96    2 | 19
 (c)     Persistent slab avalanche problem                  Cohesive slab of old and/or new snow that is poorly          37 | 88    43 | 88   26 | 67
                                                            bonded to a persistent weak layer and does not
                                                            strengthen or strengthens slowly over time. Structure is
                                                            conducive to failure initiation and crack propagation.
 (d)     Deep persistent slab avalanche problem             Thick, hard cohesive slab of old snow overlying an           10 | 97    10 | 91    0 | 50
                                                            early-season persistent weak layer located in the lower
                                                            snowpack or near the ground. Structure is conducive to
                                                            failure initiation and crack propagation. Typically char-
                                                            acterized by low likelihood and large destructive size.
 (e)     All persistent slab avalanche problem              Combines persistent and deep persistent slab avalanche      57 | 100   63 | 100   29 | 68
                                                            problems.
 (f)     Wet slab avalanche problem                         Cohesive slab of moist to wet snow that results in dense       1|7        0|8      0 | 14
                                                            debris with no powder cloud.
 (g)     Wet loose avalanche problem                        Cohesionless wet snow starting from a point. Also            10 | 27    13 | 33   13 | 38
                                                            called a sluff or point release.
 (h)     Dry loose avalanche problem                        Cohesionless dry snow starting from a point. Also             5 | 34     3 | 29    2 | 25
                                                            called a sluff or point release.
 (i)     Cornice avalanche problem                          Overhanging mass of dense, wind-deposited snow jut-          14 | 64     0 | 40     0|0
                                                            ting out over a drop-off in the terrain.
 (j)     No avalanche problem                               Situations when no avalanche problem is present.               1|9       6 | 21   37 | 83

                                                                                  value of the available data to provide meaningful insight
                                                                                  into the relationship between the combined Pacific-centered
                                                                                  atmosphere–ocean oscillations and the AO and the nature of
Table 2. Overview of monthly atmosphere–ocean oscillation in-
dices (ENSO: El Niño–Southern Oscillation; PNA: Pacific North
                                                                                  avalanche hazard in western Canada at the regional scale.
America Teleconnection Pattern; PDO: Pacific Decadal Oscillation;                 Whereas previous studies employed correlation analyses to
AO: Arctic Oscillation; PO: averaged Pacific-centered oscillations).              explore these relationships one at a time, we used gener-
                                                                                  alized linear mixed-effects regression models to simultane-
 Index                   Historical          Observations during study            ously examine and properly isolate the effect of the two dif-
                          range*               period (2010–2019)                 ferent types of oscillations. Since our dependent variables are
                         Min      Max        Min     Max      Percentage of       prevalence values that are bound between 0 and 1 and con-
                                                                 hist. range      siderably skewed towards lower values, we chose beta regres-
 ENSO (MEI.v2)         −2.43      2.89    −2.04      1.94                 75 %
                                                                                  sion models (Cribari-Neto and Zeileis, 2010; Smithson and
 PNA index             −3.07      2.66    −2.06      2.02                 71 %    Verkuilen, 2006) with a logit link function for our analysis
 PDO index             −3.65      3.84    −2.95      1.85                 64 %    (see Appendix A for formal expression of model). As sug-
 AO index              −4.27      3.50    −4.27      2.80                 84 %    gested by Smithson and Verkuilen (2006), we transformed
* MEI.v2: January 1979 to April 2019; PNA, PDO, and AO: January 1950 to           our prevalence values with ytrans = yorig (n − 1) + 0.5 /n
April 2019.                                                                       prior to analysis to eliminate values that are exactly 0 or 1
                                                                                  since they cannot be handled by the beta regression.

The Cryosphere, 15, 1567–1586, 2021                                                                     https://doi.org/10.5194/tc-15-1567-2021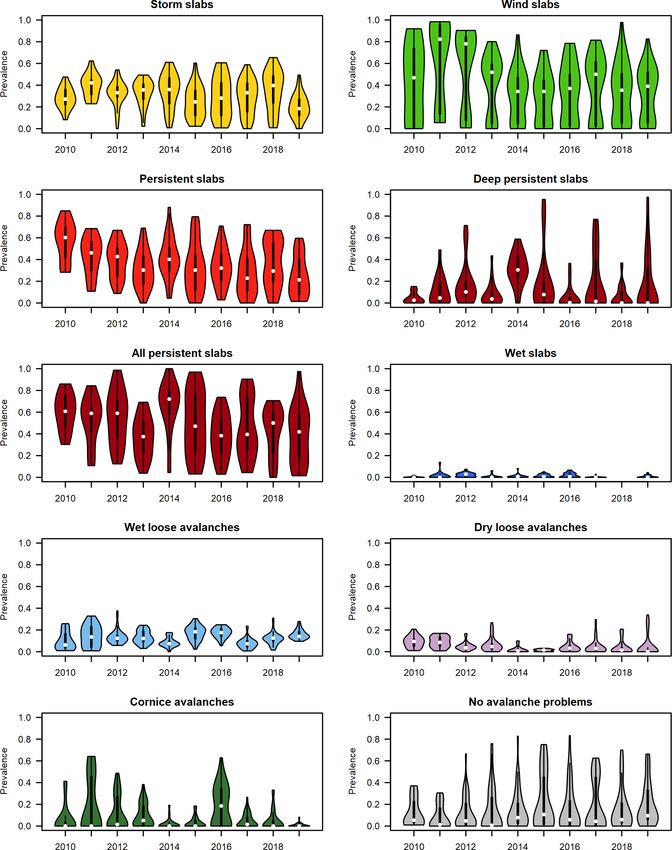
P. Haegeli et al.: Effect of large-scale atmosphere–ocean oscillations on avalanche hazard                                         1573

Figure 2. Time series of violin plots illustrating changes in the seasonal distributions of prevalence values for each avalanche problem
type. Each violin plot represents the observed prevalence values from all regions and elevation bands (18 observations in 2010 and 2011;
45 observations per winter thereafter). White dots in violin plots represent the median, and thick black lines show interquartile ranges.

   It is well known that the indices of atmospheric oscilla-           pendently of the previous winter, it is not necessary to use an
tions like the PDO or AO exhibit considerable autocorre-               autoregressive model approach for the present analysis.
lations. Newman et al. (2016), for example, point out that                We estimated separate mixed-effects models for each
the year-to-year PDO correlation is over 0.45 in late winter           avalanche problem type. Each of these models included the
and spring. However, since the seasonal snowpack in western            atmosphere–ocean oscillation indices (POs and AO) and the
Canada largely melts out every summer, and the snowpack                large-scale regions as fixed effects. Winter season was in-
structures relevant for avalanches emerge each winter inde-            cluded in the models as a random effect to account for the

https://doi.org/10.5194/tc-15-1567-2021                                                      The Cryosphere, 15, 1567–1586, 2021

1574                               P. Haegeli et al.: Effect of large-scale atmosphere–ocean oscillations on avalanche hazard

Table 3. Pearson correlation coefficients for prevalence of avalanche problem types between different elevation bands (ALP: alpine; TL: tree-
line; BTL: below treeline).

                         Storm     Wind    Persistent    Deep persistent      Wet    Wet loose    Dry loose    Cornice    No aval.
                          slabs    slabs        slabs              slabs     slabs        aval.        aval.     aval.      prob.
          ALP – TL         0.97     0.92         0.89               0.98      0.83        0.83         0.93       0.55       0.52
          ALP – BTL        0.82     0.33         0.56               0.65      0.36        0.44         0.81       0.03      −0.11
          TL – BTL         0.87     0.42         0.74               0.74      0.60        0.76         0.92       0.02       0.34

                                                                           eter estimates for AO and PO describe the average effect
                                                                           of the atmospheric oscillations across the entire study area.
                                                                           Our second model also included interactions between atmo-
                                                                           spheric oscillation variables and the large-scale regions to re-
                                                                           solve potential spatial differences in the response to AO and
                                                                           PO. We then used a likelihood ratio test to determine whether
                                                                           the second and more complex model with interactions repre-
                                                                           sented the data better than the simpler main effect model. We
                                                                           picked the interaction model as the final model if the p value
                                                                           of the likelihood ratio test was below 0.05, and we stayed
                                                                           with the simpler main effect model if it was not.
                                                                               Our preliminary analysis of the prevalence data indicated
                                                                           an abnormally high prevalence of wind slab avalanche prob-
                                                                           lems in the first three seasons (Fig. 2: 2010, 2011, and 2012).
                                                                           A closer examination revealed that this anomaly is likely re-
                                                                           lated to conditions when avalanche forecasters were simul-
                                                                           taneously concerned about storm and wind slab avalanches.
                                                                           The analysis of Shandro and Haegeli (2018) explicitly iden-
Figure 3. Winter season (November–April) average climate in-               tified these types of hazard situations and labelled them as
dices during the study period (ENSO: El Niño–Southern Oscilla-
                                                                           “storm and wind slab” and “storm, wind, and persistent slab”
tion; PNA: Pacific North America Teleconnection Pattern; PDO:
                                                                           hazard situations. To make the avalanche problem informa-
Pacific Decadal Oscillation; AO: Arctic Oscillation; PO: averaged
Pacific-centered oscillations).                                            tion in their bulletins more distinct, Avalanche Canada insti-
                                                                           tuted a new internal forecasting policy at the beginning of
                                                                           the 2013 winter season that discourages forecasters from in-
                                                                           cluding storm and wind slabs in the same forecasts (Shandro
intricacies of individual winters that cannot be explained by              and Haegeli, 2018). To account for this change in forecast-
the atmosphere–ocean oscillations included in the analysis.                ing practice in our analysis, we included an additional binary
Due to the stronger similarity in the prevalence of avalanche              variable in our dataset that was set to 1 for Avalanche Canada
problems between the alpine and treeline elevation bands                   for the first three seasons (2010, 2011, and 2012) and 0 oth-
(Table 3), we combined the analysis of the two elevation                   erwise. We then integrated the variable as an additional fixed
bands and estimated single models for prevalence values in                 effect in the models for storm slab and wind slab avalanche
the two elevation bands with elevation band as an additional               problems under the assumption that the policy change may
fixed effect. The models for below treeline were estimated                 be associated with a consistent change in the prevalence val-
separately. We did not estimate a below-treeline model for                 ues across all Avalanche Canada forecast regions.
cornice avalanche problems because this avalanche problem                      We conducted our entire analysis in R (R Core Team,
is not relevant at lower elevations. Hence, we conducted 19                2020) and used the glmmTMB package (Brooks et al., 2017)
different regression model analyses in total.                              to estimate our mixed-effects models. Because of the rela-
   To explore the spatial patterns in the effect of the at-                tively small dataset, we not only considered parameter esti-
mospheric oscillations, each of these analyses included two                mates with p values < 0.05 but also viewed parameter es-
model estimations. We first estimated a simple model that                  timates with p values between 0.05 and 0.10 to be indica-
only included AO, PO, and large-scale region as main effects.              tive of marginally significant trends. To assess violations in
All of the categorical variables were effect coded, so that the            model assumptions, we simulated quantile residuals (Dunn
parameter estimates for large-scale regions capture the av-                and Smyth, 1996) as implemented in the DHARMa package
erage differences in the prevalence of the specific avalanche              (Hartig, 2020). Visual inspection of the resulting diagnostic
problem type across the entire study period, and the param-

The Cryosphere, 15, 1567–1586, 2021                                                           https://doi.org/10.5194/tc-15-1567-2021
P. Haegeli et al.: Effect of large-scale atmosphere–ocean oscillations on avalanche hazard 1575
plots (e.g., Q–Q plot for uniformly distributed residuals) did individual points in the figures represent observed prevalence
not suggest any substantial model violations. Due to the logit values.
link function of the beta regression, the parameter estimates Our presentation of the results focuses primarily on the
are difficult to interpret directly, and converting them into big picture patterns that emerged from the analysis and does
odds ratios does not simplify the interpretation as they rep- not discuss each model in detail. However, interested read-
resent odds of percentages. In addition, making sense of the ers are referred to the available data and analysis code for
combined main and interaction effects is particularly chal- detailed information on the parameter estimates of the final
lenging in logistic regressions. To make the interpretation of models for each of the avalanche problem types and eleva-
the results more tangible, we used the parameter estimates tion bands. When interpreting the percentage point changes
from the regression analyses for the different avalanche prob- in Fig. 4, it is important to realize that the presented values
lems to calculate their expected prevalence values across the are a combination of both the magnitude of the effect of the
value ranges of the AO and PO indices observed during the atmospheric oscillation (i.e., the size of the regression param-
study period. We then followed up with post hoc pairwise eters) and the average prevalence of the avalanche problem
comparisons to assess whether the marginal mean estimates in the region over the study period. This means that the same
(i.e., the mean estimates of the prevalence values at the min- effect will produce smaller percentage point changes in re-
imum and maximum values of the AO and PO indices) were gions with lower average prevalence values of the avalanche
significantly different from each other for the different large- problem and larger values in regions with higher prevalence
scale regions. In other words, we tested whether the change values.
in the prevalence of an avalanche problem expressed in per- Overall, 7 of the 10 models for the alpine/treeline eleva-
centage points was significantly different from zero. We per- tions included interaction effects for region, whereas none
formed this part of the analysis using the emmeans and pairs of the nine below-treeline models did. A possible explana-
functions of the emmeans package (Lenth, 2019). To coun- tion of this result is that the below-treeline response to at-
teract the issue of Type I error inflation from multiple com- mospheric oscillations is more homogeneous across the en-
parisons, we calculated Holm-corrected p values. tire study area than at higher elevations because the warmer
temperatures at lower elevations mean that the snowpack is
generally closer to the melting point and therefore more sen-
4 Results sitive to temperature variations. However, one also needs to
remember that we can expect higher levels of significance in
Our presentation of the results focuses on the relationship the alpine/treeline models since the available number of ob-
between the atmosphere–ocean oscillations and the nature of servations for those models is twice as large as for the below-
avalanche hazard in western Canada at the regional scale. We treeline model. Hence the differences in the spatial patterns
therefore concentrate on the examination of the main effects across elevation bands should be treated with caution.
of AO and PO as well as their interactions with the large- Based on the results of the models, the relationships be-
scale region. The main effect of the large-scale region and tween the prevalence of avalanche problem types and the
the random intercept for the winter season are not discussed atmosphere–ocean oscillations can be grouped into four
because they only reflect the regional and seasonal variability classes. The prevalence values of the problem types (a) are
in the average prevalence of avalanche problem types respec- not affected by the atmosphere–ocean oscillations (i.e., no
tively. Interested readers are referred to Shandro and Haegeli significant main or interaction effects), (b) respond consis-
(2018) for a detailed description of these types of variabili- tently across the entire study area without detectable regional
ties. variability (only significant main effects), (c) respond region-
The results of our analysis are summarized in Fig. 4, which ally differently in addition to the overall study area effect
shows the effect of AO and PO on the prevalence values of (significant main and interaction effects), or (d) respond re-
individual avalanche problem types expressed as changes in gionally differently without an overall effect across the en-
percentage points over the range of the observed oscillation tire study area (only significant interaction effect). The ef-
indices (i.e., difference in marginal mean estimates). For each fect of PO emerged as a consistent pattern across the study
avalanche problem type and elevation band (alpine/treeline area in 5 (26 %) of the 19 models, as a consistent pattern
and below treeline) the six percentage point values are ar- across the study area with regional differences in only one
ranged to roughly represent the geographic arrangement of (5 %) model and regional differences only in three models
the large-scale regions (Fig. 1). To provide a more in-depth (16 %) (Fig. 4). No effect was observed in 10 models (52 %).
perspective on the relationship between the atmospheric os- With respect to AO, eight of the 19 models (42 %) did not
cillations and the prevalence values, effect plots are used for exhibit an effect at all and four (21 %) had a consistent effect
select avalanche problem types of interest (Figs. 5–8). These across the entire study area. In two models (11 %) the consis-
plots show the logistic relationships between the mean preva- tent effect across the study area was superimposed with re-
lence value and the AO or PO indices together with the 95 % gional differences, and the remaining five models (26 %) ex-
confidence interval for the different large-scale regions. The hibited a regional pattern without a consistent effect across
https://doi.org/10.5194/tc-15-1567-2021 The Cryosphere, 15, 1567–1586, 20211576 P. Haegeli et al.: Effect of large-scale atmosphere–ocean oscillations on avalanche hazard
Figure 4. Overview of the effect of the examined atmospheric oscillations on the prevalence values of avalanche problem types expressed
as change in percentage points over the range of the observed oscillation indices (i.e., difference in marginal mean estimates). For each
avalanche problem type and elevation band (alpine/treeline and below treeline) the six percentage point values are arranged to roughly
represent their geographic arrangement. Font and colour of the percentage point labels describe the statistical significance of the difference:
bold and black/white: p < 0.05; black/white only: 0.05 ≤ p < 0.10; grey: not statistically significant. The shading of the cell indicates the
magnitude of any significant percentage point differences: dark blue: < −10 pp; medium blue: −10 to −5 pp; faint blue: −5 to 0 pp; faint
red: 0 to 5 pp; medium red: 5 to 10 pp; dark red: > 10 pp. The labels underneath the boxes indicate whether the model includes the main
(ME) and/or interaction effects (IA).
the study area. These results clearly highlight that not all ard in the two elevation bands alpine/treeline and below tree-
avalanche problem types are affected by the atmospheric os- line. We focus on the big-picture patterns and illustrate re-
cillations and that the response can vary regionally consider- gional differences with a few examples.
ably. This is consistent with the results of several studies that
have shown considerable regional differences in the weather 4.1 Response to Pacific-centered oscillation
patterns related to atmospheric oscillation anomalies in west-
ern Canada and the Pacific Northwest (e.g., Jin et al., 2006; One of the prominent patterns in our results is the strong and
Wise, 2010; Fleming and Whitfield, 2010). uniform negative association between PO and the prevalence
The following sections provide an overview of the ob- of storm slab and dry loose avalanche problems below tree-
served effects of PO and AO on the nature of avalanche haz- line (Figs. 4 and 5). Both of these avalanche problem types
are less prevalent during the positive phase of the oscilla-
The Cryosphere, 15, 1567–1586, 2021 https://doi.org/10.5194/tc-15-1567-2021P. Haegeli et al.: Effect of large-scale atmosphere–ocean oscillations on avalanche hazard 1577 Figure 5. Calculated prevalence for storm slab avalanche problems in relation to AO (a, b) and Pacific-centered oscillations (c, d) for the alpine/treeline (a, c) and below treeline (b, d) over the range of observed index values. Lines indicate the mean estimates, and shaded areas represent the 95 % confidence intervals. Individual points represent observed prevalence values. tion and more prevalent during the negative phase. Comple- across the study area (i.e., no significant interaction effect), mentary to this pattern, we observed a significant positive but the magnitude of the estimated difference over the ob- relationship between PO and the prevalence of days with served PO index is most pronounced in the Rocky Moun- no avalanche problems (Figs. 4 and 6). These observations tains. While Fleming and Whitfield (2010) point out that the are consistent with the existing understanding of the effect northern coast of BC and Alaska exhibits an inverse response of PO on the winter weather in the southern parts of BC pattern for precipitation with the warm ENSO phase bring- and the Pacific Northwest as the warmer temperatures expe- ing wetter winter and spring conditions, this deviation would rienced during the positive phase (Shabbar and Khandekar, only affect the Coast-North region of our study area. 1996; Shabbar and Bonsal, 2004; Bonsal et al., 2001) gen- Another interesting widespread pattern is also the nega- erally result in a shallower and less hazardous snowpack at tive relationship between PO and the prevalence of wind slab lower elevations. The observed pattern is also consistent with avalanche problems across the study area (Figs. 4 and 7). In the results of Lute and Abatzoglou (2014), who showed that the alpine/treeline elevation band, the pattern is a combina- La Niña winters in the Pacific Northwest are generally asso- tion of an overall negative effect across the study area that ciated with above-normal snow water equivalents that result is further enhanced by a negative interaction effect in the from both more snowfall days and more extreme snowfall Columbias-South region. Combined, the magnitude of the events compared to El Niño winters. The results are also con- estimated difference over the observed PO index is largest in sistent with the studies of Brown and Goodison (1996) and the Columbia Mountains followed by the Rockies-North and Moore and McKendry (1996), who showed that the positive Coast-South regions. The reduction in wind slab avalanche phases of both ENSO and PNA are associated with reduced problems is also observed below treeline, but it is impor- snow cover in western Canada. Hence, our prevalence val- tant to remember that this type of avalanche problem is only ues for alpine/treeline storm slab avalanche problems exhibit rarely an issue at lower elevations (Fig. 7, bottom row). The the expected negative association with PO at higher eleva- observed change in the prevalence of wind slab avalanche tions (Figs. 4 and 5). Consistent with the previous research, problems can potentially be explained with the changes in the our regression analysis indicates a homogeneous effect of PO large-scale circulation patterns associated with the PNA. As https://doi.org/10.5194/tc-15-1567-2021 The Cryosphere, 15, 1567–1586, 2021
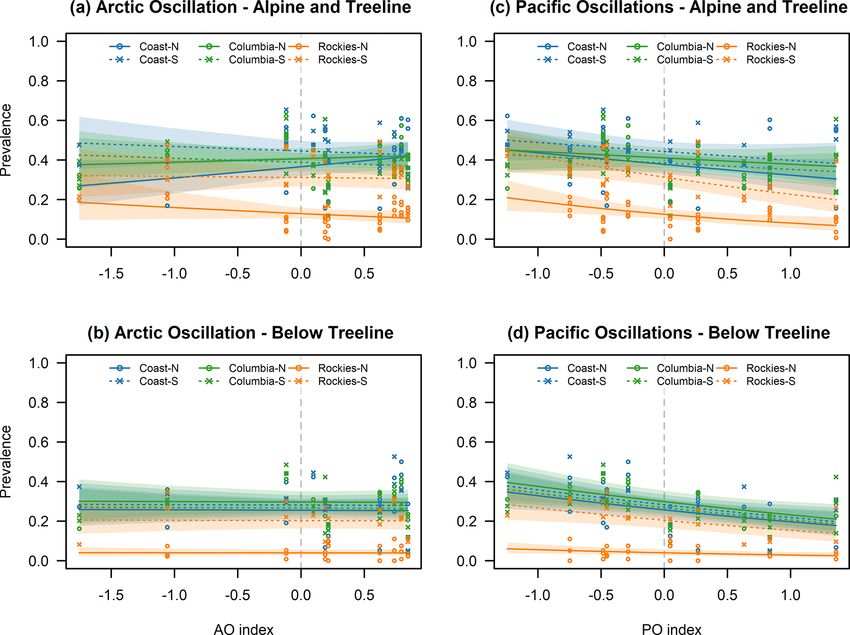
1578                               P. Haegeli et al.: Effect of large-scale atmosphere–ocean oscillations on avalanche hazard

Figure 6. Calculated prevalence for wind slab avalanche problems in relation to AO (a, b) and Pacific-centered oscillations (c, d) for the
alpine/treeline (a, c) and below treeline (b, d) over the range of observed index values. Lines indicate the mean estimates, and shaded areas
represent the 95 % confidence intervals. Individual points represent observed prevalence values.

described by Bonsal et al. (2001) and Stahl et al. (2006), the           accounted for this change in forecasting practices, we can be
enhanced ridge over western North America during the pos-                more confident that the identified changes in the prevalence
itive phase of the PNA results in a weaker and more merid-               of wind slab avalanche problems are associated with PO.
ional flow pattern over the study area than the more zonal                  In addition to the large-scale patterns described above,
flow pattern during the negative phase. Furthermore, the en-             we also observe several more regional patterns. First, we
hanced ridge and associated northern displacement of the jet             see a positive relationship between PO and the prevalence
stream during the positive phase also inhibits the formation             of wet slab avalanche problems in the southern regions of
Arctic outflow situations (Bonsal et al., 2001). Both of these           the study area (Fig. 4). While the absolute change is rela-
effects together offer a reasonable explanation for the ob-              tively small, it is partially due to the fact that wet slabs are
served pattern in the prevalence of wind slab avalanche prob-            generally forecasted rarely (Fig. 2). This observation is con-
lems.                                                                    sistent with the results of McClung (2013) and Thumlert et
   When interpreting the prevalence of storm slab and wind               al. (2014), who describe positive associations between the
slab avalanche problems, it is important to remember the                 percentage of wet-snow avalanches and ENSO and PDO, but
change in forecasting practice at Avalanche Canada at the                the effect in our study is substantially smaller. This discrep-
beginning of the 2013 winter season. The additional vari-                ancy is likely explained by the fact that McClung (2013) and
able included in the model to account for this change was                Thumlert et al. (2014) defined wet avalanches based on the
only marginally significant for storm slab avalanche prob-               recorded liquid water content of the avalanche deposit (Cana-
lems in the alpine/treeline model (−0.337; p value = 0.093)              dian Avalanche Association, 2016: dry, moist or wet). This
but highly significant for wind slab avalanche problems in               means that their percentage of wet avalanches also includes
the alpine/treeline model (1.540; p value < 0.001). This in-             avalanches that started dry but became wet as they reached
dicates that Avalanche Canada forecasters included wind slab             lower elevations. A second potential reason for the lower
avalanche problems substantially more frequently in the haz-             prevalence of wet avalanches in our study is that we lim-
ard assessments and storm slab avalanche problems slightly               ited our datasets to between 1 December and 15 April, which
less frequently before the practice change. Having explicitly

The Cryosphere, 15, 1567–1586, 2021                                                           https://doi.org/10.5194/tc-15-1567-2021
P. Haegeli et al.: Effect of large-scale atmosphere–ocean oscillations on avalanche hazard 1579
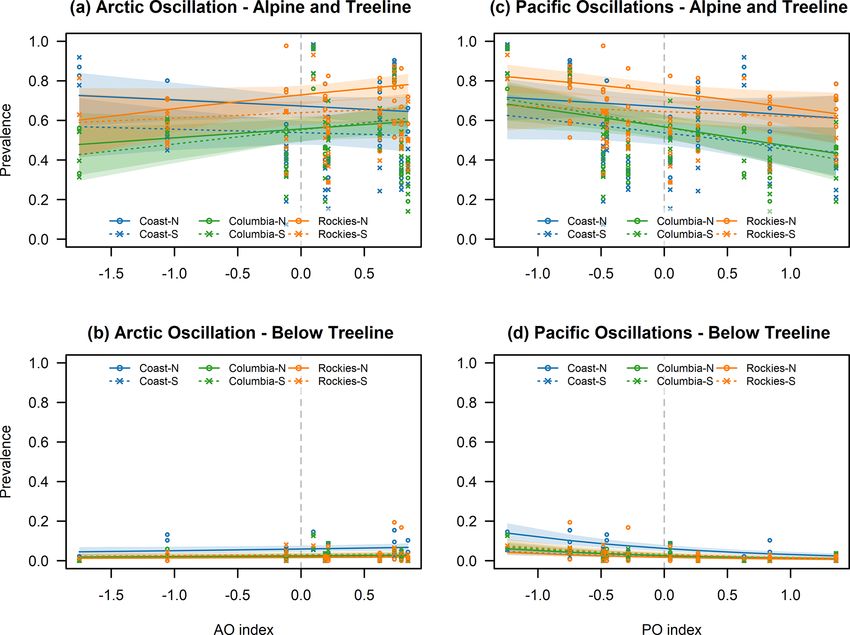
Figure 7. Calculated prevalence for no avalanche problems in relation to AO (a, b) and Pacific-centered oscillations (c, d) for the
alpine/treeline (a, c) and below treeline (b, d) over the range of observed index values. Lines indicate the mean estimates, and shaded
areas represent the 95 % confidence intervals. Individual points represent observed prevalence values.
likely prevents widespread wet avalanche cycles in the spring the beta regression can only capture monotonic relationships
from being included. between the prevalence of an avalanche problem type and the
A second set of regional PO response patterns observed oscillation indices. This may be an issue for the analysis of
in our results include a negative relationship with the preva- persistent slab avalanche problems that are most common in
lence of deep persistent slab avalanche problems and a pos- transitional snow climates where we have a combination of
itive relationship with wet loose avalanche problems in the both maritime and continental influences (Haegeli and Mc-
alpine/treeline models in the Rockies-South region (Fig. 4). Clung, 2007). Analogously, neutral atmosphere–ocean oscil-
Both patterns are potentially consistent with the higher tem- lation conditions might be most favourable for this type of
peratures during positive PO phases. The isolated response avalanche problem. Non-monotonic response patterns to PO
of the Rockies-South region is not overly surprising as the in western Canada have also been identified in hydrological
southeast corner of British Columbia is well known for be- studies such as Fleming and Dahlke (2014a, b) and Fleming
ing exposed to different weather systems and having a unique et al. (2016).
snow climate that is distinct from the surrounding areas.
While the more northern parts of the Canadian Rocky Moun- 4.2 Response to Arctic Oscillation
tains exhibit a traditional continental snow climate, the south-
ern parts have a more transitional snow climate with warmer
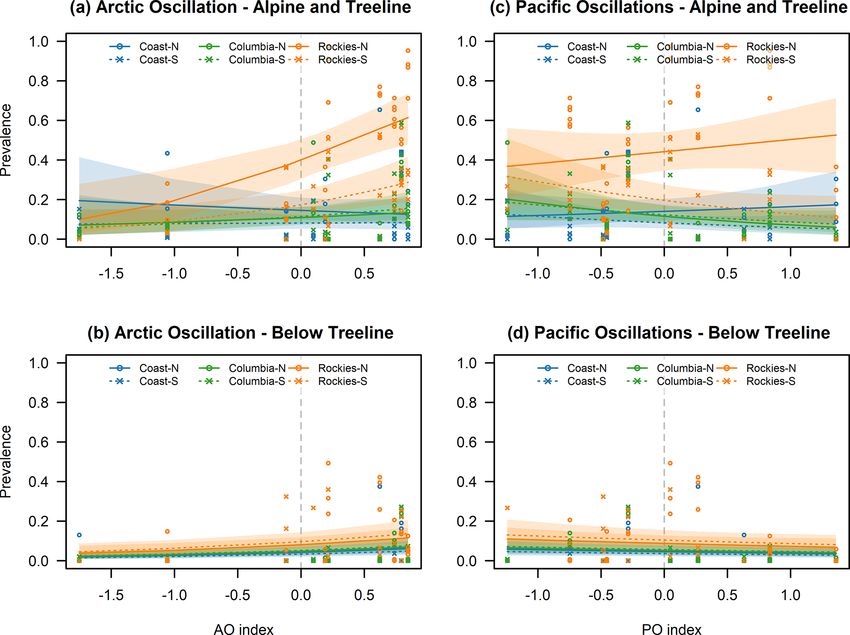
One of the prominent AO response patterns in our analy-
temperatures and a deeper snowpack (Claus et al., 1984;
sis is the increase in the prevalence of deep persistent slab
Johnston, 2011; Haegeli and McClung, 2007).
avalanche problems across a substantial part of the study area
Interestingly, our analysis did not reveal a substantial rela-
(Figs. 4 and 8). While the main effect in the alpine/treeline
tionship between PO and the prevalence of persistent or deep
model is relatively weak (0.386; p value = 0.056), signif-
persistent slab avalanche problems, except the local effect
icant interactions describe a stronger effect in the Rocky
on deep persistent slab avalanche problems in the Rockies-
Mountains and a diminished effect in the Coast Mountains.
South region. To provide context for the interpretation of this
The pattern is more uniform in the below-treeline model.
result, it is also important to remember that the logit link of
However, it is important to remember that the large change
https://doi.org/10.5194/tc-15-1567-2021 The Cryosphere, 15, 1567–1586, 20211580 P. Haegeli et al.: Effect of large-scale atmosphere–ocean oscillations on avalanche hazard Figure 8. Calculated prevalence for deep persistent slab avalanche problems in relation to AO (a, c) and Pacific-centered oscillations (c, d) for the alpine/treeline (a, c) and below treeline (b, d) over the range of observed index values. Lines indicate the mean estimates, and shaded areas represent the 95 % confidence intervals. Individual points represent observed prevalence values. in the prevalence in the Rocky Mountains is a combination for by a concurrent decrease in the prevalence of dry loose of the positive interactions as well as the higher prevalence avalanche problems (Fig. 4). While we observe a uniform of deep persistent slab avalanche problems in the continen- decrease across the entire study area at all elevation bands, tal snow climate in general (Fig. 8 and Shandro and Haegeli, additional interactions in the alpine/treeline model indicate 2018). Similar to the response to the PO, we did not identify that the effect is weaker in the Columbia Mountains and par- a significant effect of AO on the prevalence of persistent slab ticularly strong in the Rockies-North region. This pattern is avalanche problems. consistent with the stronger impact of AO observed in the We also observe an increase in the prevalence of wind Rockies-North region in general. slab avalanche problems in the alpine/treeline model, pre- Another regional response pattern associated with AO is a dominantly in the Rockies-North and Columbias-South re- consistent significant increase in the prevalence of wet loose gions due to significant interactions (Figs. 4 and 7). Below dry avalanches in the northern parts of the study area (Fig. 4). treeline, we observe a minimal and only marginally signif- This result is in line with the higher springtime temperatures icant positive increase, but wind slabs are rarely forecasted in northwestern British Columbia described by Fleming et at lower elevations anyway. The observed increase in wind al. (2006), but most of the regions included in our study are slab avalanche problems is possibly related to the more in- substantially further south than their study area. The lack of tense westerly flows caused by the stronger meridional pres- a similar pattern in the below-treeline model might be due sure gradient during the positive phase of AO (Fleming et to the smaller size of the dataset or the fact that higher el- al., 2006; Moore et al., 2009). The more intense westerly and evations are more sensitive to temperature changes in the therefore onshore flow might also contribute to the observed spring when the lower elevations experience above-freezing increase in the prevalence of storm slab avalanche problems temperatures anyway. It is worth noting that the AO analysis in the Coast-North region (Figs. 4 and 5). of Thumlert et al. (2014) also did not find a relationship with The increase in deep persistent slab, wind slab, and storm avalanche activity overall or dry and wet avalanches separate. slab avalanche problems in different parts of the study area Different from the effect of PO, our analysis did not reveal during the positive AO phase is potentially compensated a significant relationship between the prevalence of days with The Cryosphere, 15, 1567–1586, 2021 https://doi.org/10.5194/tc-15-1567-2021
You can also read