WATER QUALITY AND QUANTITY - Horizons Regional Council
←
→
Page content transcription
If your browser does not render page correctly, please read the page content below
WATER QUALITY AND QUANTITY
1       ACTIVITY OVERVIEW
The Water Quality and Quantity Activity of the Annual Plan includes the work programmes of
Horizons Freshwater & Partnerships and Science & Innovation teams.

Horizons’ Freshwater & Partnerships Team works closely with other Horizons teams, and
people and organisations external to the council, to implement water quality and aquatic
habitat improvement works. This work draws on monitoring and research undertaken by
Horizons Science & Innovation and Environmental Data teams, along with that of other
agencies, to prioritise and focus implementation efforts.

Both programmes actively seek funding from other sources to provide external science advice
and facilitate the acceleration of works. These include the Freshwater Improvement Fund
(FIF) for the Manawatū, Whangaehu and Lake Waipu/Rātana catchments, Public Waterways
Ecosystem Restoration (PWER) for the Regional Stream Fencing and Riparian Planting
programme, enhancing fish populations through Fish Barrier Remediation programme and
Horowhenua water quality interventions projects, and the Community Environmental Fund
(CEF) for the Waikawa Catchment. These are all administered through the Ministry for the
Environment (MfE). Funding of science advice through the Ministry of Innovation,
Business and Employment’s (MBIE) Envirolink fund totals approximately $120,000 per
year.
Implementation activities include: riparian fencing and planting for water quality improvement
and fish habitat enhancement; identification and enhancement of whitebait spawning habitat
and fish passage improvement; sewage treatment plant upgrades; work with horticulture
growers; and harvesting of lake weed.

Science activities include monitoring and reporting of water quantity for both surface water
and groundwater, and the quality of groundwater, rivers, lakes, estuaries, and the coast. More
than 80 popular swim spots are monitored weekly throughout the swimming season from
November to April. In addition to guiding implementation programmes, science and research
also informs consent decision-making, and policy development and implementation.
Communication of science data and information is primarily covered in the Environmental
Reporting and Air Quality Monitoring section of this report.
This item presents the Water Quality and Quantity Activity regionally where appropriate and/or
for each of the Freshwater Management Units (FMUs) that make up the Manawatū-
Whanganui region. It integrates the implementation work of the Freshwater & Partnerships
Team, and the water quality and quantity activities of the Science and Innovation &
Environmental Data teams. This includes the:
Regional Water Quality and Quantity Programme;
Whanganui & Kai Iwi;
Whangaehu – including the Whangaehu FIF projects;
Rangitīkei-Turakina – including the Lake Waipu (Rātana) FIF project;
Manawatū – including the Manawatū River Accord and FIF project;
Waiopehu – including the Lake Horowhenua Accord and PWER project, as well as
freshwater improvement work with horticulture growers; and
Puketoi ki Tai – coastal Tararua area.
Figure 1: Freshwater Management Units in the Horizons region
The June 2021 Environment Committee report presents information for the period January
2021 to April 2021 in the context of delivery of the programme for the financial year 1 July
2020 to 30 June 2021, including an annual summary of the 2020-21 science monitoring and
research activity completed. Due to the timing of this report, many reports had not yet been
finalised but all will be made available once finalised.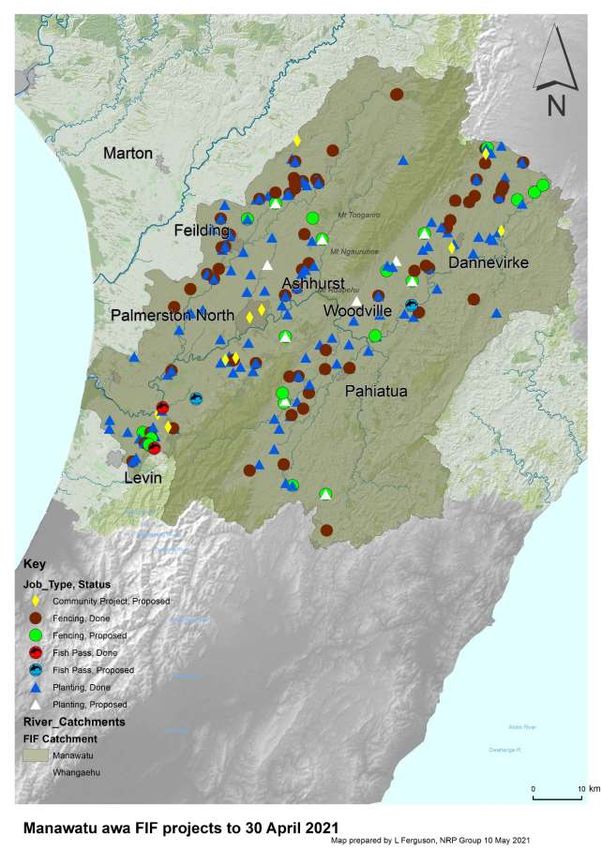
2 REGIONAL WATER QUALITY AND QUANTITY
PROGRAMME
2.1 Regional Freshwater & Partnerships Overview
PROGRESS AGAINST ANNUAL PLAN TARGETS
2.1.1 The Freshwater & Partnerships programme links with a range of national and regional
policies and strategies. The programme aims to deliver freshwater enhancement work
in partnership with others to improve water quality and aquatic health outcomes, and
to facilitate community involvement. Some of the work also informs restoration
options and seeks to build capacity. The programme delivers work across six key
components, each of which includes funding from Central Government. They are:
Regional freshwater programme, outside the Manawatū and Whangaehu
Catchments (includes the Jobs for Nature stream-fencing and riparian-planting
programme);
Manawatū Accord and Freshwater Improvement Fund project;
Whangaehu Catchment Freshwater Improvement Fund project;
Enhancing fish populations through fish barrier remediation Jobs for Nature
project;
Waipu Catchment Freshwater Improvement Fund project to remove the Rātana
waste water treatment plant (WWTP) discharge from Lake Waipu and irrigate
to land, while also developing a restoration plan for Lake Waipu; and
Lake Horowhenua Accord and Lake Horowhenua Jobs for Nature project.
2.1.2 A summary of progress against Annual Plan targets is presented in this section of the
report, and project updates on specific works are presented in the relevant FMU
summary.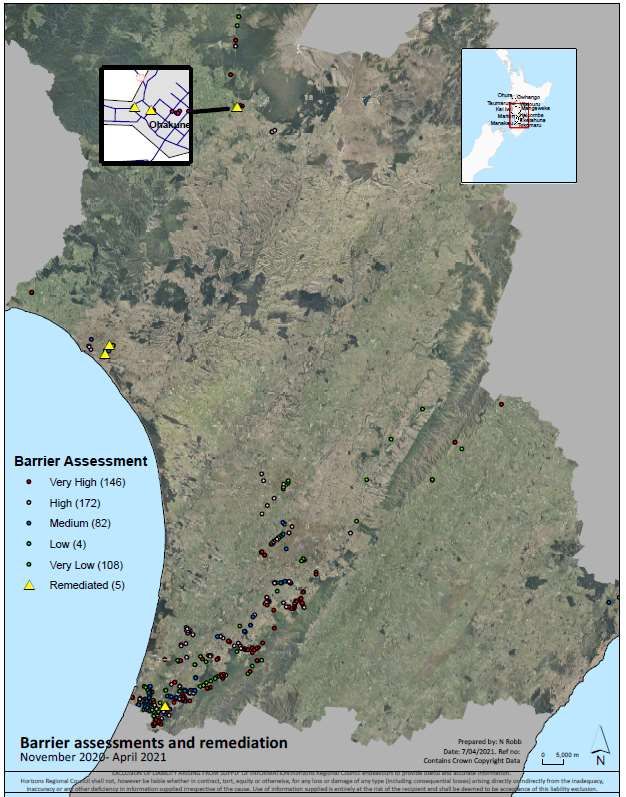
Table 1: Freshwater & Partnerships programme progress against the 2020-21 Annual Plan
targets as at 30 April 2021.

                           Riparian fencing (km)                           Riparian planting

                                                         %                                           %
                  Target    Allocated    Complete                Target   Allocated    Complete
                                                      complete                                    complete

    Regional       12        2.540        2.316       145%1      20,000   14,905       15,241      162%
    Jobs for       35       43.687       15.094        43%       35,000   45,245       17,242       49%
    Nature2
    Manawatū       50         95.2         64.2        128%      40,000   115,192      104,540     261%
    Whangaehu      17        40.35       10.654        63%       3,333     7,237        2,364       71%
    Total3         102       178.4       84.944        83%       78,333   182,579      139,387     178%
                                        Fish passes                               Community projects
                                                         %                                           %
                  Target    Allocated    Complete                Target   Allocated    Complete
                                                      complete                                    complete

    Regional        1          0            0           0%4        1         1            1        100%
    Jobs for        5          5            5          100%       n/a       n/a          n/a        n/a
    Nature
    Manawatū        4          9            3          75%         9         10           2         22%
    Whangaehu       2          6            3          150%        3         8            2         67%
    Total3
                    7          20          11          157%       13         21           5         38%

1
    % is based on works completed in both the Regional and Jobs for Nature programmes.
2
 Currently not an annual plan target however, both the Regional and Jobs for Nature projects
count towards the Annual Plan targets for the Regional Freshwater Programme.
3NB: The totals in these target tables represent an overall total and achieving these totals does not
necessarily mean all targets have been met, as it is the individual targets that are in the Annual Plan.
4
    Captured in the Jobs for Nature reporting for fish passage.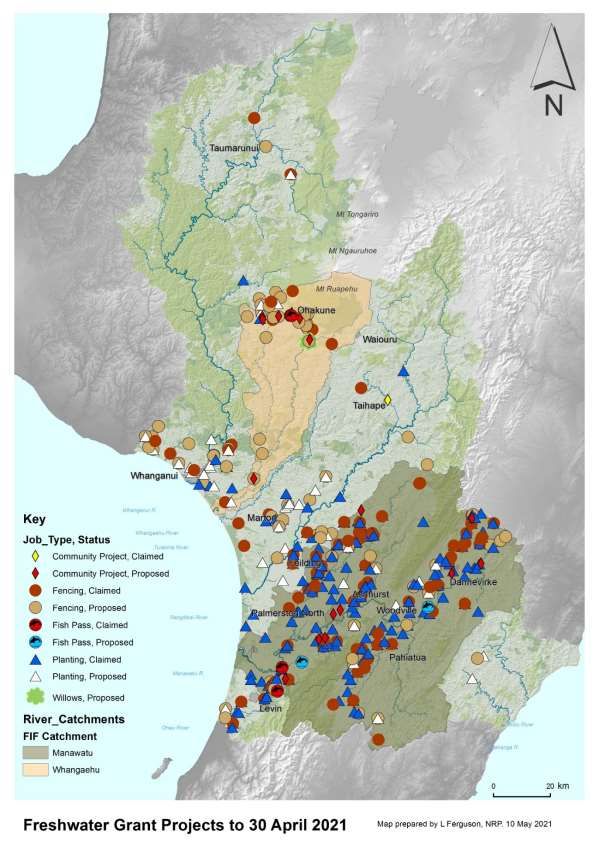
Figure 2: Freshwater implementation projects for stream fencing, riparian planting,
community projects, and fish passes for the 2020 -21 financial year (as at 30 April 2021).
JOBS FOR NATURE PROJECTS
2.1.3 In July 2020 Council resolved to enter into three Jobs for Nature “Quick-start”
projects. These projects are funded through the broad Jobs for Nature Fund, and
more specifically are referred to by MfE as Public Waterway Ecosystem Restoration
Fund projects.
2.1.4 The Deeds of Funding for the Stream Fencing and Riparian Planting programme, and
enhancing fish populations through fish barrier remediation, have been signed and the
first meetings of the governance groups were during October 2020.
2.1.5 During the reporting period the following positions were added to the team as a result
of the additional funding:
A research assistant on a fixed 12-week contract joined the Fish Passage team in
March 2021;
A recruitment process for a Freshwater Coordinator – Horowhenua FMU and
Freshwater Advisor has been completed. The Freshwater Coordinator joins us on 3
May 2021 and the Freshwater Advisor on 5 July 2021; and
The recruitment process for two monitoring roles for the Horowhenua FMU water
quality interventions project was about to commence.
ENHANCING FISH POPULATIONS THROUGH FISH BARRIER REMEDIATION
2.1.6 Quarter 3 of year 1 of this four-year project was recently completed and overall it is
on schedule to achieve the deliverables prior to the end of the first project and
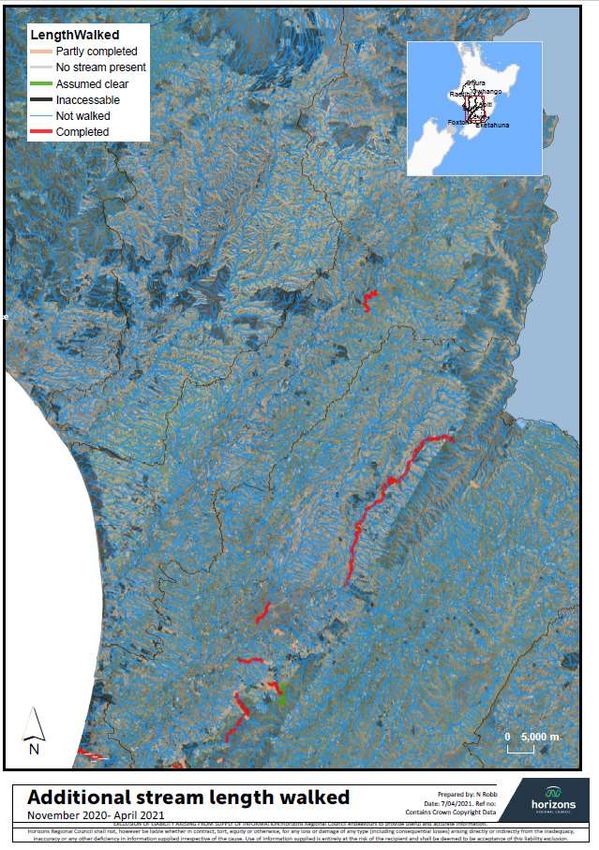
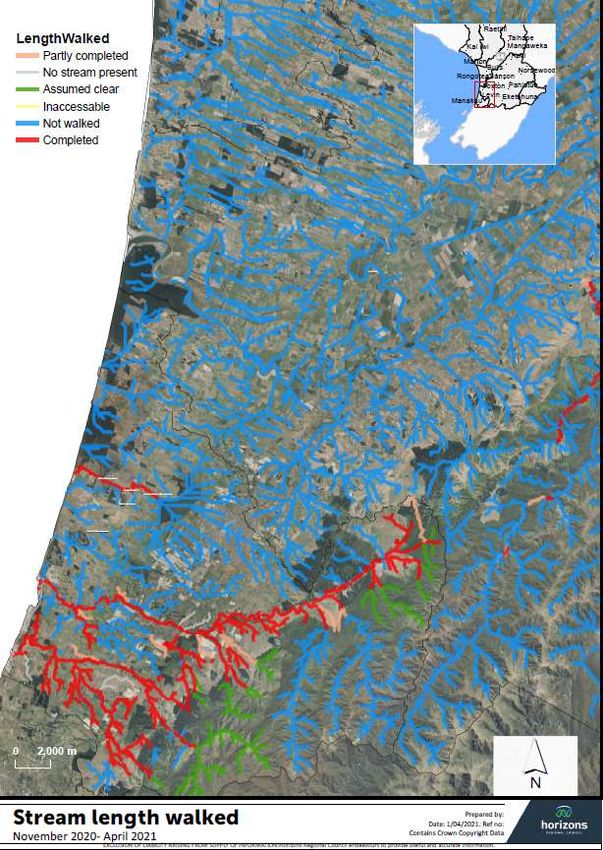
financial year. Key focus areas for the team have been: stream walking to assess
barriers to fish migration, monitoring of fish and kakahi populations, and remediation
of identified barriers. Stream walking in the two focus catchments (Waikawa and
Ōhau) is now complete (Figure 1), with a total of 350 km walked. Small sections of
these catchments were unable to be walked due to dangerous terrain and/or an
inability to find landowner contact details and/or the landowner denying Horizons staff
entry. Stream walking has continued in the Pohangina Catchment and other small
sections of the Manawatū Catchment (Figure 2).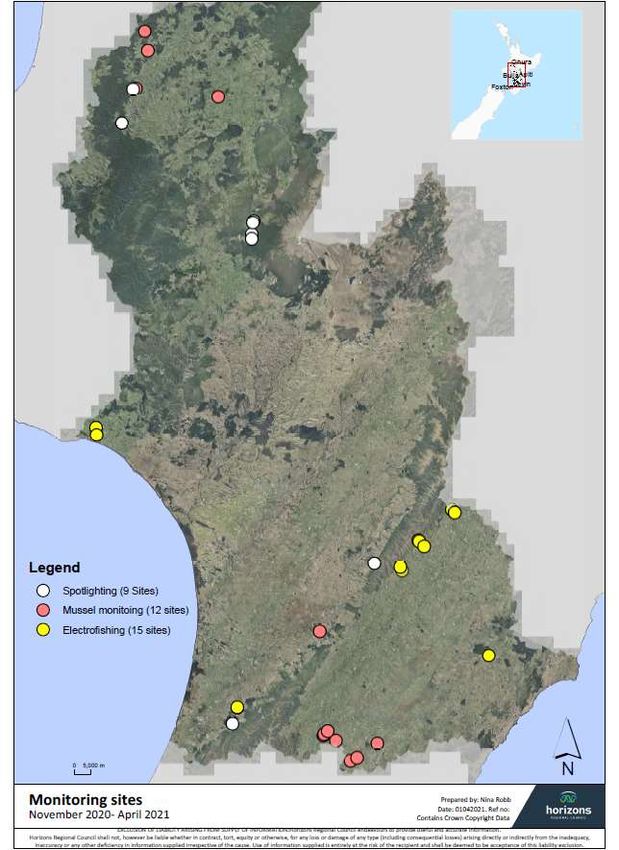
Figure 1: Stream length walked in Ōhau and Waikawa Catchments.
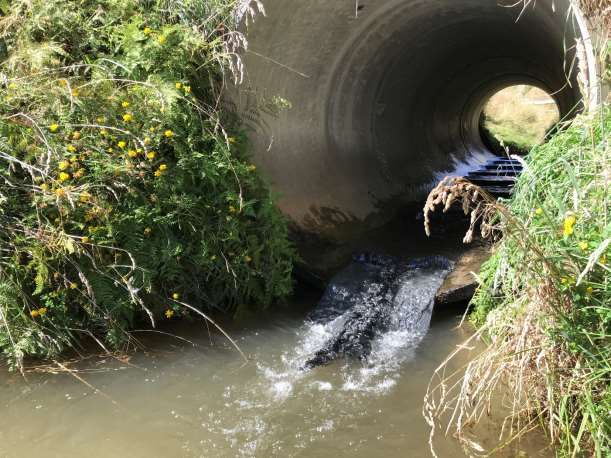
Figure 2: Stream length walked in the Manawatū Catchment

2.1.7   Fish and kākahi (freshwater mussel) monitoring has been progressing well with 24
        fishing sites and 12 kakahi sites surveyed (Figure 3). A report on the current state of
        the region’s fish and kakahi populations by Massey University is set to be completed
        by the end of this financial year.
Figure 3: Monitoring si tes completed through to the end of Q3. Note: Eleven ele ctrofishing
sites have been surveyed on the eastern side of the Manawatū (clumped yellow dots)
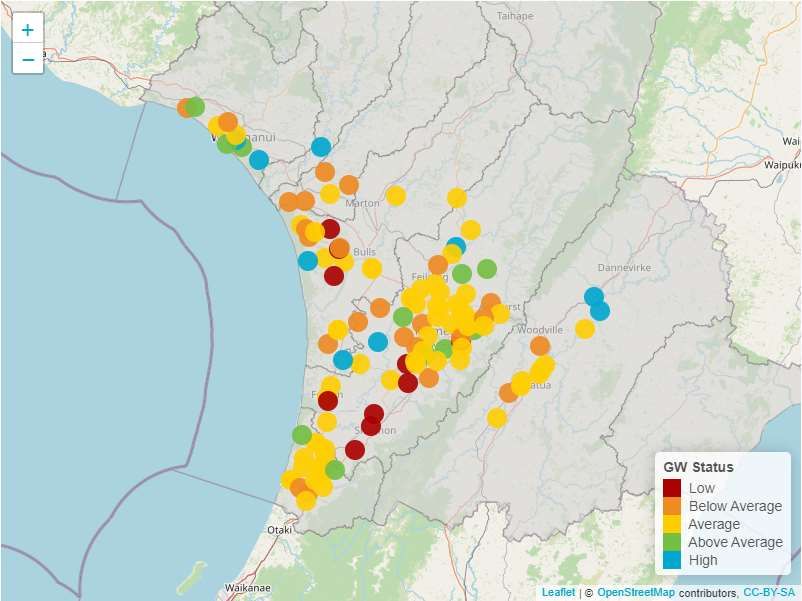
Figure 4: Top left: Koaro (Galaxias brevipinnis) found while spotlighting in an unnamed
tributary of the Ōhau River. Top right: A ‘b lue’ koura found while spotlighting in an
unnamed tributary of Makomi ko Stream near National Park, Ruapehu District. .

2.1.8   The project has a target of five sites this year for barrier remediation and by the end
        of Q3 all five barriers were remediated, and 512 barrier assessments conducted
        (Figure 5). These fixes took place in an unnamed tributary of the Mangawhero River
        (Figure 6) and in the Purua (Figure 7) and Awaru (Figure 8) streams in Whanganui.
Figure 5: Map showi ng the fi ve i n-stream structures that have been assessed and remediated to date.
Figure 6: Culvert remediations i n a tributary of the Mangawhero Stream, Ohakune. Flexi -
baffles were installed throughout with mussel rope (top right) attached to the apron of one
cul vert to allow climbing species to pass.

Figure 7: Left: Large box cul vert located in the Awarua Stream, Whanganui , prior to
remediation. Right: Remediated culvert with lengths of flexi -baffles and a fish ramp
installed.
Figure 8: Culvert remediation, Purua Stream, Whanganui. Flexi-baffles were installed
throughout thi s 195 metre culvert running under SH4 into the Whanganui Rive r.
2.2 Regional Water Quality & Quantity Science Programme
Overview
MONITORING PROGRAMMES
2.2.1 Water quality and quantity monitoring is overseen by Horizons Science & Innovation
team, but delivered in partnership with the Environmental Data, Consents Monitoring
and Freshwater & Partnerships teams. Much of this activity focusses on improving
knowledge and understanding of the region’s freshwater and coastal environments by
monitoring the state of the environment, tracking changes over time and identifying
areas of emerging pressure. Water quantity, quality monitoring and biomonitoring
programmes encompass:
River flow at 65 sites, groundwater levels at 192 sites and measurement of water
use at more than 350 sites across the region;
River water quality at 90 SoE sites, 32 discharges and 52 sites located upstream
and downstream of discharges;
Water quality at four coastal and seven estuary sites, and ecological condition
and/or sedimentation of five estuaries;
Groundwater quality at 35 sites;
Water quality in 17 lakes and submerged plants in approximately eight lakes
annually;
81 popular swim spots throughout the swimming season from November to April; Macroinvertebrates at 95 sites and periphyton at 63 sites.
2.2.2 The monitoring network is undergoing a review in response to national policy
requirements, and to better inform decision-making and implementation programmes.
ENVIROLINK RESEARCH
2.2.3 Horizons is one of a number of smaller regional councils that can access funding
through the MBIE Envirolink Fund. Approximately $120,000 of Horizons’ applications
are successful each year. A number of potential projects have been identified and five
advice grants totalling $110,830 were secured for 2020-21, as shown in Table 1.
Further details and links to these reports, where available, can be found in the body
of this report.
Table 2: Envirolink-funded projects for Horizons Regional Council in 2020 -21.
Envirolink Project Provider Value Deliverable
National Environmental Monitoring
Standards (NEMS) macroinvertebrate NIWA $5,460 Technical advice
review
Riparian and freshwater plant
NIWA $10,000 Workshop
identification
Paired laboratory nutrient analysis NIWA $10,000 Technical report
Coastal Marine Area (CMA) mapping of
NIWA $38,737.50 Technical report
the Horizons Region
Trend analysis and reporting guidance NIWA $46,632.50 Technical report
TOTAL $110,830
2.2.4
TREND ANALYSIS
2.2.5 This project around trend analysis is the largest grant for the year and is a good
example of what the Envirolink fund seeks to do
i.e., transfer knowledge from science providers to the applied work of regional
councils.
2.2.6 Practical guidance for the analysis and reporting of temporal trends in environmental
data has been prepared for Horizons on behalf of the regional sector, via an MBIE
Envirolink advice grant. The primary purpose of this guidance is to facilitate more
consistent and transparent assessment and reporting of trends in freshwater and
other environmental data. The emphasis of the work is on freshwater physico-
chemical and biological variables. However, the methods are applicable to other
environmental variables and domains e.g., lakes, groundwaters, estuaries and coastal
waters, for which a suitable time-series record exists.
2.2.7 Trend assessments serve multiple purposes including informing the public about
changes in environmental state, assessing the effectiveness of management actions
and policies, evaluating relationships between environmental conditions and the
factors that influence them i.e., driver or explanatory variables, and providing early
warning of environmental problems. Trend assessments are used in New Zealand for
regional and national environmental reporting, reflecting regional council
responsibilities under Section 35 (2) of the Resource Management Act. Recently, the
requirement for trend analysis has been made explicit in the National Policy
Statement for Freshwater Management (NPS-FM).2.2.8 These guidelines start by describing three types of application of trend analysis: local,
regional and national. Local applications are concerned with maximising information
about trends at a single site whereas regional and national applications are concerned
about obtaining consistent assessments over many sites. The details of trend analysis
and reporting process vary to some extent depending on the type of application.
2.2.9 The guidance describes trend analysis in four main steps:
1. acquiring and compiling data,
2. accounting for confounding factors,
3. assessing trend direction, rate and confidence in these determinations, and
4. reporting the results.
2.2.10 Trend assessment is a process of building a statistical model of the behaviour of a
variable at a site over a time period of interest. based on a series of observations. The
guidelines describe methods for detecting and quantifying the two most fundamental
aspects of the relationship between the variable and time: the direction i.e.,
increasing or decreasing and the rate of change e.g., change in concentration per
year. In addition, because the observations are subject to random fluctuations and
only comprise a sample of the variable’s behaviour over the time period, the
guidelines also describe methods for quantifying the uncertainties associated with the
assessment of trend direction and rate.
2.2.11 This guidance is directly applicable for the requirement in Section 3.19(1) of the NPS-
FM to characterise trends. However, NPS-FM Sections 3.19(2) and 3.19(3) concern
the causes of trends i.e., trend attribution, which was out of scope for this guidance.
2.2.12 Reports
Snelder, T., Fraser, C., Larned, S., Whitehead, A. (2021). Guidance for the analysis of
temporal trends in environmental data. NIWA Client Report 2021017WN, April 2021.
A copy of this report will be provided once available.
STATE OF THE REGIONAL WATER RESOURCE
2.2.13 The 2020-21 summer was dry for much of New Zealand, although most of Horizons
region experienced near normal rainfall (Figure 9). However, Tararua District
experienced low rainfall during the summer, along with Hawkes Bay and other eastern
areas. The beginning of autumn saw above-normal rainfall in western Manawatū-
Whanganui, leading to above-normal soil moisture conditions. The seasonal outlook
for rainfall is about equally likely to be below normal or near normal.Figure 9 Hydrological status as determined by rainfall quantities during the preceding four
months at 10 representative sites, May 2021.
2.2.14 Near normal rainfall during summer has helped support groundwater levels,
particularly welcome at a time when water demand is highest (Figure 10). At the
beginning of autumn, groundwater levels were showing signs of recharge and only
8% of the bores Horizons monitors were considered low with almost 75% above
average or better.Figure 10: Groundwater level status as determined by monthly monitoring at 130 bores,
May 2021.
2.2.15 Summer river flows reached, or have since reached, restriction limits in parts of the
region. Lowest levels were reached in late March or early April. Figure 11 shows the
river flow status as at 3 May 2021 compared to the same date in 2020.Figure 11: Hydrological status a s determined by river flow over the preceding four months at 11 representative si tes on 17 May 2021 (top image), compared to the same date in 2020 (bottom image). Flow bands are calculated on a daily scale based on every year in the dataset (1 Jan uary 2000 to 31 December 2018) e.g., the 5 t h percentile flow represents the lowest 5 percent of flows for every 17 May in the dataset.
2.2.16   Table 3 provides an end-of-season summary of the days of low-flow restrictions
         experienced at flow sites across the Region and the number of consent holders who
         were affected.
Table 3: End-of-season summary of flow restriction . Days in restriction calculated from
1 November 2020 to 1 May 2021.

                                        No. of Consents
 Site Name                                                 Days in Restriction
                                        linked to site
 Hautapu at Alabasters                                 2                    47
 Kai Iwi at Handley Road                               1                    26
 Kumeti at Te Rehunga                                  1                    73
 Makakahi at Hamua                                     1                    30
 Makino at Boness Road                                 2                     0
 Makotuku at Raetihi                                   1                    37
 Manakau at SH 1 bridge                                3                     0
 Manawatū at Hopelands                                11                    46
 Manawatū at Teachers College                         17                     8
 Manawatū at Upper Gorge                               4                     6
 Manawatū at Weber Road                                6                    82
 Mangahao at Ballance                                  1                     3
 Mangapapa at Troup Rd                                 1                    38
 Mangatainoka at Pahiatua Town Bridge                  6                     0
 Mangatoro at Mangahei Road                            1                    65
 Mangawhero at Pakihi Rd Bridge                       11                     0
 Ōhau at Rongomatane                                   6                     0
 Oroua at Almadale Slackline                           8                    14
 Oruakeretaki at S.H.2 Napier                          3                    14
 Pohangina at Mai’s Reach                              5                     3
 Rangitīkei at Mangaweka                               6                    25
 Rangitīkei at McKelvies                              14                     0
 Rangitīkei at Onepuhi                                11                     0
 Rangitīkei at Pukeokahu                               1                    13
 Raparapawai at Jackson Rd                             1                    13
 Tamaki at Stephensons                                 4                    53
 Tamaki at Water Supply Weir                           1                    79
 Tiraumea at Ngaturi                                   4                     7
 Tokiahuru at Junction                                10                     0
 Tokomaru at Riverland Farm                            4                     0
 Turakina at Otairi                                    1                    15
 Waikawa at North Manakau Road                         1                     0
 Waitangi at Tangiwai                                  1                    48
 Whangaehu at Kauangaroa                               3                    19
 Whanganui at Te Maire                                 4                    26

2.2.17   Of the 157 surface-water consents across the region which have low flow restriction
         conditions, 57% (89) experienced some period of restriction over the low-flow season
         from 1 November 2020 to 30 April 2021. Thirty of these consent holders experienced
         30 or more days in restriction, meaning they had to either cease or substantially
         decrease their abstraction volumes. The flow site with the largest number of days with
         flows below minimum flow was Manawatū at Weber Road, recording 82 day of
         restriction. There are six consents linked to this site.
Figure 12: End-of-season summary of flow restriction displayed by l ocation of sites (from Table 3) and the number of days in restriction.
2.2.18   The telemetered water-use programme continues with the programme of annual
         inspections progressing well. At the time of writing 321 completed, 44 more than last
         year’s total and 45 more than last year at the same time. Work will continue over the
         winter with a further 280 assessments, many of which are industrial, to be completed.
         New sites are prioritised over those which power-off over winter. Seventy-nine sites
         have been upgraded to the new equipment and a further 15 sites require telemetry
         to be installed, six of which are challenging due to limited network availability and
         some involving portable pumps. However, the team will endeavour to have them
         installed before next summer.

2.2.19   Reports

Mercer, R., Mitchell, J., Brown, L., Peet, N., and Roygard, J. (2021). National Environmental
Standard for Stock Exclusion – Implications for Consenting of Water Abstractions. Report No
20-158 to the Horizons Regional Council Strategy and Policy Committee, 10 November 2020.

         LAKES MONITORING
2.2.20   The ecological condition of eight lakes was assessed during December 2020 using the
         LakeSPI Submerged Plant Indicators survey method. Rotokawau (known as Virginia
         Lake in Whanganui) and Hokowhitu (Centennial Lagoon in Palmerston North, were
         surveyed for the first time while the remaining six lakes (Alice, Dudding, Namunamu,
         Pauri, Pukepuke Lagoon, and Wiritoa) were last surveyed in 2015-16.

2.2.21   Of the two new lakes, Hokowhitu Lagoon was categorised in excellent condition and
         Lake Rotokawau in moderate condition. The Hokowhitu Lagoon, while shallow at
         approximately 2.4 metres, maintained a native plant community extending across the
         bottom and no impact from invasive weed species. Lake Rotokawau retained elements
         of native vegetation while also being impacted by the invasive weed Egeria densa and
         an extensive algae bloom was also present at the time of the December survey.

2.2.22   All six lakes re-surveyed in 2020 remained in a stable condition. However, New
         Zealand’s worst submerged weed species, Hornwort (Ceratophyllum demersum), was
         recorded for the first time at LakeSPI sites in Lake Namunamu, near Hunterville, as it
         continues to spread around the lake.
Photo 1: Photo montage of LakeSPI field sampling (December 2020) in Horizons
Region.
2.2.23 LakeSPI has been used to assess the condition of 47 lakes in the Manawatū-
Whanganui Region with LakeSPI indices for lakes ranging from 0% (heavily impacted)
to 97% (pristine, unimpacted). Eleven lakes were categorised in excellent condition,
five in high condition, 18 in moderate condition, eight in poor condition and five as
being non-vegetated (Figure 13). The final report will be completed by 31 May 2021.
This monitoring will inform assessment of lake state against new water quality
attributes required under the 2020 NPS-FM.
Figure 13: The percentage of surveyed lakes (n=47) that fall into each of the five LakeSPI
categories. Numbers i n brackets show the number of lakes in each category.2.2.24 Microplastics are among contaminants of emerging concern for aquatic systems. The
Global Lake Ecological Observatory Network (GLEON) has begun a study named
Global Lake Microplastics (GALACTIC), and Horizons participated by sampling
Lake Wiritoa and Lake Pauri, both near Whanganui, in November 2020. The objective
is to sample lakes worldwide to identify the occurrence of microplastics in surface
water of different freshwater systems based on watershed and lake features e.g.,
land-use, population and catchment area. Samples were sent to the University of
Milano-Bicocca in Italy for processing free of charge. There are now 57 lakes included
in the project with 18 analysed so far with techniques ranging from visual
identification to Raman Spectroscopy, and analysis was planned to conclude within
months. This will lead to a collective research paper drafted by the end of the year,
helping to advance global research around microplastics in freshwater systems.
2.2.25 Reports
Burton, T. (2021). Assessment of 47 lakes in the Manawatū-Whanganui Region using LakeSPI.
NIWA Client Report prepared for Horizons Regional Council. This report will be provided once
finalised.
ESTUARY ECOLOGICAL CONDITION MONITORING
2.2.26 Ecological condition and/or sedimentation monitoring of five estuaries across four
FMUs was conducted by Salt Ecology in December 2020.
2.2.27 Fine-scale intertidal monitoring of Whanganui Estuary (Whanganui Kai Iwi FMU) was
the culmination of a baseline of three annual ecological surveys undertaken between
January 2019 and December 2020. One of the questions raised in the January 2020
survey report was whether the significant sedimentation measured at Site A in
January 2020 was a reflection of a change in the catchment e.g., land disturbance, a
climatic event that delivered a large pulse of sediment, and/or simply reflected a
highly dynamic sedimentary environment. The present survey, which revealed a
variable macrofauna community at Site A, coupled with the loss of sediment plates
and pegs, suggest that the estuary environment is relatively dynamic and experiences
naturally-driven temporal variability consistent with its river-dominated nature.
2.2.28 Annual sediment monitoring in the Whangaehu Estuary (Whangaehu FMU) has been
undertaken since January 2018 to assess trends in the deposition rate, mud content
and oxygenation of intertidal sediments. There are not enough data to calculate the
five-year mean sedimentation rate, however the annual changes show the
Whangaehu Estuary is highly dynamic and remains under pressure from fine
sediments in catchment run-off.
2.2.29 Annual sediment monitoring in the Manawatū Estuary (Manawatū FMU) has been
undertaken since January 2017 to assess trends in the deposition rate, mud content
and oxygenation of intertidal sediments. There are not yet enough data to calculate a
five-year mean sedimentation rate but this is due in 2022. The results to date indicate
that despite observed erosion, the estuary remains under pressure from sediment
impacts, with a macrofaunal community likely dominated by mud-tolerant species – a
common situation in New Zealand tidal river estuaries.
2.2.30 Synoptic surveys of Ōhau Estuary and Waikawa Estuary (Waiopehu FMU) were
conducted in December 2020 to quantify the ecological condition of the subtidal
reaches. The survey targeted locations that showed symptoms of nutrient enrichmenti.e., algal blooms and depleted oxygen in stratified areas when previously surveyed in
January 2020. The results from December 2020 show some improvement in sediment
condition and water quality in both the Ōhau Estuary and Waikawa Estuary compared
to January 2020, likely as a consequence of recent flushing following heavy rainfall in
the week prior to the most recent sampling. The results show that the estuaries
remain under pressure from nutrient and sediment loads and continue to express
signs of eutrophication. As recommended in the report, Horizons is undertaking
bathymetric surveys of the estuaries to enable accurate delineation of areas likely to
stratify, and to inform the development of hydrodynamic models. These models will
be used to estimate nutrient concentrations and predict ecological outcomes of future
nutrient and sediment management in the catchment, and have been commissioned
via the Jobs for Nature Project.
2.2.31 Reports produced
Whanganui and Kai Iwi FMU:
Forrest BM, Roberts KL, Stevens LM. 2021. Fine Scale Intertidal Monitoring of Whanganui
Estuary. Salt Ecology Report 065, prepared for Horizons Regional Council, March 2021. 31p.
Whangaehu FMU:
Roberts KL. 2021. Whangaehu Estuary Sediment Monitoring Short Report. Salt Ecology Short
Report 004, prepared for Horizons Regional Council, March 2021. 2p.
Manawatū FMU:
Roberts KL. 2021. Manawatū Estuary Sediment Monitoring Short Report. Salt Ecology Short
Report 003, prepared for Horizons Regional Council, March 2021. 2p.
Waiopehu FMU:
Roberts KL, Stevens LM, Forrest BM. 2021. Synoptic Subtidal Monitoring of Ōhau Estuary,
Manawatū. Salt Ecology Report 064, prepared for Horizons Regional Council, April 2021. 37p.
Roberts KL, Stevens LM, Forrest BM 2021. Synoptic Subtidal Monitoring of Waikawa Estuary,
Manawatū. Salt Ecology Report 063, prepared for Horizons Regional Council, March 2021. 39p.
COASTAL MARINE AREA MAPPING
2.2.32 The CMA of Horizons region encompasses approximately 3,000 km2 of territorial sea
comprising distinct and separate western and eastern coastlines. Horizons manages
the CMA in accordance with its combined Regional Policy Statement and the One Plan,
a key objective being to ensure that the natural character and ecosystem processes
are maintained while still allowing activities and development. Funded through an
MBIE Envirolink Advice Grant, NIWA was commissioned by Horizons to report
information on three CMA priority areas identified during a previous Envirolink
project:
2.2.33 1. Seafloor biota information for the western and eastern CMAs to describe the likely
distribution of biogenic habitat5-forming species and the distribution of corals and
other vulnerable benthic6 species.
5
Biogenic habitats are habitats produced by living organisms.
6
The benthic zone is the ecological region at the lowest level of a body of water such as an
ocean, lake, or stream, including the sediment surface and some sub-surface layers.2.2.34 2. Threatened marine mammal and marine invertebrate distribution information for
the western and eastern CMAs.
2.2.35 3. Predicted distribution of reef and demersal 7 (living near the sea floor) fish species
in the eastern CMA.
2.2.36 The habitat suitability and species occurrence modelling maps provide important
information on the potential distribution of vulnerable marine invertebrates (corals),
marine mammals, and reef and demersal fish, which allows the identification of
important habitats and areas for protection and conservation. In comparison to much
of the rest of New Zealand’s coastal marine regions there are few data and datasets
available on the habitats, fauna and flora of the Horizons CMAs. Considerably more
information was available for the western than the eastern CMA, which appears to
have a paucity of data on both marine habitat types and associated species diversity.
2.2.37 Horizons has a commitment within its Regional Policy Statement and Regional Plan
(One Plan) to ensure that the natural character and ecosystem processes are
maintained. This includes maintaining the life- supporting capacity and social and
economic values of the region’s coastal marine area (CMA). This project will inform:
future policy development e.g., through identification of probable significant or
vulnerable habitats/species that may require specific management; assessment of
resource consent applications; and Horizons’ SOE reporting for the CMA. It will also
build on our existing baseline knowledge of the CMA for the further development of
our coastal monitoring programme, which provides the most efficient use of limited
resources.
2.2.38 Reports produced
Hale, R., Wadhwa, S., Anderson, T., Anderson, O., Hupman, K., Stephenson, F., Lundquist, C.,
Schnabel, K., and Neil, K. (2021). Seafloor habitats and fish, invertebrate and marine mammal
diversity in the Horizons Region coastal marine area. NIWA Client Report 2021069NE prepared
for Horizons Regional Council, March 2021.
CONTACT RECREATION WATER QUALITY MONITORING
2.2.39 Monitoring of 81 popular swim spots around the region began on 1 November 2020.
The programme is delivered in collaboration with MidCentral Public Health Service,
local councils and Ngā Waihua o Paerangi Trust (formerly Ngāti Rangi Trust).
Monitoring results are reported weekly, as they become available, via both Horizons
(http://www.horizons.govt.nz) and the LAWA (http://www.LAWA.org.nz) websites.
The 2020-21 contact recreation season ended on 27 April 2021.
2.2.40 The 2020-21 contact recreation data is in the process of being finalised, quality
coded and analysed before end-of-season data analysis and result dissemination to
key stakeholders. As this is the fifth year of the extended contact recreation
programme, a five-year dataset will shortly be available and staff can do an analysis
of sites across the region. It is anticipated that this will feed into a review of the wider
programme. Results across the 2020-21 season were variable. In general, beaches
sampled across the region were mostly swimmable with a few exceedances at times.
Further re-samples on these occasions, in line with recreational guidelines, did not
warrant any beach closures and returned results within the guideline values for
7
The demersal zone is the part of the sea or ocean (or deep lake) consisting of the part of the
water column near to (and significantly affected by) the seabed and the benthos.swimmability. River sites sometimes exceeded recreational guidelines for both E. coli
and potentially toxic algae thresholds across the region. The Mangatainoka River, in
particular, was graded unsuitable for swimming at times due to potentially toxic algae
levels.
2.2.41 Whanganui lakes Wiritoa and Pauri were suitable for swimming for much of the
season. Potentially toxic algae monitoring was added to Hokowhitu Lagoon this
season, and aside from a brief exceedance over the New Year period the levels were
either amber (caution advised) or green (suitable for contact recreation). Monitoring
for E. coli at Hokowhitu Lagoon began in November 2017.
2.2.42 Lake Dudding was deemed unsuitable for swimming and had warning signs erected
between 16 November 2020 and 21 January 2021 due to high bio-volumes of
potentially toxic algae.
2.2.43 Faecal source tracking was planned last season and had to be delayed because of
COVID-19. During the 2020-21 season, samples were taken at all lakes monitored for
contact recreation, as well as a number of sites along the Wainui Stream (coastal
Tararua). Samples were tested for E.coli concentrations and those that exceeded the
amber alert level for contact recreation (greater than 260 MPN/100 mL), or close to
this threshold, were further analysed for human, avian, ruminant markers and a
general DNA marker. A summary of results for sites that were able to progress to
faecal source tracking can be seen below in Table 3 (lakes) and Table 4 (Wainui
Stream). NB: the threshold for the red alert level is 550 MPN/100 mL.
Table 4: Faecal-source tracking results for lake samples during the 2020 -21 season
Site E.coli (MPN/100 mL) Conclusion
Stormwater drain at lake Pauri 140 Species-specific faecal source not identified
Lake Dudding 620 Faecal source – avian
Hokowhitu Lagoon at Outlet 1,900 Species-specific faecal source not identified
Table 5 Faecal source-tracking results for Wainui Stream during the 2020 -21 season
Site E.coli (MPN/100 mL) Conclusion
Wainui u/s Wimbledon Stream 1,700 Faecal source – ruminant (50 - 100%)
Faecal source – ruminant (50 - 100%)
Wainui d/s Wimbledon Stream 210
plus avian
Wainui u/s Waikopiro Stream 230 Faecal source – ruminant (10 - 50%)
Wainui d/s Waikopiro Stream 340 Faecal source – ruminant (10 - 50%)
Wainui u/s Mangaone Stream 130 Faecal source – ruminant (10 - 50%)
Wainui d/s Mangaone Stream 760 Faecal source – ruminant (50 - 100%)
Faecal source – avian plus possibly low level
Wainui u/s Herbertville Town 130
ruminant
2.2.44 Further analysis and reporting of the results alongside results from the contact
recreation season (including past seasons), land-use and current interventions is
underway.2.2.45 Further faecal source sampling on the Ōngarue River (Whanganui FMU) is underway
and faecal-source tracking around the Arawhata Stream is planned as part of the
wider work programme around Lake Horowhenua.
2.2.46 Other work underway includes a review of all of the contact recreation signage across
the region and the ‘Can I Swim Here?’ campaign, ahead of the 2021-22 season. This
will include additional information on the risk of drowning, following a coroner’s report
into a drowning in the region.
PLAN CHANGE 2 SUPPORT
2.2.47 Plan Change 2 was focussed on amending implementation issues with the nutrient
management framework in the One Plan, including changes to Overseer and the
inability to apply for consent if leaching was in excess of One Plan Table 14.2.
2.2.48 A team of science staff and external consultants provided support as technical experts
to the Plan Change 2 process. Much of the work in the lead up to the plan change
was carried out in the 2019-20 financial year. Preparation of evidence, caucusing and
appearance before the hearing panel during the 2020-21 financial year.
2.2.49 Scientific evidence covered: the impact on water quality from proposed changes to
the table; modelling for outcomes as a result of the new rule framework being
implemented; soil science and Overseer changes;
on-farm management practices; good management practice; and economics.
2.2.50 Reports produced
Technical reports related to this process can be found on the Horizons website:
http://www.horizons.govt.nz/publications-feedback/publications/plan-change-2-documents
ESSENTIAL FRESHWATER IMPLEMENTATION
2.2.51 On 28 May 2020 the Government released the essential freshwater package, which
included an amended National Policy Statement for Freshwater Management
(NPS-FM) 2020 and a National Environmental Standard for Freshwater (NES-
FW). Oranga Wai - Our Freshwater Future is the way Horizons has chosen to
represent the Essential Freshwater package and to allow for cohesion across the
freshwater work we undertake.
2.2.52 Science staff have been undertaking a gap analysis of requirements of regional
councils under both the NES-FW and NPS-FM and are subsequently developing a
detailed science work programme for the next four years to support the Oranga Wai
process.
2.2.53 Part of this development included commissioning LWP to lead a think piece around the
role of science in the process and how it can best support the policy team to deliver
Oranga Wai. This report was finalised in May 2021 and is available to council.
2.2.54 Reports produced
Snelder, T., Harris, S., Norton, N., Robson-Williams, M., Roygard, J., and Matthews, A. (2021).
Horizons Regional Council science plan. LWP (landwaterpeople) Client Report 2019-10
prepared for Horizons Regional Council, May 2021.STATE AND TRENDS OF WATER QUALITY
2.2.55 As part of the Oranga Wai processs, stocktake documents for each of the identified
Freshwater Management Units are being compiled by the policy team. Science staff
have been involved in the compilation of scientific information about the catchments,
which included updating the state and trends of water quality for the period ending
December 2019.
2.2.56 LWP were commissioned to undertake this analysis as an update to the 2019 SoE
report. The analysis calculated the state of water quality as compared to the NPS-FM
2020 National Objectives Framework and the trend in water quality and biological
indicators for both a 10-year and 20-year period. The data from the SoE river
physico-chemical and biological monitoring programmes were collated to December
2019 and provided to facilitate this update.
2.2.57 The outputs of the analysis were completed by LWP in February 2021 alongside a
short technical report outlining the methods used and a brief summary of results. The
results of this analysis are being incorporated into the catchment stocktake reports
and for updating the catchment summary report cards that were produced following
the 2019 SoE Report.
2.2.58 Reports produced
Fraser, C., and Snelder, T. (2021). Updated State and Trends of River Water Quality in the
Manawatū-Whanganui. LWP Client Report 2021-02 prepared for Horizons Regional Council,
January 2021.
SUMMER BIOMONITORING PROGRAMMES
2.2.59 Summer water quality monitoring includes a range of projects on biological
monitoring in the Horizons region, including macroinvertebrate, periphyton and fish
monitoring. Much of this monitoring is flow dependant, so low flows and stable
weather conditions throughout summer allowed significant progress to be made.
2.2.60 Freshwater aquatic macroinvertebrates provide a holistic view of water quality at a
point as they are resident in a given water body for several months up to several
years at a time. A metric named the Macroinvertebrate Community Index (MCI)
and its variants measures the taxa composition i.e., which macroinvertebrates are
found there, at a site and are used to indicate nutrient enrichment. This monitoring
can only be undertaken during low-flow periods.
2.2.61 Long-term macroinvertebrate monitoring is critical in measuring our current state and
progress against measures in the One Plan and NPS-FM (2020).
2.2.62 Sampling for macroinvertebrates was completed by end of March for 95 sites, with all
samples sent to laboratories for processing. These results are expected due in the
middle of the 2021-22 financial year. All results are displayed on the LAWA website
and are incorporated with relevant state and trends assessments as they are
undertaken.
2.2.63 Periphyton is the community of alga, cyanobacteria and fungi living on the beds of
rivers and streams, and is important as a measure of nutrient enrichment. Both the
One Plan and NPS-FM include periphyton measures that the regional council are
required to meet.2.2.64 Periphyton monitoring has continued on a monthly basis throughout the 2020-21
financial year at 63 sites. This data either was, or will continue to be, incorporated
into state and trend reports for the region’s waterways.
2.2.65 Freshwater fish monitoring is undertaken yearly at 12 SoE monitoring sites.
Surveying, including both electric fishing, and netting and trapping was well
progressed at time of writing, with nine of 12 sites planned for the year completed.
Results are reported into the New Zealand Freshwater Fish Database (NZFFDB)
administered by NIWA. They are used in our SoE reporting and will be used in part for
assessing Horizons against the NPS-FM fish Index of Biotic Integrity (IBI)
attribute.
2.2.66 Sampling undertaken on behalf of, or in conjunction with, consent holders Tararua
District Council and Palmerston North City Council were completed successfully and
results forwarded to the consent holders.
2.2.67 Surveys for didymo (Didymosphenia geminate) are undertaken in November,
February and May each year at 14 sites across the region. May sampling had not been
undertaken at the time of writing but all prior results were negative.
GROUNDWATER QUALITY MONITORING AND DRINKING WATER
MANAGEMENT
2.2.68 Horizons monitors groundwater quality in 35 bores around the region on a quarterly
basis. The aim of this programme is to monitor the general state and trends of the
groundwater resource and is similar to the river water quality monitoring programme.
A range of parameters are collected including nutrients, metals, anions and field
parameters. Nitrate is most associated with poor groundwater quality.
2.2.69 Elevated nitrate is often the result of agricultural land use or wastewater disposal. It
is soluble in water and easily transported with groundwater to waterways, where it
contributes to the growth of nuisance algae. Nitrate can also cause health issues,
particularly for infants, as it can inhibit the ability of red blood cells to release oxygen
to tissues (known as methemoglobinemia). To manage potential human health
consequences, the New Zealand Drinking Water Standards (DWSNZ) sets the
maximum acceptable value (MAV) for nitrate-nitrogen at 11.3 mg/L to prevent
effects on pregnant women and bottle-fed infants.
2.2.70 More recently, concern for human health has grown out of a potential link between
nitrate and cancer. A Danish study found a link with bowel cancer when nitrate-
nitrogen levels were as low as 0.87 mg/L. However, at this stage no MAV or limit has
been established for cancer as it has been for methemoglobinemia.
2.2.71 At our last review of groundwater state and trends in the 2019 SoE report, nitrate
concentrations were well below the drinking water standard across most of the region,
but elevated in at some sites in Horowhenua and Tararua (Figure 14). Within the
region, three of the monitoring bores show concentrations that are above the drinking
water standard, including some deeper bores greater than 50 metres deep). Both
short-term (five-year) and long-term (10-20 year) trends in nitrate concentrations are
generally indeterminate or improving, with only one bore to the north-east of Levin
showing a slight degrading trend over five year and a bore near Whanganui showing a
small magnitude of degrading long-term trend.Figure 14: Median nitrate-nitrogen concentrations in bores across Horizons region
2.2.72 In addition to considering the effects on groundwater quality of of land use and
wastewater disposal, it can also influenced by “reduction-oxidation” (redox) conditions
that are distinct to groundwater. Subsurface redox conditions can broadly be
described as either reduced where dissolved oxygen is low, or oxidised where
dissolved oxygen is abundant. This concept is important because it can be a major
driver of how contaminants such as nitrate persist in subsurface environments.
2.2.73 Reduced water is typically decades old or more and has less dissolved oxygen and
generally lower nitrate concentrations but higher levels of minerals such as iron and
manganese. This is because reduced-oxidation water has generally travelled further
and had more time to interact with soil and rock particles, changing its chemistry over
time. Elevated levels of naturally-occurring heavy metals can make groundwater
unsuitable for drinking in some areas.
2.2.74 Oxidised water is typically younger, generally days or months through to a few years
old. Groundwater in these gravel-rich aquifers tends to move more quickly and water
is more oxygenated, with lower concentrations of dissolved metals. These zones are
more susceptible to elevated levels of nitrate as they lack the natural conditions to
attenuate nitrogen, i.e., denitrification – where nitrate is converted to benign
molecular nitrogen in low oxygen environments. Oxygen-rich water generally is found
near the surface in shallow aquifers such as in Tararua, but can also occur at depth in
gravel and sand basins such as in Horowhenua.
Where drinking water is concerned, both surface water and groundwater are considered
“raw water” when they have not received any treatment to make them suitable for
drinking. The quality of the raw water must be good enough to produce safe and
acceptable drinking water when treated. Once raw water is treated the Drinking-
water Standards for New Zealand (DWSNZ) standards are applied. According toNew Zealand’s Water Safety Plan Guide, in many cases it can be better to protect the
quality of the raw water than to treat it after it has become contaminated.
2.2.75 The provision of drinking water is managed primarily by district or city councils (TAs)
but regional councils have a role especially in the management of source protection
zones (SPZ). SPZs are used to help assess the level of risk to a drinking water
source by identifying three areas, or zones, around a water abstraction point (bores).
SPZ I is closest to the abstraction point and activities within it present a high risk;
those farthest away, in SPZ III, present a low risk.
2.2.76 Horizons has been working with the TAs in our region to assess their drinking water
supplies and develop SPZs for each abstraction point. For groundwater abstraction
points the primary risk comes from unsecured bores in SPZ I and II that may present
a risk to drinking water supplies by allowing pathogens into the aquifer from which
raw water is drawn.
2.2.77 In addition to the work with TAs, the One Plan (Policy 5-6 (a)) requires that
discharges and
land-use activities, including diffuse run-off and other land-use activities, affecting
surface and groundwater quality are managed to ensure the maintenance of existing
groundwater quality and improvement where it is degraded as a result of human
activity.
2.3 Regional Land and Fluvial programme
2.3.1 This is the annual report for the fluvial component of the land and fluvial monitoring
and research activity.
FLUVIAL PROGRAMME
2.3.2 The fluvial survey programme has been completed for 2020-21 as part of a long-term
survey plan that has been developed cross-organisationally and overseen by the
engineering investigations and design team. This project funds cross-section surveys
and reports to provide information on the changes in levels due to aggradation and
degradation, or river channels and berms to inform river management and decision-
making about gravel extraction.
2.3.3 The focus for the fluvial programme in 2020-21 was completion of the remaining four
catchments in the South-eastern Ruahine area which were paused due to COVID-19
Level 4 and Level 3 restrictions, the Kawhatau Catchment and Rangitīkei Catchment
fluvial surveys.
2.3.4 The Kawhatau and Rangitīkei catchment fluvial surveys were carried out using Light
Detection and Ranging (LiDAR) with the wetted channel being bathymetrically
surveyed. The Kawhatau is considered a key gravel resource for the Rangitīkei River.
LiDAR has enabled the survey to extend both upstream and downstream of previous
surveys, which focused on gravel extraction beaches only to further our
understanding of the fluvial processes occurring throughout the wider catchment.
These surveys will inform gravel resource studies for both catchments, due to be
completed in the 2021-22 financial year. The LiDAR 3-dimensional survey is also
being used to help inform the Climate Resilience Rangitīkei River Enhancement project
below Bulls.2.3.5 Historical aerial imagery orthorectified by removal of distortion across an image
because of how the sensor has captured information from above the above the earth’s
surface, acquired in 2020-21 will be used to carry out geomorphic analysis to examine
the connectivity and sensitivity of the Manawatū and Rangitīkei catchments. The
historical imagery is a valuable resource for other parts of the organization, including
informing coastal erosion and accretion, identification of hazardous activities and
industries, land-use change and assessing erosion control susceptibility, and review of
river and drainage scheme management.
2.3.6 Work is underway with consent planning staff and regional engineers to review best
practice guidelines for gravel extraction. Horizons has commissioned Professor Ian
Fuller of Massey University to provide recommendations for technical assessments
and best-practice guidelines for gravel extraction and monitoring requirements to
ensure catchment integrity, habitat and ecosystem health are appropriately
monitored. A copy of the report will be made available once finalised.
2.3.7 Reports produced
Fuller, I. Gravel Extraction Habitat Advice. Massey University, prepared for Horizons Regional
Council. This report will be made available once finalised.
LAND PROGRAMME
Soil map coverage - Horowhenua
2.3.8 The land programme for the 2020-21 (and 2021-22) is focussed on obtaining S-Map
coverage for the lowland area of the Horowhenua FMU. S-Map is the national online
geospatial soil information system held and maintained by Manaaki Whenua. It is the
only active and consistent soils database across the country. This data will be used to
support the Our Freshwater Future – Oranga Wai process and provide more accurate
soil information than currently available for catchment modelling. The land science
budget is fully allocated to this project over the 2020-21 and 2021-22 years. This
project has taken advantage of an opportunity provided by the Ministry for Primary
Industries offering funding for two-thirds of the total cost of the project, provided to
support the availability of better soil information in areas with highly productive land
uses. The land area covers 23,300 ha of lowlands in the Horowhenua FMU. A progress
report is due in June 2021, the final shapefiles will be available for internal use in
June 2022 and the data will be available publicly online on the Manaaki Whenua S-
Map website in August 2022.
Regional Land use map
2.3.9 Over the 2020-21 year, a land use map was updated for the region (funded internally
by the Policy and Strategy team). Horizons commissioned Manaaki Whenua –
Landcare Research to provide an updated land-use map as well as the provision of a
tool to enable Horizons to update land-use information on a regular basis.
2.3.10 The land-use classification combines multiple classifications from a range of sources
including AgriBase, Land Cover Database v5.0, Horizons Regulatory data, the
Sustainable Land Use Initiative (SLUI) Whole Farm Plans, and Valuation and
ratings data. A Land Use Management Support System (LUMASS, an open source
spatial modelling tool) model for the automatic update of the land-use classification
was developed, which allows us to update the land-use layer as updated inputdatasets become available. This map will be used to help inform the Our Freshwater
Future process and ongoing support for freshwater accounting.
Sediment Source and Transport
2.3.11 Horizons is a partner in the Smarter Targeting of Erosion Control (STEC),
programme led by Manaaki Whenua Landcare Research in partnership with iwi, NIWA,
regional councils and stakeholders. Key progress during year three of this five-year
programme included continuing the measurement and monitoring of shallow
landslides and earthflows, and quantifying the influence of tree planting on slope
stability. Advances were made in the development of a Temporal Erosion and
Sediment Transport (TEST) model to examine the effects of soil erosion on water
quality. TEST will characterise where and when soil erosion occurs, what type of
sediment is produced and how that sediment moves through catchments.
2.4 Whanganui and Kai Iwi FMU
2.4.1 This financial year, as a part of the freshwater programme, excluding the land
programme), 9.432 km of stream fencing and 3,050 riparian plants have been
allocated, 5.315 km of stream fencing completed and 1,693 riparian plants planted
within the Whanganui Catchment. Some 9.235 km of stream fencing and 3,480
riparian plants have been allocated, and 1.925 km of stream fencing completed along
the Kai Iwi and Ototoka streams in the Kai Iwi Catchment.
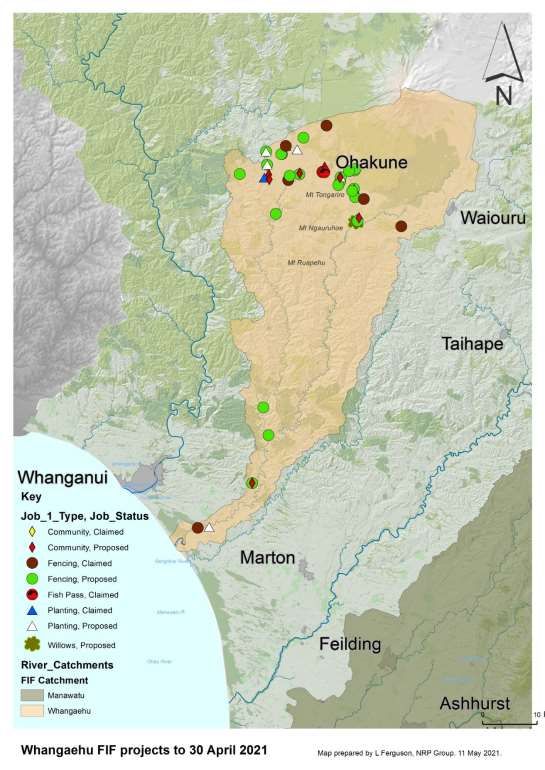
2.5 Whangaehu FMU
WHANGAEHU FRESHWATER IMPROVEMENT FUND (FIF) PROJECT
2.5.1 This programme focuses on the delivery of the Ngā Wai Ora o Te Whangaehu FIF
project, which focuses on the protection and enhancement of waterways within the
Whangaehu Catchment. The main components of the programme are supporting
stock exclusion from waterways, riparian enhancement and planting where desirable,
aquatic habitat enhancement, supporting industry and community-led initiatives, and
a joint project with Ngāti Rangi.
2.5.2 With the Whangaehu FIF project set to end in June, stream fencing and riparian
planting allocations are now fully allocated. Any new landowners and enquiries in this
catchment are being signed up under the Jobs for Nature (previously the Regional
Freshwater Programme) to enable works to be completed.Figure 15: Stream fencing, riparian planting, and community projects that are proposed to be undertaken or have been completed in the Whangaehu Catchment.
2.6        Rangitīkei-Turakina FMU
PFAS MONITORING FOR OHAKEA
2.6.1      Horizons has been working with the New Zealand Defence Force (NZDF) on the
           ongoing monitoring of per- and ploy-fluoroalkyl substances (PFAS) and related
           compounds around Ohakea Air Force Base. PFAS are a large group of manufactured
           compounds that have industrial and consumer applications and have been in
           firefighting foam used at the base. A monitoring programme was specially designed
           by Pattle Delamore Partners Ltd this year to monitor the movement of the PFAS
           plume over time8.

2.6.2      The first round of sampling was undertaken in September 2020 with preliminary
           results showing PFAS concentrations either similar to, or slightly below, the ranges
           previously recorded for existing monitoring locations. These results are in general
           agreement with the predictions from the groundwater modelling. A copy of the report
           is now available on Horizons’ website and has been shared with the Ohakea Water
           Contamination Committee and Manawatū District Council. The second round of
           sampling was undertaken in February 2021 and reporting will follow later this year.

2.6.3      Reports produced

PDP (2021) Ohakea: Surface Water and Groundwater Monitoring for PFAS, October 2020.
Pattle Delamore Partners Ltd Client Report prepared for Horizons Regional Council, February
2021.

STREAM FENCING AND PLANTING
2.6.4      This financial year the Freshwater and Partnerships Programme has allocated 21.380
           km of stream fencing and 38,810 riparian plants within the Rangitīkei – Turakina FMU.
           To date, 8.491 km of stream fencing has been completed and 23,479 riparian plants
           planted. Please note this excludes the Land Management Programme works.

FLUVIAL RESEARCH
2.6.5      The Kawhatau and Rangitīkei catchment fluvial surveys are reported on in the Land
           and Fluvial monitoring and research annual report above.

LAKE WAIPU/RĀTANA FRESHWATER IMPROVEMENT FUND (FIF) PROJECT
2.6.6      As part of the FIF project, Horizons commissioned NIWA to complete a native and
           pest fish survey of Lake Waipu on 7 and 8 December 2020. This work aims to
           understand the availability of host species for kakahi (freshwater mussel) recruitment
           within the lake and the ongoing sustainability of the kakahi population. The native
           species shortfin and longfin eels, and common bully were found in the lake with the

8
    PDP (2020) RNZAF Base Ohakea PFAS Investigation: Long Term Monitoring Plan
You can also read