Water Stress and a Changing San Joaquin Valley - Public ...
←
→
Page content transcription
If your browser does not render page correctly, please read the page content below
MARCH 2017

Ellen Hanak,              Water Stress and
Jay Lund,
Brad Arnold,              a Changing
Alvar Escriva-Bou,
Brian Gray,               San Joaquin Valley
Sarge Green,
Thomas Harter,
Richard Howitt,
Duncan MacEwan,
Josué Medellín-Azuara,
Peter Moyle,
Nathaniel Seavy
with research support
from Jelena
Jezdimirovic
Supported with funding
from the S. D. Bechtel,
Jr. Foundation, the
TomKat Foundation,
and the US
Environmental
Protection Agency
© 2017 Public Policy Institute of California
PPIC is a public charity. It does not take or support positions
on any ballot measures or on any local, state, or federal
legislation, nor does it endorse, support, or oppose any political
parties or candidates for public office.
Short sections of text, not to exceed three paragraphs, may be
quoted without written permission provided that full attribution
is given to the source.
Research publications reflect the views of the authors and do not
necessarily reflect the views of our funders or of the staff, officers,
advisory councils, or board of directors of the Public Policy Institute
of California.
SUMMARY
CONTENTS The San Joaquin Valley—California’s largest agricultural region, and an
important contributor to the nation’s food supply—is in a time of great change
Introduction 5
and growing water stress. Agriculture is a leading economic driver and the
The Evolution of San
predominant water user. The region’s farms and related manufacturing
Joaquin Valley
Agriculture 8 businesses account for 25 percent of the valley’s revenues and 16 percent of
Water Scarcity: A Major local jobs—and 89 percent of annual net water use.
Challenge 13
The latest drought underscored valley agriculture’s vulnerability to water
Related Challenges scarcity and long-term declines in groundwater reserves. The region has a
for Water and Land
Management 20 greater abundance of productive farmland than local water supplies for
Management Strategies irrigation. In most years since the mid-1980s, groundwater has been used faster
and Approaches 27 than it is being replenished (“groundwater overdraft”). Over the past three
Crafting Solutions decades, overdraft has averaged nearly 2 million acre-feet per year, or 13
Within a Complex percent of net water use. This has contributed to increased pumping costs, dry
Institutional Landscape 37 wells, sinking lands, and declining reliability of this vital drought reserve.
Conclusion 42
The Sustainable Groundwater Management Act of 2014 (SGMA) requires
References 43
valley farms and communities to bring their groundwater basins into balance
About the Authors 47 by 2040. Farms must also respond to a variety of related resource and
Acknowledgments 48 environmental challenges. Notable issues include nitrate contamination of
groundwater—a special challenge in poor, rural communities—as well as
Technical appendices to accumulating salinity in soils, local air pollution, and the broad decline in
this report are available aquatic, wetland, and terrestrial ecosystems.
on the PPIC website.
With so many changes underway, major questions loom about the future of the
valley’s agriculture and the wider consequences for the region’s economy,
society, and environment. Several broad strategies can help address the valley’s
water imbalance and related problems:
Manage groundwater reserves: Groundwater sustainability agencies
being formed under SGMA will need solid water accounting tools to
understand how much water is available and how much is being
withdrawn. They will also need the ability to incentivize both recharge
and reductions in pumping to attain long-term groundwater balance.
Expand usable supplies: Capturing and storing more local runoff in
groundwater basins and reusing water would help reduce the current
deficit in the near term. Longer term, larger infrastructure investments
such as improved water conveyance from the Delta could help.
Reduce demand: Although farmers can save some water through
crop choice and management, idling some farmland is also likely in
basins that cannot close the groundwater deficit with new supplies.
Water trading—both within and across basins—can lessen the costs
of shortages.
PPIC.ORG/WATER Water Stress and a Changing San Joaquin Valley 3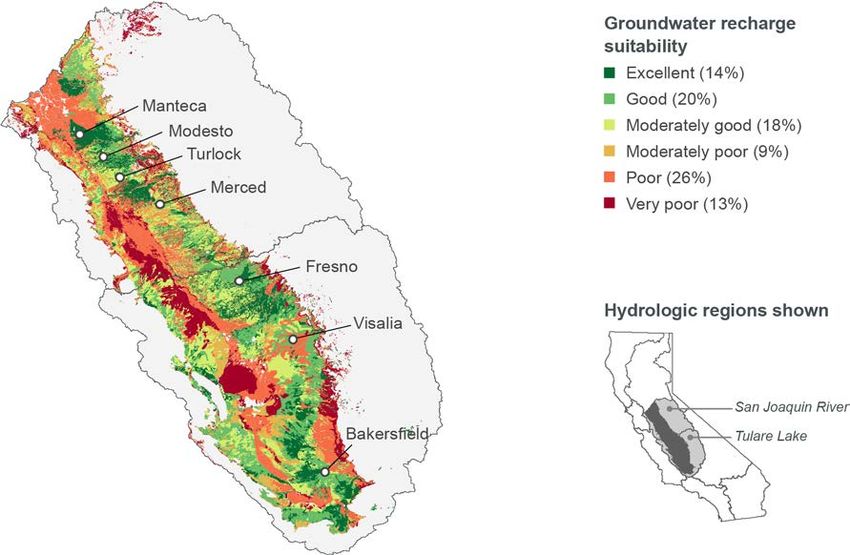
Explore multi-benefit strategies: Opportunities exist to manage groundwater recharge in ways that
improve water supply and quality—for example, by tailoring irrigation systems and crop choices to
maximize clean recharge in prime areas. Similarly, with the right incentives and regulatory assurances,
idled lands can be managed to reduce impacts on air quality while improving wildlife habitat.
Valley farmers and residents have a history of creatively adapting to changing conditions. In meeting today’s
challenges, there are numerous opportunities to tackle problems cooperatively. But the valley also has a
complex mix of entities and institutions managing water and land. Perhaps one of the region’s greatest
challenges is developing new cooperative approaches to seize these opportunities. The entire region—and
California as a whole—will benefit if solutions to the valley’s problems support the economy while
improving public health and environmental conditions.
PPIC.ORG/WATER Water Stress and a Changing San Joaquin Valley 4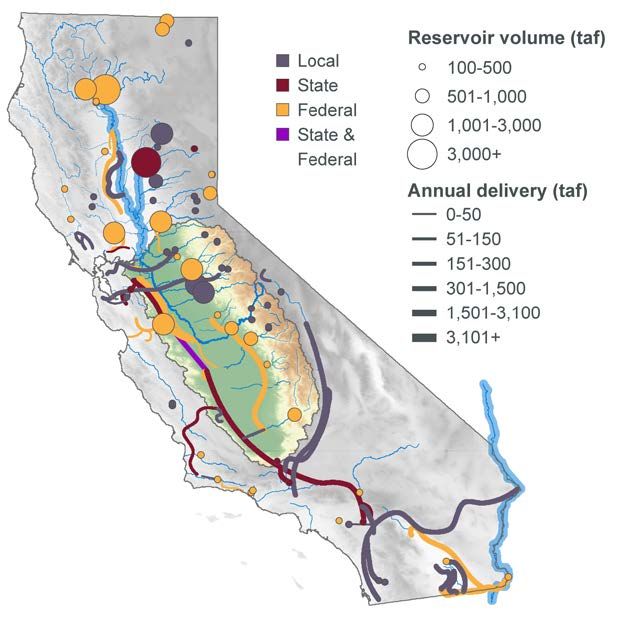
Introduction
The San Joaquin Valley—a region stretching from the confluence of the Sacramento and San Joaquin Rivers in
the north to the Tehachapi Mountains in the south—is a global agricultural powerhouse. Valley farms produce
half of California’s total farm output—including most fruits, nuts, dairy, vegetables for processing, and livestock
feed—and they are major suppliers to national and international markets. Farming and related businesses are an
important economic driver of this growing region, which is now home to more than 4 million people.
Like many agriculturally dependent regions, the valley faces significant socioeconomic challenges, including a
high rate of unemployment and pockets of extreme rural poverty that worsen when the farm economy suffers. The
region also faces difficult public health challenges in which farming plays a role, including unsafe drinking water
in many small rural communities and some of the nation’s worst air quality. Water and land development for
farming and urbanization have also transformed the natural environment—drying up rivers and wetlands, and
converting diverse native landscapes into farmland.
The valley’s growing conditions are favorable as long as water is available to irrigate crops during the long, dry
summers. Yet local water supplies are limited in much of the region—and particularly the southern half—by the
relatively low precipitation in winters and springs. In recent decades, many farms have depended on water
imported from wetter Northern California through the Sacramento–San Joaquin Delta to augment local supplies.
In many places, water imports have not stemmed the long-term reliance on pumping groundwater in excess of the
rate at which it is replenished. Groundwater overdraft can also cause land to sink (“subsidence”) as well as impair
groundwater quality.
Water stress in the valley has been on the rise. Delta imports to valley farming have been limited over the past
two decades—and especially since 2007—because of drought and regulatory actions to protect threatened and
endangered salmon, smelt, and other native fishes. Growing demand for Delta imports within Southern California
has also decreased valley supplies. The latest drought greatly reduced surface water deliveries to irrigators, and
heightened conflicts over regulations that constrain Delta imports. Many farmers have made up for reduced water
deliveries by pumping additional groundwater, accelerating problems of land subsidence and dry wells—
including drinking water wells in small rural communities. Concerns have also grown about the long-term
depletion of the region’s aquifers.
These problems spurred the enactment in fall 2014 of the Sustainable Groundwater Management Act (SGMA),
which requires valley communities to bring their groundwater basins into balance by 2040. 1 Achieving this goal
will protect the region’s long-term groundwater reserves, and enable its residents and economy to weather future
droughts. But attaining balance will require difficult decisions, because water use will need to drop—as will
irrigated acreage—in basins that are unable to close the groundwater deficit.
As valley growers and other residents begin the hard job of developing and implementing groundwater
sustainability plans, they must consider other changing conditions related to water and farmland. This includes
possible increases in environmental flows in some local rivers and the Delta that could further reduce surface
water for irrigation. It also includes possible declines in surface water availability as the climate continues to
warm and the Sierra Nevada snowpack diminishes, as well as increased competition with urban areas for water

1
  In this report, we use the term groundwater basin to refer to basins and sub-basins as defined by the California Department of Water Resources (2016a). A sub-basin
is created by dividing a groundwater basin into smaller units using geologic and hydrologic barriers or, more commonly, institutional boundaries. SGMA
implementation in many parts of the state, including the San Joaquin Valley, will occur at the sub-basin level. Bringing groundwater basins into balance refers to
ending long-term overdraft, such that groundwater withdrawals and groundwater levels are stabilized on average.

PPIC.ORG/WATER                                                                                  Water Stress and a Changing San Joaquin Valley                  5
and land. Water and land use decisions on farms will also be affected by efforts to address water and air quality
concerns.
With so many changes underway, major questions loom about the future of the valley’s agriculture and the
broader consequences for the region’s economy, society, and environment. We start from the premise that
managing water and land sustainably is important to achieve three broadly shared goals for the valley: (1) a
prosperous regional economy, (2) clean water and air for valley residents, and (3) a reinvigorated natural
environment that supports diverse plant and animal life and provides improved outdoor recreational opportunities
for valley residents and others.
One recurring theme in our analysis is that while the region has many common challenges, conditions also vary
considerably—both within and across communities. This diversity—for instance, in the availability and suitability
of water and land for different purposes—creates numerous opportunities to tackle problems cooperatively. But
the valley also has a complex mix of entities and institutions managing water and land. As a result, perhaps one of
the region’s greatest challenges is developing new cooperative approaches to seize these opportunities.
The story of water and land use in the San Joaquin Valley—and its consequences for the region’s economy,
public health, and natural environment—is a story of continuing change and adaptation. Addressing the changes
that lie ahead will not be easy, but the region’s residents have a tradition of tackling problems creatively. Our
hope is to help create a shared understanding of the valley’s most pressing challenges and inform a conversation
about how the valley’s residents and others—including the rest of California and the federal government—can
support a more promising future for this region. The stakes are high. So are the costs of inaction.
This report begins with an overview of the evolution of irrigated agriculture in the valley, including its role in the
regional economy and its history of adapting to evolving technological and market opportunities. We next review
some major resource challenges to which valley agriculture must continue to adapt. Foremost among these is
water scarcity, and the need to bring groundwater basins into balance under SGMA. We then sketch out
approaches to balance water supply and demand, improve water and air quality, and reinvigorate the natural
environment.
Finally, we briefly explore the complex institutional context—and key roles for farmers, urban residents, as well
as local, regional, state, and federal entities in initiating and supporting solutions to the region’s challenges. (Note:
This report is a prelude to a larger study, to be published in 2018, that aims to inform an ongoing regional and
statewide discussion about the valley’s future, and explore opportunities for cooperative solutions in greater depth.)

PPIC.ORG/WATER                                                        Water Stress and a Changing San Joaquin Valley   6
Box 1. What We Mean by the San Joaquin Valley
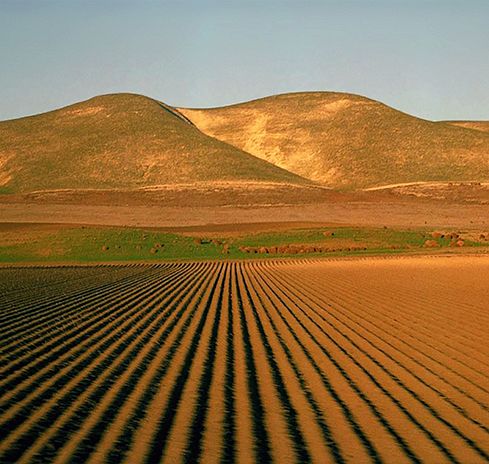
We draw on two ways of defining the San Joaquin Valley. The first is by natural watersheds in the valley,
including the San Joaquin River and Tulare Lake hydrologic regions (Figure 1A). These boundaries include
the valley floor—where most farming occurs and where most people live and work—as well as the higher
elevation parts of the watersheds that drain into it. This definition is most useful for understanding water
availability and use, but it does not lend itself to tracking economic activity because it cuts across county
boundaries. For tracking the economy, we use a second definition—the political San Joaquin Valley, which
includes the eight counties that cover the valley floor: Fresno, Kern, Kings, Madera, Merced, San Joaquin,
Stanislaus, and Tulare (Figure 1B). For some purposes, we also present more detailed information by sub-
regions within the valley floor, defined by agricultural and hydrologic conditions.
FIGURE 1
The San Joaquin Valley
SOURCE: Developed by the authors using information from the California Department of Water Resources.
PPIC.ORG/WATER Water Stress and a Changing San Joaquin Valley 7
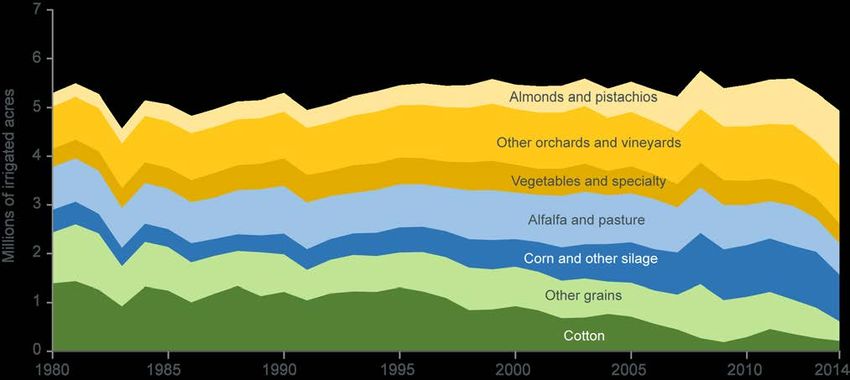
The Evolution of San Joaquin Valley Agriculture
Agriculture has been the leading sector of the San Joaquin Valley economy since the late 19th century, when the
region’s farmers raised cattle, wheat, and other field crops. During the 20th century, the regional economy
evolved to include an array of agricultural commodities, including fruits and vegetables, cotton, alfalfa, dairy, and
orchard crops. Today, the valley produces roughly half of California’s agricultural output. Its diverse range of
crops and animal products serve state, national, and international markets. Farming and related food and beverage
manufacturing are far more important in the regional economy—in terms of revenues, employment, and gross
domestic product (GDP)—than in the state as a whole (Figure 2). The foundation that agriculture provides for the
valley’s economy is even larger if one considers the related economic activities in transportation, farm inputs, and
finance, along with spillover (or “multiplier”) effects on the overall economy. 2

FIGURE 2
Agriculture is much more important to the San Joaquin Valley’s economy than to California’s economy

SOURCE: Author calculations using IMPLAN data for 2012. For details, see Technical Appendix B.
NOTES: Estimates shown are for direct economic effects of farm-related GDP, defined here as crop and animal production (including
support services to agriculture) and food and beverage processing. Employment includes full-time, part-time, and seasonal jobs. The data
are for 2012, prior to the onset of drought-related acreage reductions and a boom in prices for many commodities, including almonds.
Technical Appendix B, Figure B2 provides data for 2014, when strong commodity prices raised farm-related GDP to 21 percent. For
comparable information for each of the eight valley counties, see Technical Appendix B, Figure B3.

Valley agriculture has a long history of adapting to changing agricultural markets, technology, and water
availability. Here we look at some factors influencing adaptations in recent decades.

A Rise in Perennials and Dairies
Since the early 1980s, growers have responded to a variety of changes—including rising agricultural commodity
prices, continued technological innovation, low interest rates, and rising costs of land and water—with shifts
toward perennial vineyards and orchards (especially nuts), high-revenue annual specialty crops such as tomatoes

2 These spillovers include both “indirect” effects of economic activity from related sectors, like input sales, transportation, and agricultural finance, as well as
“induced” effects of additional economic activity generated by the spending of farm-related incomes and taxes.

PPIC.ORG/WATER                                                                                       Water Stress and a Changing San Joaquin Valley                    8

and melons, and fodder crops to support a growing dairy industry (Figure 3). From 1980 to 2012, irrigated
acreage was relatively stable, averaging 5.2 million acres. Over this period, orchards and vineyards grew from 21
to 36 percent of total acreage, and vegetables and other specialty crops from 8 to 11 percent. Corn and other
silage—used primarily by dairies—grew from 9 to 20 percent, and alfalfa and irrigated pasture—also used as
feed—hovered near 16 percent. The flip side of this growth was sharp declines in less profitable field crops,
including cotton—once a major commodity in the region—and some other grains.

FIGURE 3
The San Joaquin Valley’s farmland has been shifting toward perennial crops and fodder for its dairies

SOURCE: USDA’s National Agricultural Statistics Service (NASS), adjusted by ERA Economics.
NOTES: The figure reports acreage planted to irrigated crops and pasture for the eight-county San Joaquin Valley region. “Corn and other
silage” includes corn silage and limited miscellaneous winter silage that cannot be identified within the NASS data. The figures are adjusted
from NASS total crop acreage to account for irrigation. For example, some winter silage crops that are not irrigated are excluded, as is other
(limited) dry-farmed hay.

Since 2012 and the onset of drought-related acreage reductions, almond acreage continued to expand in response
to strong prices, and farmers cut back selectively on lower-revenue field crops. By 2014, irrigated acreage had
declined to 4.9 million acres—the lowest since a severe drought in the early 1990s. Perennial crops were 43
percent of the total, and vegetables and other specialty crops were 12 percent.
Farmers have continued to increase crop quality and yields through continued innovations in crop varieties and
farm management. These improvements occurred despite some shifts in irrigated acreage toward former
rangelands with lower quality soils, as urbanization on the valley floor displaced some prime farmland (Unger and
Thompson 2013, Cameron et al. 2014). The adoption of drip and micro-sprinkler irrigation technology has
facilitated such shifts. These technologies reduce the yield differences across soil types, and make it possible to
irrigate hilly terrain that is unsuitable for traditional flood irrigation. 3

3 In particular, pressure-compensating drip and micro-sprinkler irrigation technology, which delivers a precise amount of water regardless of changes in pressure due to
long rows or changes in terrain, has been instrumental.

PPIC.ORG/WATER                                                                                   Water Stress and a Changing San Joaquin Valley                  9
Although dairy production in the valley began in the early 20th century, it has significantly expanded since the
1970s, propelling California to become the nation’s leading dairy state (Figure 4A). 4 Today, 85 percent of
California’s 1.8 million dairy cows live in the valley. The valley’s herd—which nearly quadrupled from the mid-
1970s to the mid-2000s—is kept mainly in large, intensive “concentrated animal feeding operations” (CAFOs).
Innovations in dairy management have enabled milk production to expand much faster than the herd (Figure 4B).
So too has the production of nitrogen from cow manure—a growing environmental challenge. Milk (and nitrogen)
production have continued to grow even as the number of cows has stabilized over the past decade.

FIGURE 4
The San Joaquin Valley is California’s main dairy region

SOURCE: USDA agricultural census for cows (accessed from Haines et al. 2016). Author estimates of milk and nitrate excretion using
estimates developed in Viers et al. (2012).
NOTE: The ratios of milk and excreted nitrogen to dairy cows are statewide averages. For county-level estimates of dairy cows, see
Technical Appendix B, Table B1.

Persistent Diversity in Farm Sizes
Although the valley has some of California’s largest farms, it also has many small and medium-sized farms. In
2012, valley counties registered nearly 20,000 irrigated farms, with a wide range of sizes (Figure 5). Relatively
small farms and ranches still predominate in some eastern parts of the valley, while large operations managing
thousands of acres occupy much of the southern and western farmland. Although consolidation has been
occurring for several decades, farms with less than 500 acres of irrigated cropland still account for a quarter of
irrigated acreage. 5 Half of all of these farms irrigate 10 to 100 acres, and even smaller farms are important

4 California has had the most dairy cows in the United States since 1998, and has produced about 20 percent of all US milk since 2001 (USDA Economic Research Service
2016).
5
  For trends since the late 1960s, see Technical Appendix B, Figure B6.

PPIC.ORG/WATER                                                                                 Water Stress and a Changing San Joaquin Valley                  10
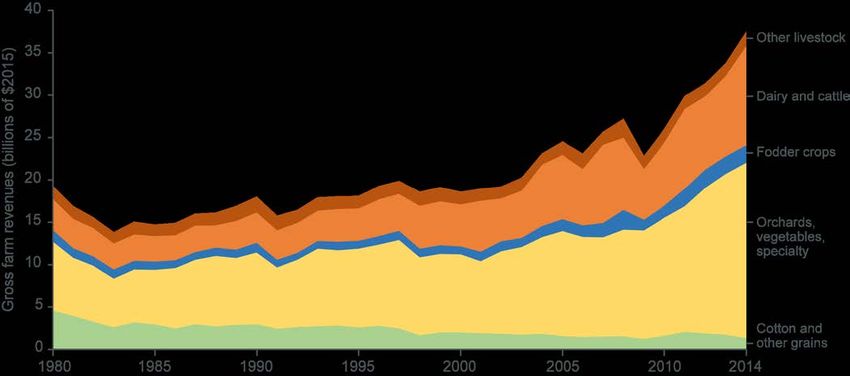
revenue sources for some communities. 6 Solutions to the region’s resource management challenges must
recognize this diversity.

FIGURE 5
Large farms account for most irrigated acreage, but the San Joaquin Valley still has many smaller farms

SOURCE: US Department of Agriculture Census, accessed from Haines et al. (2016).
NOTES: The figure reports the share of irrigated farms for the eight San Joaquin Valley counties, and the share of irrigated acreage by farm
size reported to the 2012 agricultural census. The total number of farms was 19,954 and the total irrigated acres reported was 4.2 million—
about 20 percent below the estimates from the National Agricultural Statistics Service annual crop production surveys shown in Figure 3.
For county-level estimates, see Technical Appendix B, Table B2.

Sustained Economic Growth…
Agricultural prices—and resulting farm incomes and profits—can vary considerably from year to year. Over time,
however, commodity shifts have generally increased farm revenues, even in years with lower land (and water) use
(Figure 6). Real farm revenues increased by 60 percent from 1980 (a year of historically high prices) to 2012. The
even stronger showing in 2014 reflected a boom in prices for almonds and dairy that has since subsided. 7 These
strong market conditions helped offset drought-related water shortages and higher production costs (Howitt et al.
2014 and 2015).
Despite continued innovations in labor-saving technologies, these production shifts have also supported moderate
long-term job growth on farms and in related food and beverage processing industries. 8 And overall, agricultural
innovations and rising commodity prices have enabled the valley’s farm economy to maintain its share of regional
economic activity since the early 1990s, even while the valley has been experiencing rapid urban growth. 9

6 For instance, the Hmong and other Asian communities with small produce farms rely on local farmers’ markets for revenues. However, it is also likely that many
farms reporting less than 10 acres of irrigated cropland are not as actively engaged in market-oriented production as larger farms (Koerth-Baker 2016).
7 Statewide, real farm revenues declined by about 15 percent in 2014 and 2015, largely from price declines (especially for almonds and dairy). County-level data

for 2015 was not available at the time of writing, but the San Joaquin Valley likely experienced the brunt of this drop, given the prevalence of these commodities
in the region.
8 Farm-related employment rose from an average of roughly 215,000 in the mid-1970s to more than 290,000 in 2015. Although it has declined over time as a share of

total employment, its share has remained relatively stable for the past decade. For details, see Technical Appendix B, Figure B5 and related discussion.
9 Because long-term regional GDP estimates are not available, we use regional income (including proprietor and wage income) as a proxy. From 2011-15, farm-related

income averaged 18 percent of regional income, comparable to the average in the late 1980s to early 1990s. It dipped to an average of 14 percent in the early 2000s.
For details, see Technical Appendix B, Figure B4 and related discussion.

PPIC.ORG/WATER                                                                                Water Stress and a Changing San Joaquin Valley                 11
FIGURE 6
Real farm revenues have risen over time in the San Joaquin Valley

SOURCE: National Agricultural Statistics Service, USDA, adjusted by ERA Economics
NOTES: The figure shows gross farm revenues, adjusted to 2015 dollars with the GDP implicit price deflator series. Information on net
revenues (gross farm revenues minus costs) is not available at the county or regional level. The data are adjusted for missing price and yield
information and other miscellaneous inconsistencies. Fodder crops include alfalfa, irrigated pasture, corn, and other silage. Other grains
(included along with cotton in the green area) include non-silage grains.

…and New Management Challenges
These production shifts have also had some less favorable consequences. The strong investment in perennial
crops and dairies has increased vulnerability to water scarcity. When irrigation water supplies are constrained, one
management response is to fallow the least productive, lowest revenue acreage. Fallowing is much more costly
and difficult for vineyards and orchards than for field crops, as trees cannot go without irrigation during dry years.
During the latest drought, for instance, some farmers without ready access to groundwater leased water at record-
high prices to keep their trees alive, and some uprooted trees.
Dairies are another long-term investment with greater drought vulnerability. When water is scarce, farmers can
replace some local feed with imported grain. But many dairies rely on corn silage for a part of their milk cows’
diets, and this must be grown near the dairies because it is so costly to transport. The growth in intensive dairies
has also brought new environmental challenges, including how to safely dispose of nitrogen in manure. 10 To
address these issues, valley farmers must continue to adapt.

10 Dairies also face new regulations to reduce methane emissions from manure—a major source of greenhouse gases (California Air Resources Board 2016a and

2016b, Lee 2016).

PPIC.ORG/WATER                                                                             Water Stress and a Changing San Joaquin Valley               12
Water Scarcity: A Major Challenge
Of the many natural resource challenges facing valley agriculture, perhaps the most critical issue is adapting to
water scarcity. 11 The region has a dry and highly variable climate—with large swings in precipitation across
years—and a generally greater abundance of productive farmland than local water supplies for irrigation.
Historically, these conditions have spurred successive phases of water infrastructure development to augment
both local and imported supplies. But these efforts have not durably resolved the region’s water imbalance—and
the related problem of groundwater overdraft.
Here we briefly review the evolution of water supply development for the valley. We then examine the region’s
water balance over the past three decades—comparing sources and uses—to assess the extent of the groundwater
overdraft that farmers and other residents must now address as they implement the Sustainable Groundwater
Management Act (Box 2).

The Development of Local and Imported Water Supplies
Irrigation using local surface water began in the late 1800s, with rudimentary systems to capture seasonal
flooding. Local districts on the valley’s east side then developed more extensive systems to capture water from
the San Joaquin River and other rivers to the south. In the early 1900s, the region also began to export some water
to the San Francisco Bay Area, as both the City of San Francisco and the East Bay Municipal Utilities District
built reservoirs and aqueducts to tap San Joaquin River tributaries. In the 1930s, improvements in pumping
technology facilitated the expansion of groundwater use in the valley, beginning long-term depletion of the
region’s aquifers (Hundley 2001, Moore and Howitt 1988).
The expansion of irrigated agriculture and declining groundwater levels spurred an era of reservoir and aqueduct
construction, which captured more local surface water and made imports from Northern California available to the
region. From the 1930s to the 1950s, the federal Central Valley Project (CVP) built dams and canals to supply
valley farms. On the east side, the CVP’s Friant Division began diverting San Joaquin River water to farms in the
drier south. On the west side, the CVP started importing water from the Sacramento River through the Delta. In
the southeast, the US Army Corps of Engineers followed with reservoir projects to capture flood flows for
irrigation. In the 1960s, the CVP extended the delivery of Delta imports farther south on the west side. So did
California’s State Water Project (SWP), which also serves coastal urban areas. And in the mid-1970s, local water
users built the Cross Valley Canal to connect SWP and Friant facilities in Kern County.
These successive investments resulted in an amalgam of local, state, and federal infrastructure to store and
transport water (Figure 8), managed by a diverse set of agencies. These projects deliver water under a variety of
water rights and contracts, with different levels of reliability when supplies are constrained. So while water
scarcity is a regional problem, it is not experienced equally. Some farms and communities have very senior rights
to surface water, established more than a century ago, and rarely experience shortages. In contrast, the CVP and
SWP have relatively junior surface water rights, and many of their contractors are more susceptible to cutbacks.
Still others—including many towns and rural communities—rely entirely on groundwater for drinking water and
irrigation supplies. This makes them particularly susceptible to groundwater quality problems and falling water
tables, and vulnerable to pumping restrictions with the implementation of SGMA.

11 This report focuses on challenges related to natural resource aspects of farming, including water and land. The sector will also need to continue responding to

broader economic conditions, including national and international markets for its products, as well as changing interest rates and markets for labor and other inputs.
Although water and land are essential inputs for crop production, these other market factors can make a bigger difference to the sector’s bottom line.

PPIC.ORG/WATER                                                                                   Water Stress and a Changing San Joaquin Valley                   13
Box 2. The Sustainable Groundwater Management Act
    In 2014, Governor Brown signed into law a set of bills commonly known as the Sustainable Groundwater
    Management Act (SGMA). The legislation directs local agencies and stakeholders to develop institutions,
    plans, and implementation strategies to sustainably manage their groundwater resources for the long run
    (Kiparsky et al. 2016). If local agencies fail to act, SGMA directs the state to intervene.
    The law defines sustainable management as the avoidance of six effects: (1) drawing down water levels
    too far, (2) depleting storage in the aquifer, (3) degrading water quality, (4) allowing seawater intrusion,
    (5) causing land to subside, or (6) using groundwater in ways that reduce other people’s surface water or
    harm ecosystems.
    Local stakeholders are in charge of carrying out the key provisions of SGMA. New or existing agencies
    overlying the most stressed groundwater basins (those designated by the Department of Water Resources
    as medium- and high-priority, and critically overdrafted) are tasked with establishing Groundwater
    Sustainability Agencies (GSAs), and formulating Groundwater Sustainability Plans (GSPs). Any local
    agency in a basin can form a GSA, but GSAs may not have overlapping boundaries. To avoid state
    intervention, GSAs must be formed by June 2017.
    GSAs in critically overdrafted basins are required to develop plans by January 2020, while those in other
    medium- and high-priority basins have two additional years to do so. With plans in place, GSAs have
    a 20-year horizon to manage their basins to achieve sustainability.
    SGMA is especially significant in the San Joaquin Valley. Of the valley’s 16 groundwater basins, 11 are
    considered critically overdrafted, subject to the 2020 timeline (Figure 7). Four medium- and high-priority
    basins in the northern Valley will have until 2022 to start implementing their plans. Only one—a relatively
    saline basin on the Valley’s west side—is not required to prepare a sustainability plan.

                          FIGURE 7
                          Most San Joaquin Valley basins are critically overdrafted

                          SOURCE: California Department of Water Resources.

PPIC.ORG/WATER                                                         Water Stress and a Changing San Joaquin Valley   14
FIGURE 8 The San Joaquin Valley receives local and imported surface water from a diverse array of projects SOURCE: Adapted from Figure 2.6 in Hanak et al. (2011), using information from the California Department of Water Resources. NOTES: “Taf” is thousands of acre-feet. The map shows reservoirs with storage capacity over 100 thousand acre-feet (taf), scaled to size. Built conveyance facilities (canals, aqueducts) are scaled to their average annual deliveries. Rivers are shown in blue. Three major rivers—the Colorado, Sacramento, and Feather—are scaled to their annual deliveries. These rivers each serve a significant conveyance role, connecting surface reservoirs and locations of water use. The Valley’s Water Balance Today To manage water resources effectively for the long-term, it is essential to understand the valley’s water balance: how much water is available from different sources, how much is used in different activities within the region, and how much leaves the region for use elsewhere. Developing an accurate picture of this balance is difficult, because many key components—including groundwater withdrawals (a key source) and farm water use (the largest use)—are not systematically measured or reported. Understanding the water balance also requires accounting for the difference between gross and net water use—the water that returns to rivers, streams, or aquifers after use and is available for reuse (“return flow”) (Box 3). PPIC.ORG/WATER Water Stress and a Changing San Joaquin Valley 15
Box 3. Gross and Net Water Use and Return Flows
Gross water use is the total amount of water applied to farm fields, urban landscapes,
and managed wetlands, as well as water used indoors. Net water use is the portion of
gross use that is consumed by people, animals, or plants, embodied in manufactured
goods, evaporated into the air, or discharged into saline water bodies and made
unusable without significant treatment. Net water use excludes “return flows”—the
portion of gross water use that returns to rivers, streams, or aquifers after use and is
available for reuse.
Return flows mainly come from irrigation water not consumed by crops and urban
wastewater discharges. Irrigation return flows are a major source of aquifer recharge
in the San Joaquin Valley. Because they are available for reuse, return flows are not
considered a use in a region’s water balance. For this reason, the water balance
presented in this report focuses on net—rather than gross —water use. Water users
in different parts of the valley will also need to account for return flows as they bring
their water sources and uses into balance under SGMA.
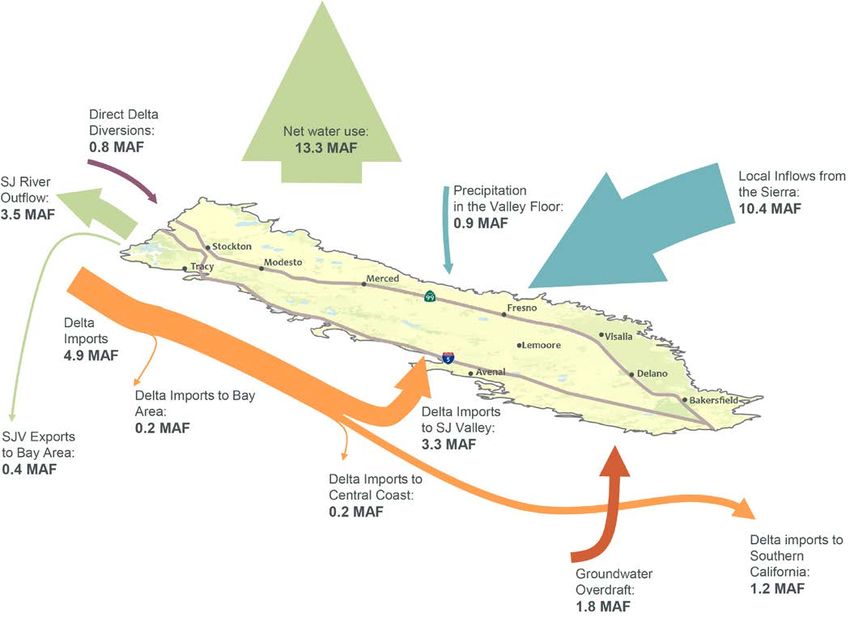
The regional water balance presented here provides an overall picture of water sources and uses on the valley
floor—where most irrigated farming occurs and where most people live. 12 From 1986 to 2015, annual net water
use averaged 13.3 million acre-feet (maf), with 89 percent for farming and the remainder consumed by cities
(4%), managed wetlands (2%), and natural landscapes (5%). 13
This water comes from four sources (Figure 9):
Local supplies (56%). This includes water flowing in from the local rivers and streams originating in the
Sierra Nevada (10.4 maf), plus precipitation falling on the valley floor (0.9 maf), minus exports from local
rivers to the Bay Area (0.4 maf) and outflows to the Delta (3.5 maf), for a net total of 7.4 maf.
Delta imports (25%). On average, 4.9 maf of Delta imports enter the valley through the CVP and SWP
pumps in the south Delta near Tracy, and 3.3 maf remain in the valley. The rest is sent onward to the Bay
Area (0.2 maf), the Central Coast (0.2 maf), and Southern California (1.2 maf). Most imports originate
from the Sacramento River, a much larger river than the San Joaquin.
Direct Delta diversions (6%). In the northernmost part of the valley, most water users divert water
directly from the Delta (0.8 maf). Depending on location and timing, this water originates from the
Sacramento River or local rivers.
Groundwater overdraft (13%). Because they recharge the valley’s aquifers either directly or through
return flow, a portion of all three of the sources listed above is consumed through groundwater pumping.
This pumping can be considered sustainable groundwater use because it comes from recharge. On average,
valley water users also pumped 1.8 maf per year of additional groundwater. This is the long-term level of
overdraft, or diminishing groundwater reserves.
12
Figure 1A depicts the valley floor, and Technical Appendix A describes sources and methods for the water balance estimates.
13Gross water use—which includes water returned to rivers and aquifers—was approximately 18.8 maf, and return flows were 5.5 maf. (29% of gross water use). The
share of return flows in gross water use varied across sectors: 28 percent for agriculture, 63 percent for urban, and 57 percent for wetlands (estimates from the
California Department of Water Resources for 1998-2010).
PPIC.ORG/WATER Water Stress and a Changing San Joaquin Valley 16FIGURE 9
The San Joaquin Valley’s water balance: sources and uses (1986–2015)
SOURCE: Author estimates using data from several sources (for details, see Technical Appendix A).
NOTES: For a breakdown of the water sources available for use in the valley, see the discussion in the text (p. 16). San Joaquin River outflow
includes flows from the San Joaquin River at Vernalis (averaging 2.6 maf/year) and flows from the Mokelumne and Cosumnes Rivers and
other east-side streams (0.9 maf/year). Direct Delta diversions correspond to net water use by San Joaquin Valley water users located within
the Delta.
Some decline in groundwater reserves is expected during droughts, when less surface water is available. The
problem occurs when aquifers are not recharged in wetter years. The long-term declines in the valley’s
groundwater reserves reflect surface-water scarcity and a lack of formal groundwater management. There has
been some progress in managing recharge since the 1990s, particularly in Kern County. 14 But in contrast to some
overdrafted basins in Southern California and the Bay Area, valley water users have not yet placed effective
overall limits on the volume of pumping. In the absence of limits, individual users have incentives to pump more
than is collectively sustainable.
14
This includes groundwater banks that also store water for other parties—including cities in the Bay Area and Southern California (Hanak and Stryjewski 2012).
PPIC.ORG/WATER Water Stress and a Changing San Joaquin Valley 17Overdraft is a longstanding problem, particularly in the drier southern part of the valley, and an important goal of
the water infrastructure projects described above was to help close this gap. 15 But for a variety of reasons, these
projects have not met this expectation. Indeed, regional overdraft has been accelerating since the early 2000s, in
part due to the following factors:
Southern California imports. In the early decades of the State Water Project, coastal urban water agencies
often did not take all the water they were entitled to, and valley farmers were able to pick up the surplus at
low cost. 16 Southern California now uses this water, and it has also bought some SWP contracts from
irrigation districts in the valley. On average, this translates to a decline of 0.5 million acre-feet of Delta
imports going to the valley since 2001. 17
Changing environmental regulations. Delta imports have also been smaller than originally anticipated
because of a suite of environmental flow regulations introduced since the early 1990s, intended principally
to protect vulnerable fish species. The cumulative effect of these changes on total imports has not been well
documented—and is likely smaller than sometimes thought. 18 But there is little doubt that imports have
been more restricted, particularly over the past decade.
Drought. Recurrent drought has reduced both local supplies and imports. The period 2001–15 was the
driest since the prolonged dry period of the late 1920s and ’30s. 19
Figure 10 shows how groundwater overdraft has accelerated as drought and reductions in Delta imports have
limited surface water inflows to the region. Local supplies and imports are much more variable than water use,
and they have declined in recent years (Panel A). Surface reservoirs supplement annual supplies in the early years
of droughts, but they run out of water when droughts wear on (Panel B). Meanwhile, net recharge of groundwater
basins valley-wide has occurred in just a few years in the past three decades (Panel C). In most years,
groundwater is being used faster than it is being replenished. From 1986-2000, groundwater overdraft contributed
10 percent of net water used in the valley. From 2001–15, its share rose to 17 percent. 20
15 Imports were intended to support expansion of agriculture in some parts of the valley—such as the west side areas of Fresno and Kings County—and reduce
groundwater overdraft in other places, such as Kern County. For a chart showing groundwater depletion in the region since the early 1920s, see Mount et al. 2016b.
16 The SWP was never built out to its planned capacity, so average project deliveries have been generally lower than planned. This was less noticeable for valley
growers in the early years because of the ability to access unused urban supplies.
17 As described in Technical Appendix A, Figure A18, Southern California increased its share of total Delta imports from an average of 19 percent in 1986–2000
to 29 percent in 2001–15, for an average annual increase of roughly 500,000 acre-feet. This resulted in a commensurate decline in the valley’s share of imports,
from 72 to 61 percent. The growth in Southern California’s share reflects increased ability to take delivery of SWP contract water and store it in local surface and
groundwater storage, sales of SWP contracts to Southern California agencies by San Joaquin Valley irrigation districts, and net withdrawals of Southern
California water stored in Kern County groundwater banks during recent droughts.
18 Discussions of the impact of various environmental regulations on Delta imports sometimes suggest they have resulted in cuts of as much as 2 million acre-feet
per year. As described further below, these assessments may assume that individual regulatory programs are additive—always resulting in additional water supply
cutbacks, when in some cases they can be met using the same water. Also, they may not adequately consider import reductions related to hydrologic factors (such
as drought) since the late 2000s. Overall, Delta imports were higher in many years following the adoption of more stringent environmental regulations in the early
to mid-1990s (Cody, Folger, and Brown 2015).
19
This calculation uses summary precipitation data for the region from the National Oceanic and Atmospheric Administration (NOAA). In this 15-year period,
only four years had precipitation above the 1901–2000 average.
20 The corresponding shares for imports were 27 percent and 23 percent, and for local supplies 58 percent and 54 percent, respectively. Delta diversions remained
constant at 6 percent.
PPIC.ORG/WATER Water Stress and a Changing San Joaquin Valley 18FIGURE 10 Drought and reduced Delta imports have accelerated overdraft in recent years in the San Joaquin Valley SOURCE: Author estimates using data from several sources (for details, see Technical Appendix A). NOTES: To facilitate comparisons, bar heights in all three panels have the same scale. The components of annual inflows (Panel A) are described in the text. “Dry years” are those classified as dry or critically dry for the Sacramento Valley based on the California Cooperative Snow Survey. This basin is the main source of Delta imports, and dry conditions there are highly correlated with conditions in San Joaquin Valley rivers. The dry year classification considers precipitation in that year and water available in surface storage from the prior year. PPIC.ORG/WATER Water Stress and a Changing San Joaquin Valley 19
Conditions have become acute since the onset of the latest drought, when surface water deliveries were especially
low. Farmers reduced irrigated acreage and total water use in 2014 and 2015, but they also drilled record numbers
of new irrigation wells and pumped record volumes of groundwater to keep crops alive. 21 This accelerated
groundwater overdraft has raised numerous concerns, ranging from irreversible land subsidence, to higher
pumping costs, to dry wells. Subsidence rates—with lands sinking by nearly a foot per year in some places—are
approaching records reached earlier in the 20th century, before Delta imports began. This is damaging
infrastructure, including the large aqueducts of the CVP and the SWP, flood channel capacity in portions of the
San Joaquin River, and local water delivery systems. 22 And since 2014, the drying up of more than 3,100
domestic and small community drinking water wells within the region has raised immediate public health
concerns. 23
In fall 2014, these conditions spurred the enactment of SGMA, which will require local water users to manage
groundwater sustainably. The groundwater deficit can be closed by augmenting supplies, reducing demands, or
some combination of these two approaches. In the near-term, this will likely increase costs for valley farming and
the regional economy. But if successful, it can improve long-term water supply reliability for the most profitable
farm activities and lower water management costs for many farms and other local users. As described below,
numerous tools and approaches are available to reduce the costs of these adjustments.

Related Challenges for Water and Land Management
Beyond water scarcity, agricultural production in the valley faces a number of related challenges. Farm practices
have contributed to a variety of environmental and public health problems—reflecting tradeoffs that are common
in many farming regions. Notable issues include nitrate contamination of groundwater, salinity accumulation in
soils, local air pollution, and the broad decline in aquatic, wetland, and terrestrial ecosystems, which affect
vulnerable species. Farmers must respond to these concerns and adapt to new laws and regulations intended to
address these issues.

21 For trends in well drilling, see Technical Appendix B, Figure B7. For an analysis of the economic impacts of drought, including estimates of land idling, see the studies by
Howitt et al. (2014, 2015) for the California Department of Food and Agriculture. Table A5 in Hanak et al. (2015) provides a multi-year summary of these impacts for the
state as a whole.
22 For a general overview of subsidence, see California Department of Water Resources (2014). During the drought of the late 2000s, the US Geological Survey found

subsidence rates of 1 to 21 inches over a three-year period (Sneed et al. 2013, Faunt et al. 2015). A NASA study of subsidence rates from 2015-16 shows the valley’s main
areas of subsidence growing wider and deeper, with growing damage to water project infrastructure such as the California aqueduct and the Delta-Mendota Canal (Farr et al.
2017). Subsidence-related cost estimates for the CVP and SWP aqueducts are not available, but some local infrastructure costs have been estimated. For a discussion of
impacts to Sack Dam, where continued subsidence will cost local farmers $10 million to move water that can no longer flow by gravity because the land has shifted, see
Richtel (2015). Subsidence-related damage to a bridge over a canal in Fresno County will cost $2.5 million to repair (KSFN 2015).
23 This is the estimate of wells reported dry as of December 2016. See technical appendix Table B3 for a breakdown by county. Hanak et al. (2015) Table A6 provides data

on small water systems with compromised water supplies.

PPIC.ORG/WATER                                                                                      Water Stress and a Changing San Joaquin Valley                     20
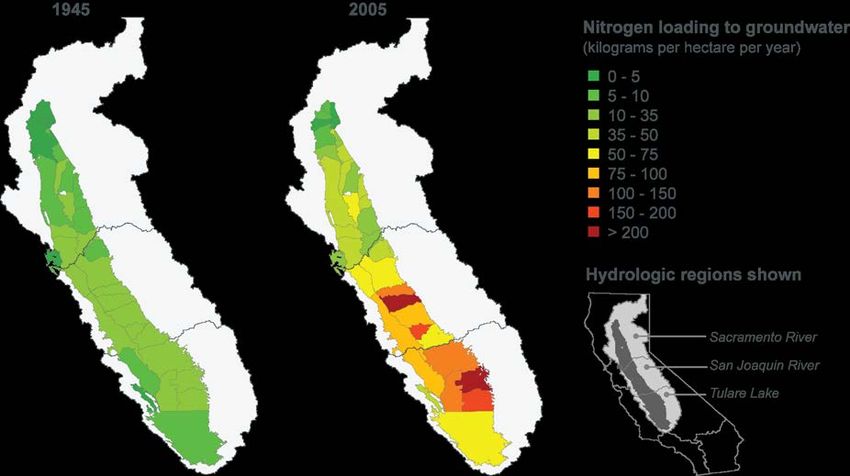
Persistent Water Quality Challenges
Nitrate Contamination of Drinking Water
One pervasive problem is the accumulation of nitrate in groundwater, due to decades of intensive use of nitrogen
fertilizer and dairy manure on fields (Figure 11). 24 Much of the nitrogen not consumed by crops moves slowly
downward into groundwater supplies, eventually threatening drinking water sources. A detailed study for the Tulare
Lake hydrologic region, where the problem is widespread, found that roughly 250,000 residents—11 percent of the
region’s population—are already highly susceptible to nitrate contamination.25 Nitrate ingestion is particularly
harmful for infants—causing “blue baby” disease (reduced oxygen in the blood). 26 Water treatment can remove it,
but this can be costly.
The nitrate problem is most acute for small community and domestic wells that are relatively shallow, where
nitrate concentration is often higher. Small communities also face higher costs in addressing contamination,
because they lack the economies of scale in water treatment available to larger water systems. In addition, these
communities are often poor, and lack the technical, financial, and managerial resources needed to operate
upgraded systems.
This crisis has spurred multi-pronged efforts to find near-term safe drinking water solutions for communities
affected by nitrate and other groundwater contaminants, such as naturally occurring arsenic and hexavalent
chromium. It has also prompted a policy to reduce the amount of nitrogen entering the environment from farms
(“nitrogen loading”), which can reduce groundwater contamination over the long term. In 2007, the Central
Valley Regional Water Quality Control Board (“regional water board”) began requiring dairies to obtain permits
to discharge nitrogen and salts into surface and groundwater through the Central Valley Dairy Order. And in
2010, the regional water board’s Irrigated Lands Regulatory Program (ILRP) expanded its earlier focus on
protecting surface waters from a range of pollutants originating on farms (e.g., pesticides, pathogens, and
sediment) with a new requirement that growers shift to farming practices that also reduce the release of excess
nitrogen into soils and aquifers (Harter 2015). 27

24 Lagoons used to store manure at dairies also contribute to spikes in groundwater contamination.
25
   See Honeycutt et al. 2012. This includes nearly 33,000 residents served by domestic wells or very small local water systems, with fewer than five connections. This
estimate excludes the City of Fresno, which has some wells susceptible to nitrate but benefits from significant economies of scale in managing the problem through
blending with surface water and treatment. For a map of small water systems in economically disadvantaged communities that are vulnerable, see Technical Appendix
B, Figure B8.
26 For more background on nitrate see Addressing Nitrate in California’s Drinking Water: Questions and Answers.
27 The ILRP’s surface water program launched in 2003, and the Central Valley regional water board began issuing waste discharge requirements addressing both

surface and groundwater in late 2012 (State Water Resources Control Board 2016a).

PPIC.ORG/WATER                                                                                 Water Stress and a Changing San Joaquin Valley                  21
FIGURE 11
Nitrate contamination of groundwater is a widespread problem in the San Joaquin Valley
SOURCE: Harter et al. (2016).
NOTES: Thirty-five kilograms of N per hectare per year (about 31 pounds per acre) is a benchmark to separate “low-intensity” from
“high-intensity” loading (Viers et al. 2012). All areas shaded in yellow, orange, and red are experiencing high-intensity loading.
Salt Accumulation and Reduced Farmland Productivity
Salt accumulation in soils and groundwater is also a longstanding problem for agriculture in parts of the valley,
particularly on the west side of the Tulare Lake hydrologic region (Figure 12). High levels of salt in irrigation
water reduce yields and limit the types of crops that can be grown. And when salts accumulate in the soil, this
reduces its productivity, ultimately making it unsuitable for farming. These problems cost valley farmers around
$370 million per year in lost revenue (MacEwan et al. 2016). High salt content also raises costs for drinking
water, potentially requiring costly desalting.
There are several main sources of salts in the valley:
it occurs naturally in some groundwater;
irrigation mobilizes naturally occurring salts in local soils;
crops use irrigation water, but leave most minerals—including salts—in their root zone;
poor drainage of irrigation water keeps salty groundwater close to the root zone; and
water imported from the Delta has a relatively high salt content.
The problems caused by salts are more pronounced in areas with overdrafted groundwater basins, such as those in
the central and southern valley. 28
28
In these basins, salts flushed from the root zone to groundwater are trapped and concentrated in a closed loop: groundwater is pumped for irrigation, crops remove
water as they grow, salts are left in the root zone and flushed back to groundwater. Each pumping and recharge cycle increases salinity, causing long-term degradation
of the aquifer. In contrast, areas with no or only short-term overdraft, such as some parts of the northeastern valley, naturally flush salts continually back to streams,
thus exporting accumulated salt out of the region to the Delta.
PPIC.ORG/WATER Water Stress and a Changing San Joaquin Valley 22FIGURE 12
Salinity is a growing problem for crop productivity on the San Joaquin Valley’s west side
SOURCE: CV-SALTS, “High Resolution Ambient Water Quality Mapping.” Draft, May 2016.
NOTES: The figure shows shallow groundwater salinity on the valley floor. Levels above 1,000 milligrams per liter of total dissolved solids
(TDS, a measure of salinity) increasingly limit crop yields and crop choices. CC is Corcoran clay.
Although there is a long history of efforts to mitigate salt accumulation, the state has only recently proposed a
regulatory approach. 29 Building on the Dairy Order and the ILRP, the Central Valley SALTS program is a
stakeholder-led effort to comply with the state’s overarching “anti-degradation” policy, which seeks to maintain
water quality at levels that protect existing uses. In this case, the goal is to avoid further salinization of the Central
Valley aquifer system. 30 CV-SALTS was launched in 2009 and involves municipal and industrial dischargers in
addition to farmers. In 2016 the coalition presented its final plan for salt and nutrient management to the regional
water board (CV-SALTS 2016b). As discussed in the section on management approaches below, proposed
strategies will likely increase water costs for valley farming.
Air Quality
Despite considerable improvements in recent years, the San Joaquin Valley still has some of the nation’s worst air
quality, with dangerously high levels of smog-forming ozone and particulate matter that increase respiratory and
cardiovascular health risks. In part, this results from the valley’s natural features: the bowl-shaped topography,
bordered by mountain ranges, hinders air renewal. A variety of pollution sources contribute to the problem—
notably heavy and growing vehicular traffic. Farm operations and practices such as agricultural waste burning are
29 For a discussion of earlier efforts, see Orlob (1991) and San Joaquin Valley Drainage Program (1990).
30
The program’s full name is Central Valley Salinity Alternatives for Long-Term Sustainability (CV-SALTS). For a description, see Harter (2015).
PPIC.ORG/WATER Water Stress and a Changing San Joaquin Valley 23You can also read