We create and manage places where people love to work - CA IMMO COMPANY PRESENTATION - Folie
←
→
Page content transcription
If your browser does not render page correctly, please read the page content below
We create and manage
                        places where people love to work.

CA IMMO
COMPANY PRESENTATION
May 2021

All figures (€) as at 31 March 2021, unless otherwise stated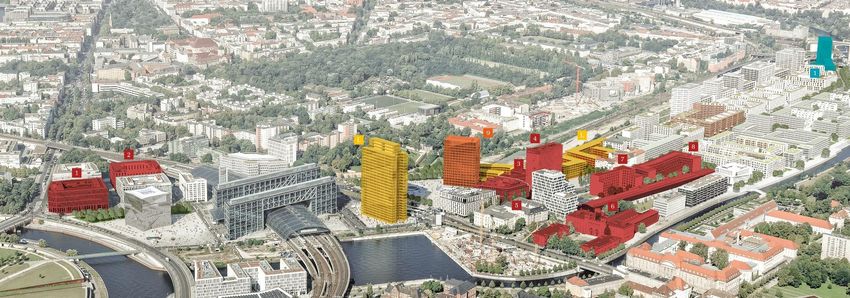
Highlights Results Financing Property ESG Cap. Markets
Strategy
Core pillars of business model
Entire value chain Urban cities Pure play office Resilient portfolio Solid balance sheet
Acquire
Investment Management Tier 1: Berlin, Munich, A-class office to hold 85% investment 45–50% equity ratio
Asset Management Warsaw, Prague, Vienna Land and B-class to properties Well below 40% LTV (net)
Development Management Tier 2: Frankfurt, (re-)develop 15% developments (incl. Balance of secured/
Property Management Duesseldorf, >= 10 k sqm GLA land reserves) unsecured financing
Hamburg, Cologne >= €50 m value Adequate risk-adjusted Extensive unencumbered
Mid/back office
Tier 3: Budapest, Bucharest Minority other use returns asset pool
Target > €1 bn GAV in (hotel, residential) (Re-) Organic and external Net debt/EBITDA stable
Tier 1–2 markets Retain acceptable if part of mixed growth to expand footprint Full interest rate hedging
use with majority office
Develop in some of the most
Maintain and improve
promising real estate
investment grade rating
markets in Europe
Reposition
Total coverage in urban markets Achieve risk-adjust. returns from
Investing, (re)developing, managing Minimise cost, maximise flexibility,
with growth, innovation, talent, Single sector, multi geography core/core+ to opportunistic risk
real estate maintain adequate liquidity
capital taking
Business model/value chain
2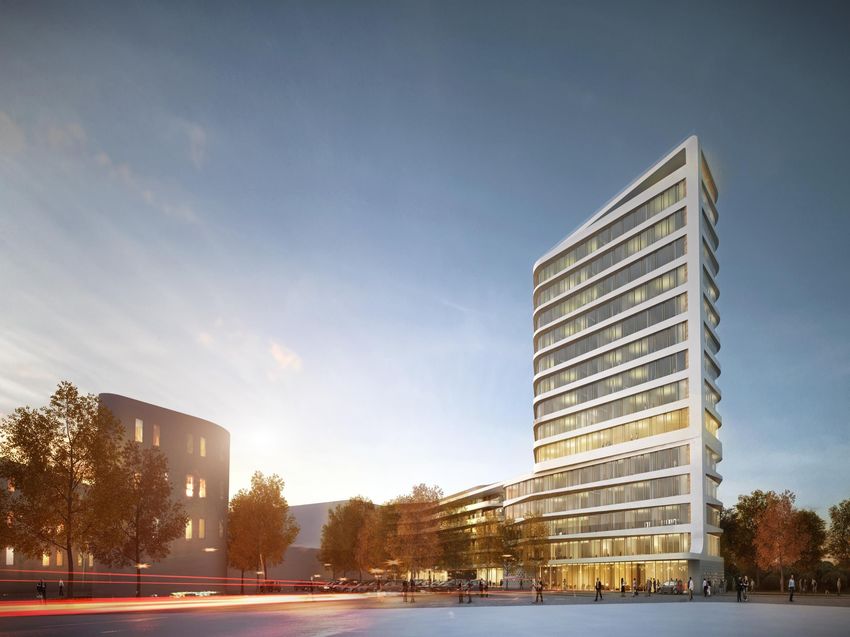
Highlights Results Financing Property ESG Cap. Markets
Strategy
Portfolio strategy through the property cycle
Monetise future profit where no further Excellent locations in established and
value creation exists. emerging submarkets.
Divest when future rate of return is Old, inefficient, tired existing assets in
below required given risk level. strong locations with value creation
potential.
Sell non-strategic assets (location,
sector, size, quality, potential, resilience). New high quality, sustainable and
Recycle Acquire certified existing assets with reversion
and re-rating potential.
Ground up development, comprehensive
redevelopment.
Modern properties with cutting edge
environmental, technology, specification
Retain (Re-) standards.
Develop Future proof properties anticipating post
Hold highest quality, most efficient,
resilient, healthy, clean, green, safe, pandemic institutional occupational
innovative space that meets future demand.
occupational demand. Reposition
Lease restructuring to capture reversion.
Increase levels of services to improve
occupier experience (real estate as a Light refurbishment, rebranding,
service). improvement of operational efficiency.
Increase office operating model Deliver and maintain high quality modern
(e.g. flex office). office required by institutional occupiers.
3
Highlights Results Financing Property ESG Cap. Markets
1Q 2021
Key Achievements / Earnings
yoy
Soild start into business year 2021 NET RENTAL
INCOME +2%
We have been able to deliver a top line growth in 1Q 2021 with rental income up 2%
yoy to €63.6 m.
€50.5 m
Net rental income increased to €50.5 m (+2% yoy). The Covid-19 pandemic had a EBITDA
+13%
negative P&L impact of €-1.2 m on net rental income (mainly bad debt losses). In €43.8 m
addition, a turnover rent of €0.4 m could not be collected in the first quarter.
FFO I
Higher rental income and net income from disposals led to an EBITDA growth +5%
of 13% to €43.8 m. €31.4
Positive revaluation result of €63.3 m was mainly driven by the Upbeat development FFO II
in Berlin. +88%
€30.0
FFO I of €31.4 m (+5% yoy) and FFO II of €30.0 m (+88% yoy) show resilience of
recurring earning power despite Covid-19 impact and rental income losses related to
EPRA NTA
disposal programme. per share +3%
The EPRA NTA stood at €41.14 per share, which translates into a 2.6% increase since
€41.14
the beginning of the year.
4
Highlights Results Financing Property ESG Cap. Markets
1Q 2021
Key Achievements / Portfolio
yoy
Portfolio Growth and Capital Rotation GROSS ASSET
VALUE +8%
Portfolio growth through development pipeline despite disposals of non-strategic
assets. Completion of the ZigZag office building in Mainz and transfer into the
€5.7 bn
investment portfolio.
INVESTMENT
Steady progress on the development pipeline. 34,850 sqm long-term rental contract PROPERTIES +4%
with Deutsche Kreditbank AG (DKB) set the groundworks for the construction start of €4.7 bn
landmark office development Upbeat in Berlin’s Europacity.
GROSS INITIAL
Leasing volume totaling 81,500 sqm in the first quarter of 2021. Thereof, 38,200
YIELD -32bps
sqm of rentable floor space in investment properties was newly let or extended.
Pre-letting of 43,300 sqm of lettable space in project developments. 5.1%
Continuation of strategic capital rotation with numerous non-strategic asset sales OCCUPANCY
(investment properties & land plots, exit of non-core market Slovakia) above the most -297bps
recent book values where we could monetize future profit where no further value
92.2%
creation existed, as well as where we deemed the property to no longer fit within our OFFICE SHARE
strategic priorities. +202bps
90.5%
5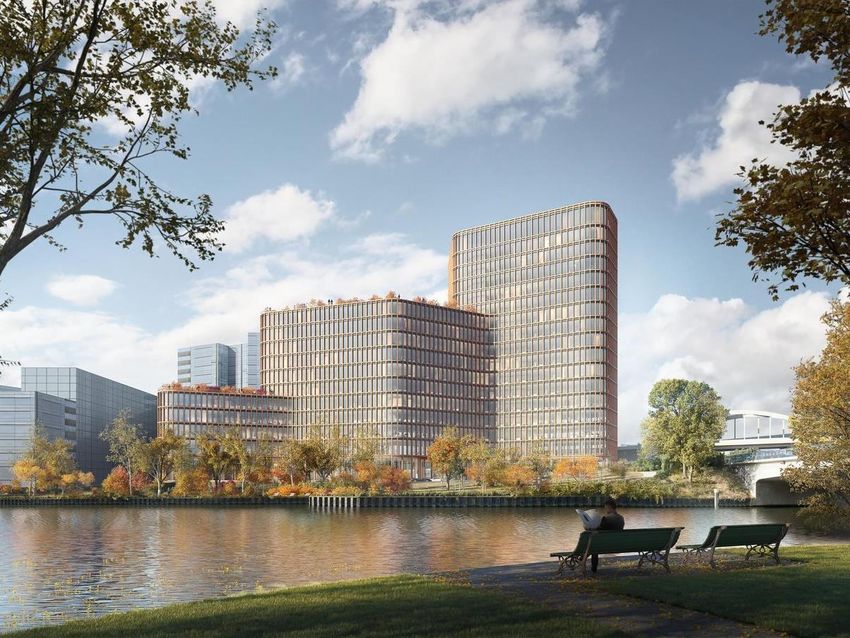
1Q 2021 RESULTS

Highlights Results Financing Property ESG Cap. Markets
1Q 2021 Results
Strong operational result with solid EBITDA growth
Profit and loss (€m) 1Q 2021 1Q 2020 +/(-) Major earnings drivers
Rental income 63.6 62.4 1.8% 1
1 Net rental income 50.5 49.6 1.9% Solid top line growth despite Covid-
19 pandemic, which impacted net
Other property development expenses (0.6) (0.7) (15.4%)
rental income by €-1.2 m in 1Q 2021.
Property sales result 1 4.4 0.1 n.m. In addition, a turnover rent of €0.4 m
Income from services rendered 2.2 2.3 (5.4%) could not be collected in the first
quarter.
Indirect expenses (14.8) (12.8) 15.6%
2
Other operating income 2.1 0.3 n.m.
Strong property revaluation result
EBITDA 43.8 38.8 12.9% driven by 100%-pre-lease of Upbeat
Depreciation and impairment/reversal (1.2) (1.2) 1.7% development in Berlin.
2 Result from revaluation 63.3 (11.1) n.m. 3
Result from joint ventures 4.8 (0.4) n.m. Non-cash valuation effects in
connection with the convertible bond
EBIT 110.8 26.1 324.1% and interest rate derivatives
Financing costs (12.3) (11.4) 7.4% (€-29.4 m):
3 Result from derivatives (29.4) 35.7 n.m. Derivative valuation of the
Result from financial investments (0.7) (1.1) (39.9%)
convertible bond in the amount of
€-37.4 m.
Other financial result 0.2 (2.8) n.m.
Valuation effect of interest rate
Financial result (42.1) 20.5 n.m. derivatives of €8.0 m.
Earnings before tax (EBT) 68.7 46.6 47.4% 4
4 Income tax 2 (27.3) (13.1) 107.4% Tax increase mainly linked to higher
deferred taxes driven by revaluation
Consolidated net income 41.4 33.5 23.8%
uplift of Upbeat project Berlin.
1 2
Result from trading and construction works + Result from the sale of investment properties Current income taxes + Deferred taxes 7
Highlights Results Financing Property ESG Cap. Markets
1Q 2021 Results
Solid top-line growth due to acquisitions and development completions
Key drivers 1Q 2021 net rental income bridge (€m)
Rental income increase driven by portfolio
growth through development completions and
acquisitions of recent quarters. 50.5
Rental income contribution by completed
developments MY.O & NEO (Munich) and
MY.B (Berlin) of €2.4 m in total.
Rental income contribution of investment
property acquisitions in 2020 of €2.6 m
in total compensate for rental income
losses from strategic properties sold in the
previous year.
The Covid-19 pandemic impacted net rental 1Q 2021 rental income (€m) 1Q 2021 net rental income (€m)
income by €-1.2 m in 1Q 2021. This mainly 64.0 51.0
relates to reserves for bad debts and to a
+1.8%
lower degree rent reductions, which are, +6.7%
63.5
however, counterbalanced by opposing effects 50.5
from incentive agreements (rent-free periods).
63.0
In addition, a turnover rent of €0.4 m could not
50.0
be collected in the first quarter.
62.5
Operating margin (net rental income to rental
income) stood at 79.4% (1Q 2020: 79.4%). 49.5
62.0
The lower margin in the first quarter relative to
other quarters results from property taxes 62.4 63.6 49.6 50.5
61.5 49.0
booked in the first quarter. 1Q 2020 1Q 2021 1Q 2020 1Q 2021
8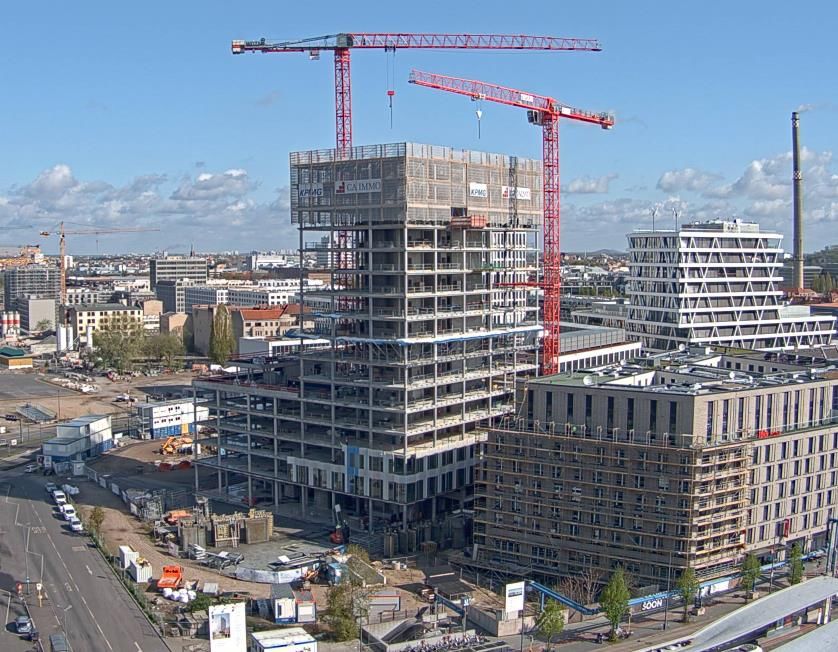
Highlights Results Financing Property ESG Cap. Markets
1Q 2021 Results
FFO I at €31.4 m 4.5% up compared to previous year
Funds from operations (€m) 1Q 2021 1Q 2020 +/(-) Major drivers
1
1 Net rental income 50.5 49.6 1.9%
Rental income increase driven by
Result from services 2.2 2.3 (5.4%) development completions and
2.1 (0.0) n.m. acquisitions of recent quarters
Other operating income/expenses
(refer to next page for details).
Other operating income/expenses 4.2 2.3 86.4%
2
Indirect expenses (12.2) (12.5) (2.8%)
Non-recurring adjustments included
Result from joint ventures (0.1) 0.2 n.m. in the respective P&L line item.
Finance costs (10.8) (9.7) 11.0%
Adjusted non-recurring effects
Result from financial investments 1 (0.3) 0.2 n.m. primarily related to:
2 Financing expenses (€-1.2 m)
FFO I 31.4 30.0 4.5%
Administrative expenses
FFO I per share 0.34 0.32 4.5% (€2.6 m)
3 Property sales result 2 10.9 (0.1) n.m. 3
Result from disposal of asset fair value 0.1 0.0 n.m. Property sales result up because of
Other financial results 0.0 (5.1) n.m.
profitable disposals of non-core
assets.
Current income tax 3 (3.2) (6.4) (50.6%)
Non-recurring readjustments 4 (9.2) (2.5) 271.4%
FFO II 30.0 15.9 88.3%
FFO II per share 0.32 0.17 88.3%
1
9
Excluding IFRS 9 value adjustment 2 Incl. at equity property sales result 3 Incl. at equity current income tax 4 Includes other non-recurring results adjusted in FFO I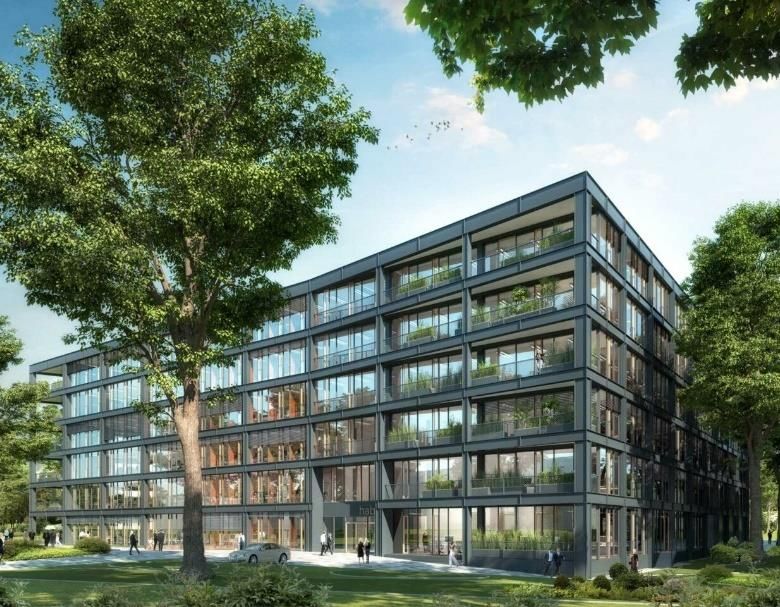
Highlights       Results        Financing        Property            ESG         Cap. Markets

 1Q 2021 Results
 FFO I at €31.4 m 4.5% up compared to previous year
 1Q 2021 FFO I bridge (€m)
                                                      3
                                                                    4
                                                                                                                                          6
                                                                                      5
                                         2
                                                                                                                                                        31.4

                           1

Key drivers
  1   Decrease in rental income mainly due to lower rental income in Hungary.
  2   Positive contribution by acquisitions of investment properties in 2020: Am Karlsbad 11, Pohlstraße 20 (Berlin) and Postepu 14 (Warsaw).
  3   Positive contribution by recent development project completions, mainly MY.O (Munich) and MY.B. (Berlin).
  4   Decrease in rental income mainly due to sale of Zagrebtower (Zagreb) and Weblinger Gürtel (Graz) investment properties.
  5   Compared to the first quarter of the previous year the Covid-19 pandemic impacted the 1Q 2021 FFO I by €-1.4 m (primarily bad debt provisions).

  6   Mainly due to increase in interest expenses following bond issuances in 2020.

                                                                                                                                                                    10
Highlights Results Financing Property ESG Cap. Markets
1Q 2021 Results
Balance sheet as at March 31, 2021
Balance sheet (€m) 31.03.2021 31.12.2020 +/(-) Comments
1 Investment properties 4,734.3 4,723.1 0.2% 1
853.0 791.1 7.8%
Sale of a logistics property in Kassel.
2 Properties under development
Own-used properties 12.4 12.9 (3.9%) Reclassification of ZigZag property in Mainz to
investment properties.
Other long-term assets 10.3 10.5 (2.1%)
Investments in joint ventures 62.3 57.6 8.1%
2
Financial assets 60.1 60.7 (1.1%) Reclassification of ZigZag property in Mainz to
Deferred tax assets 3.9 4.4 (12.0%)
investment properties overcompensated by
continuous investments and revaluation gain of
Properties held for sale 36.9 37.1 (0.5%) Upbeat.
Properties held for trading 35.4 35.2 0.6% 3
3 Cash and cash equivalents 1,057.9 934.9 13.2% Cash increase mainly due to sale of assets
4 Other short-term assets 101.0 152.8 (33.9%)
(Weblinger Gürtel, Graz and Bratislava
Business Center, Bratislava).
Total assets 6,967.4 6,820.3 2.2%
4
Decrease in other short-term assets because of
Shareholders‘ equity 3,172.0 3,128.3 1.4% the closing of the sale of non-strategic assets in
Graz.
5 Long-term financial liabilities 2,504.4 2,622.2 (4.5%)
5
Other long-term financial liabilities 175.0 147.8 18.4%
Reclassification of corporate bond due in 2021
Deferred tax liabilities 561.8 536.3 4.8% from long-term to short-term financial
5 Short-term financial liabilities 309.5 205.3 50.7% liabilities.
Other short-term liabilities 244.6 180.5 35.6%
Total liabilities and shareholders‘ equity 6,967.4 6,820.3 2.2%
11Highlights Results Financing Property ESG Cap. Markets
1Q 2021 Results
Balance sheet metrics as at March 31, 2021
Balance sheet (€m) 31.03.2021 31.12.2020 +/(-)
Total assets 6,967.4 6,820.3 2.2%
Property assets 5,672.0 5,596.2 1.4%
Cash and cash equivalents 1,057.9 934.9 13.2%
Shareholders‘ equity 3,172.0 3,128.3 1.4%
Total debt 2,813.9 2,827.5 (0.5%)
Net debt 1,753.9 1,890.5 (7.2%)
Secured debt 1,051.4 1,053.9 (0.2%)
Unencumbered property assets 2,533.6 2,554.3 (0.8%)
Balance sheet ratios 31.03.2021 31.12.2020
Equity ratio 45.5% 45.9% (34 bps)
LTV 49.6% 50.5% (91 bps)
LTV (net) 30.9% 33.8% (286 bps)
Gearing 88.7% 90.4% (167 bps)
Gearing (net) 55.3% 60.4% (514 bps)
Total debt / Total assets 40.4% 41.5% (107 bps)
Net debt / Total assets 25.2% 27.7% (255 bps)
Secured debt / Total assets 15.1% 15.5% (36 bps)
Net debt / EBITDA (annualised) 10.0 9.7
Rating 1 31.03.2021 31.12.2020
Investment grade rating (Moody‘s) Baa2 (under review) Baa2 (under review)
Outlook Stable (under review) Stable (under review)
1
12
When Starwood Capital announced the anticipatory mandatory offer to the shareholders and owners of convertible bonds of CA Immo, Moody’s placed the rating ‘under review for downgrade’ and the outlook ‘under review’.Highlights Results Financing Property ESG Cap. Markets
1Q 2021 Results
EPRA Net Asset Value (NRV, NTA, NDV)
31.03.2021 31.12.2020
(€m) EPRA NRV EPRA NTA EPRA NDV EPRA NRV EPRA NTA EPRA NDV
IFRS Equity attributable to shareholders 3,172.0 3,172.0 3,172.0 3,128.2 3,128.2 3,128.2
i) Hybrid instruments (Convertible) 273.8 273.8 273.8 235.3 235.3 235.3
Diluted NAV 3,445.8 3,445.8 3,445.8 3,363.5 3,363.5 3,363.5
ii.a) Revaluation of IP (if IAS 40 cost option is used) 9.8 9.8 8.3 9.7 9.7 8.2
ii.b) Revaluation of IPUC (if IAS 40 cost option is used) - - - - - -
ii.c) Revaluation of other non-current investments - - - - - -
iii) Revaluation of tenant leases held as finance leases - - - - - -
iv) Revaluation of trading properties 149.4 137.8 109.8 151.0 138.8 110.9
Diluted NAV at Fair Value 3,605.0 3,593.3 3,563.9 3,524.2 3,512.0 3,482.5
v) Deferred taxes in relation to fair value gains of IP 557.3 486.3 - 531.2 451.9 -
vi) Fair value of financial instruments 28.9 26.3 - 40.5 37.4 -
vii) Goodwill as a result of deferred tax (1.8) (1.8) (1.8) (2.0) (2.0) (2.0)
viii.a) Goodwill as per the IFRS balance sheet - - - - - -
viii.b) Intangibles as per the IFRS balance sheet - - - - - -
ix) Fair value of fixed interest rate debt - - (40.4) - - (57.2)
x) Revaluation of intangibles to fair value - - - - - -
xi) Purchasers' costs 251.9 - - 252.8 - -
NAV 4,441.2 4,104.1 3,521.6 4,346.7 3,999.3 3,423.4
Fully diluted number of shares 99,747,036 99,747,036 99,747,036 99,747,036 99,747,036 99,747,036
NAV per share (€) 44.52 41.14 35.31 43.58 40.09 34.32
13Highlights Results Financing Property ESG Cap. Markets
1Q 2021 Results
EPRA Net Asset Value (NDV, NTA, NRV)
1Q 2021 EPRA NDV/NTA/NRV bridge (€ per share)
4
45.00 2.53 44.52
3 0.71 0.03
0.40 41.14 0.12
4.87 0.26
40.00
2
1.18 0.30
1 35.31
35.00 (0.02) (0.40)
34.54
30.00
Diluted Reval- Goodwill Fixed EPRA Reval- Deferred Financial Fixed EPRA Reval- Deferred Financial Purchasers' EPRA
IFRS uation interest NDV uation taxes instruments interest NTA uation taxes instruments costs NRV
NAV rate rate
debt debt
1 The dilution effect of the outstanding convertible bond (€200 m) is considered (IFRS NAV undiluted €34.10 per share).
EPRA Net Disposal Value: reflects a scenario where deferred tax, financial instruments, and certain other adjustments are calculated as to the full extent of
2
their liability.
3 EPRA Net Tangible Assets: assumes entities buy and sell assets, thereby crystallising certain levels of deferred tax liability.
EPRA Net Reinstatement Value: assets and liabilities that are not expected to crystallise in normal circumstances such as the fair value movements on
4
financial derivatives and deferred taxes on property valuation surpluses are excluded.
14Highlights Results Financing Property ESG Cap. Markets
1Q 2021 Results
Key Metrics
Key metrics (€m) 1Q 2021 1Q 2020 +/(-)
Rental income 63.6 62.4 1.8%
Net rental income 50.5 49.6 1.9%
EBITDA 43.8 38.8 12.9%
EBIT 110.8 26.1 324.1%
Earnings before tax (EBT) 68.7 46.6 47.4%
Consolidated net income 41.4 33.5 23.8%
FFO I 31.4 30.0 4.5%
FFO II 30.0 15.9 88.3%
NAV (IFRS) 1 3,172.0 3,001.3 5.7%
NTA (EPRA) 4,104.1 n.a. n.a.
Key metrics per share (€) 1Q 2021 1Q 2020 +/(-)
Net rental income 0.54 0.53 1.9%
FFO I 0.34 0.32 4.5%
FFO II 0.32 0.17 88.3%
Consolidated net income 0.45 0.36 24.0%
NAV (IFRS) 1 34.10 32.26 5.7%
NTA (EPRA) 41.14 n.a. n.a.
1 Undiluted
15FINANCING
Highlights Results Financing Property ESG Cap. Markets
Financing
Well-balanced maturity profile and diversified debt structure
Debt structure 1 Debt maturity profile (€ m)
800
Well-staggered maturity profile with low amounts 99% of the convertible bond
due over the coming years. 700 converted into shares after the
600 balance sheet date.
Follow-up financings have been secured for 500
construction loans (secured debt developments). 400
300
100% of bank financings and bonds are euro- 200
denominated
100
0
Unencumbered property asset pool of €2.5 bn
2021 2022 2023 2024 2025 2026 2027 2028 2029+
as at March 31, 2021. 2
Secured debt (income-producing assets) Secured debt (development assets)
Corporate bonds Convertible bonds
Debt structure 1 (€m) Debt maturity profile (€ m)
800
3% Bonds
700 99% of the convertible bond
3% converted into shares after the
3% Unicredit
3% 600 balance sheet date.
6% Others 500
DG Hyp 400
8%
Total financial
300
liabilities € 2.8 bn Deutsche
Postbank AG 200
62% Deutsche
12% 100
Hypo
Helaba
0
ING Bank 2021 2022 2023 2024 2025 2026 2027 2028 2029+
Secured debt (AT) Secured debt (GER) Secured debt (CEE) Corporate bonds Convertible bonds
1 Excl. contractually fixed credit lines for follow-up financings of development projects 2 Follow-up financings have been secured for construction loans of development projects earmarked for own portfolio 17Highlights Results Financing Property ESG Cap. Markets
Financing
Stable debt maturities and record low financing costs
Key financing metrics 1 Average debt maturity (years) 1
Bond issuances in 2020 improved key financing 7.0
metrics.
6.0
5.8
Average financing costs incl. interest rate hedges 5.0
4.7
at 1.5% (excl. 1.3%). 4.0 4.0
3.0
Average debt maturity at 4.7 years.
2.0
Interest rate hedging ratio stands at 92%. 1.0
0.0
1Q 2019 2Q 2019 3Q 2019 4Q 2019 1Q 2020 2Q 2020 3Q 2020 4Q 2020 1Q 2021
Average debt maturity Secured debt maturity Unsecured debt maturity
Hedging ratio (%) Average cost of debt (%) 1
2.0%
8%
20% 1.9%
1.8%
1.7%
1.6% 1.6%
Hedging ratio
92% 1.5% 1.5%
1.4% 1.4%
1.3%
1.2%
73% 1Q 2019 2Q 2019 3Q 2019 4Q 2019 1Q 2020 2Q 2020 3Q 2020 4Q 2020 1Q 2021
Total all-in cost Secured all-in cost Unsecured all-in cost
Floating Fixed Hedged
1 Excl. contractually fixed credit lines for follow-up financings of development projects 18Highlights Results Financing Property ESG Cap. Markets
Financing
Weighted average cost of debt and maturities 1
CoD/Maturities (€ m) Outstanding Swaps Avg cost of debt Avg. cost of Avg. debt Avg. swap
debt (nominal (nominal excl. derivatives debt maturity maturity
value) value) incl. Derivatives (years) (years)
Austria 183.2 106.2 1.85% 2.40% 7.7 8.3
Germany 668.2 348.8 1.02% 1.38% 5.3 7.1
Hungary - - - - - -
Poland 86.4 71.0 1.36% 1.66% 4.4 4.6
Czechia 32.8 32.8 1.25% 1.94% 7.8 7.8
Other - - - - - -
Investment portfolio 970.6 558.8 1.22% 1.62% 5.9 7.1
Development projects 88.9 - 1.45% 1.45% 6.0 -
Short-term properties 2 0.0 - 1.75% 1.75% 0.8 -
Group financing 1,741.5 - 1.41% 1.41% 4.0 -
Total group 2,801.0 558.8 1.35% 1.48% 4.7 7.1
1 Excl. contractually fixed credit lines for follow-up financings of development projects 2 Properties held for sale/trading 19Highlights Results Financing Property ESG Cap. Markets
Financing
Robust financial profile with strong equity base
Leverage Interest coverage
55% 6.0x
5.0x
50% 49.6%
4.0x 3.6x
45% 45.5%
3.5x
3.0x
40%
2.0x
35% 1.0x
30.9% 0.0x
30%
2016 2017 2018 2019 2020 Q1 2021 2016 2017 2018 2019 2020 Q1 2021
Equity ratio Loan-to-value Loan-to-value (net) FFO I interest cover FFO I net interest cover
Unencumbered assets (€m, %) Capital structure
3,000 60% 45%
44.7%
2,500 50% 40% 40.4%
2,000 40% 35%
1,500 30% 30%
1,000 20% 25% 25.2%
500 10% 20%
- 0% 15.1%
15%
2016 2017 2018 2019 2020 Q1 2021 2016 2017 2018 2019 2020 Q1 2021
Unencumbered assets (lhs)
Total debt / Total assets Net debt / Total assets
Unencumbered assets / Property portfolio (rhs) Secured debt / Total assets
20PORTFOLIO
Highlights Results Financing Property ESG Cap. Markets
Property Portfolio
Key metrics
Property portfolio 31.03.2021 31.12.2020 +/(-)
Gross asset value (GAV) €m 5,672.0 5,596.2 1.4%
thereof investment properties €m 4,746.7 4,736.0 0.2%
thereof investment properties under development 1 €m 853.0 791.1 7.8%
thereof short-term assets 1 €m 72.3 69.1 4.7%
Investment portfolio 31.03.2021 31.12.2020 +/(-)
Gross asset value 2 €m 4,746.7 4,736.0 0.2%
thereof Austria % 11.2 11.2 (3 bps)
thereof Germany % 47.2 47.1 14 bps
thereof CEE % 41.6 41.8 (10 bps)
Number of properties # 79 79 0.0%
Gross leasing area (GLA) ‘000 sqm 1,368 1,374 (0.4%)
Annualized rent €m 235.0 239.3 (1.8%)
Office share % 90.5 90.3 16 bps
Weighted average lease term (WAULT) years 4.0 4.0 0.0%
Gross initial yield (GIY) % 5.1 5.2 (12 bps)
Occupancy % 92.2 94.8 (257 bps)
22
1 Including land reserves, which in total account for a book value of € 318.5 m 2 Including own used propertiesHighlights Results Financing Property ESG Cap. Markets
Property Portfolio
Overview
Property portfolio by region (book value) Property portfolio by city (book value) Property portfolio by structure (book value)
1%
Berlin
9% 5% Investment
7% Munich 10% properties
26% 5%
8% Vienna
Germany Land
Frankfurt reserves
2
Total GAV: CEE Total GAV: Total GAV:
36% 10% €5.7 bn Budapest
€5.7 bn 55% €5.7 bn
Active
Warsaw
Austria development
9% 17% Prague projects
Bucharest 84% Short-term
9% 9% properties
Other
Investment portfolio by region (book value) 1 Investment portfolio by city (book value) Investment portfolio by asset class (book value)
Berlin 4%
11% 5%2% 6%
8% 24% Munich
Germany Vienna Office
8%
Budapest
Total GAV: 47% CEE Total GAV: Total GAV:
€4.7 bn €4.7 bn Warsaw €4.7 bn Hotel
13%
42%
Austria Bucharest
18% Other
Prague
11%
11% Other 90%
Frankfurt
1 2
23
Including own used properties Partly held at amortised cost under current assetsHighlights Results Financing Property ESG Cap. Markets
Investment Portfolio
Core market metrics
Properties 16 Properties 9
Total area 219,200 sqm Total area 171,800 sqm
Gross initial yield 3.5% Gross initial yield 6.2%
Gross rental income €39.3 m Gross rental income €36.4 m
Occupancy (economic) 98.1% Occupancy (economic) 91.8%
WAULT 5.8 years WAULT 2.7 years
Properties 5
Total area 131,600 sqm
Gross initial yield 5.5%
Gross rental income €21.3 m
Occupancy (economic) 93.8%
Properties 5 WAULT 2.6 years
Total area 39,700 sqm
Gross initial yield 5.0% Properties 11
Gross rental income €8.4 m Total area 218,600 sqm
Occupancy (economic) 98.0% Gross initial yield 6.0%
WAULT 10.2 years Gross rental income €31.2 m
Occupancy (economic) 79.6%
WAULT 2.8 years
Properties 8 Properties 12 Properties 7
Total area 147,200 sqm Total area 218,500 sqm Total area 164,600 sqm
Gross initial yield 3.4% Gross initial yield 5.5% Gross initial yield 7.9%
Gross rental income €29.4 m Gross rental income €28.1 m Gross rental income €31.0 m
Occupancy (economic) 85.2 Occupancy (economic) 89.9% Occupancy (economic) 93.7%
WAULT 6.0 years WAULT 4.1 years WAULT 3.3 years
Includes properties used for own purposes, short-term property assets and the projects NEO office (Munich) and ZigZag (Mainz), which were added to the investment portfolio but is still in the stabilisation phase 24Highlights Results Financing Property ESG Cap. Markets
Investment Portfolio
Overview
Book value (€m) 1Q 2021 1 1Q 2020 2 +/(-) Occupancy (%) 1Q 2021 1 1Q 2020 2 +/(-)
Austria 524.4 565.5 (7.3%) Austria 89.7 91.5 (180 bps)
Czechia 387.9 390.7 (0.7%) Czechia 93.8 95.3 (144 bps)
Germany 2,130.7 1,681.2 26.7% Germany 98.6 98.8 (19 bps)
Hungary 524.2 525.1 (0.2%) Hungary 79.6 93.1 (1,353 bps)
Poland 555.1 517.9 7.2% Poland 91.8 96.4 (465 bps)
Romania 390.1 399.2 (2.3%) Romania 93.7 93.6 18 bps
Other 82.9 175.0 (52.6%) Other 92.5 93.5 (109 bps)
Total 4,595.3 4,254.6 8.0% Total 92.2 95.2 (297 bps)
Annualized rent (€m) 1Q 2021 1 1Q 2020 2 +/(-) Gross initial yield (%) 1Q 2021 1 1Q 2020 2 +/(-)
Austria 27.5 30.0 (8.4%) Austria 5.2 5.3 (7 bps)
Czechia 21.3 21.7 (1.9%) Czechia 5.5 5.5 (6 bps)
Germany 77.7 65.6 18.5% Germany 3.6 3.9 (26 bps)
Hungary 31.2 35.8 (12.8%) Hungary 6.0 6.8 (87 bps)
Poland 36.4 31.2 16.5% Poland 6.6 6.0 52 bps
Romania 31.0 30.2 2.7% Romania 8.0 7.6 38 bps
Other 7.8 14.7 (46.9%) Other 9.4 8.5 96 bps
Total 232.9 229.2 1.6% Total 5.1 5.4 (32 bps)
1 Excludesproperties used for own purposes and the projects NEO office (Munich) and ZigZag (Mainz), which were added to the investment portfolio but is still in the stabilisation phase 2 Excludes properties used for
own purposes and short term property assets; excl. the office buildings Orhideea Towers (Bucharest), ViE (Vienna) and the Bürogebäude am Kunstcampus (Berlin), which have been completed and transferred to the
investment portfolio in 2018 and 2019 respectively and are still in the stabilisation phase. Incl. land leases in Austria (around 106,000 sqm) 25Highlights Results Financing Property ESG Cap. Markets
Investment Portfolio
WAULT
Well-staggered lease maturity profile Weighted average unexpired lease term (WAULT, years)
14
Strong tenant retention rate across the portfolio. 12.9
12
CA Immo’s organic growth strategy and the
corresponding high share of own developments in its 10
largest portfolio Germany has resulted in a young 8
portfolio age ( 8 years on average) and a longer 7.2
6
remaining lease term. 5.6 5.2 5.1
Longer lease terms in Germany led to a significant 4 3.6
3.2 2.7
under-rent in light of strong market rent uplifts in recent 2
years. 6.2 4.0 3.3 2.8 2.7 2.6 2.5 4.1
0
Shorter CEE lease terms in line with market standards Germany Austria Romania Hungary Poland Czechia Other Total
require higher leasing activity and underpin CA Immo’s WAULT to break WAULT to last extension
strong market position and leasing track record.
Lease expiry profile 2021 (%, annualised rent) 1 Lease expiry profile (€m) 1
90.00
Vienna 35%
3%3% 80.00
6% Budapest
23% 70.00
Warsaw
7% 60.00
Prague
50.00
8% Bucharest 16%
40.00 14%
14% 12%
Other 30.00
Berlin 9%
9% 18% 20.00
Frankfurt 10.00
14% Munich -
2021 2022 2023 2024 2025 2026ff
Austria Germany CEE
1 Annualised rent 26Highlights Results Financing Property ESG Cap. Markets
Investment Portfolio
Like-for-like performance
Market Fair value (€m) Rental income (P&L, €m) Yield (%) 1 Occupancy (%) 2
1Q 21 1Q 20 +/(-) 1Q 21 1Q 20 +/(-) 1Q 21 1Q 20 +/(-) 1Q 21 1Q 20 +/(-)
Austria 524.4 531.6 (1.4%) 7.1 6.9 3 3.2% 5.2 5.2 +3 bps 89.7 90.9 (115bps)
Czechia 387.9 390.7 (0.7%) 5.1 5.1 (0.3%) 5.5 5.5 (6bps) 93.8 95.3 (144bps)
Germany 1,824.3 1,673.1 1 9.0% 18.7 18.4 1.6% 3.7 3.9 (21bps) 98.5 98.8 (29bps)
Hungary 524.2 525.1 (0.2%) 8.5 9.5 (10.6%) 6.0 6.8 (87bps) 79.6 93.1 (1,353bps)
Poland 467.3 491.8 (5.0%) 7.0 7.2 (2.8%) 6.4 6.3 +9 bps 91.9 96.4 (454bps)
Romania 390.1 398.7 (2.2%) 8.9 9.4 (4.7%) 8.0 7.6 +38 bps 93.7 93.6 +18 bps
Other 3 82.9 89.6 (7.5%) 2.2 2.2 (1.8%) 9.4 9.0 +42 bps 92.5 96.4 (397bps)
Total 4,201.0 4,100.7 1 2.4% 57.5 58.7 2 (2.0%) 4 5.1 5.4 (22bps) 5 91.9 95.3 (336bps)
Key drivers (1Q 2021)
1 Positive revaluation result in Germany outweighs fair value decreases in other markets.
2 Rental income decrease in Hungary and Romania was not fully compensated by increases in Austria and Germany
3 Rental income in Austria increased despite Covid-19 related income suspensions in hotel and retail properties and lower occupancy.
4 Portfolio yield dropped by 22bps with strongest driver being revaluation uplift in Germany.
5 With the exception of Romania, the occupancy rate declined slightly in all markets. However, the decline in occupancy did not lead to an equally significant
decrease in rental income.
1 2 3
27
Annualised rent / Book value Economic (Annualised rent / Rent full occupancy) SerbiaHighlights Results Financing Property ESG Cap. Markets
Property Portfolio
Leasing
Leasing update 1Q 2021
Market Project pre- New leases / Lease Total leasing % of total Total leasing In % of total
letting (sqm) expansions extensions (sqm) investment investment
(sqm) (sqm) portfolio portfolio
Austria - 2,561 11,283 13,844 17% 13,844 6%
Czechia 1,327 - 1,368 2,695 3% 1,368 1%
Germany 41,957 - 12,765 54,722 67% 12,765 3%
Hungary - 3,195 346 3,541 4% 3,541 2%
Poland - 1,009 2,340 3,349 4% 3,349 2%
Romania - 199 3,174 3,373 4% 3,373 2%
Total 43,284 6,965 31,275 81,523 100% 38,240 3%
In 1Q 2021, a total of 81,500 sqm of rentable floor space was newly let or extended (+157% yoy). 62% of the total accounted for new leases, expansion of
space or pre-leases, 38% were lease extensions.
Office space accounted for around 83% of total lettings performance.
Berlin (50,508 sqm), Vienna (13,844 sqm) and Budapest (3,541 sqm) recorded the highest letting activity by volume in 1Q 2021.
The largest single leases as well as the largest volumes per asset were concluded in the properties Upbeat (Berlin), Hallesches Ufer (Berlin), Karlsbad (Berlin)
Handelskai (Vienna) and Warsaw Towers (Warsaw).
28Highlights Results Financing Property ESG Cap. Markets
Investment Portfolio
Reversionary potential
Case study reversionary potential Europacity Berlin
A significant portion of CAI’s activity in Berlin is focused in the prime Europacity submarket, where
significant development and leasing activity has taken place over the past 10 years, and is expected to
continue in the future.
This concentrated holding is a good illustration of some of the reversionary potential in the portfolio.
Until 2017, CAI’s income producing portfolio increased to 61,000 sqm, with around 84,000 sqm of
total leasing being completed at an average office rent of €19 psqm.
Between 2018 and 2021, the existing portfolio has grown to 91,000 sqm, with a further 100,000 sqm
of total leasing being completed at an average office rent of €32 psqm.
Currently, the weighted average office rent of CAI’s Europacity portfolio is €22.5 psqm, which, based
upon average leases achieved over the past 3 years, would imply a potential for at least 40%
reversionary upside as older leases from 2012 to 2017 mature and roll.
Average office rents signed by CA Immo in Europacity
7,200 3,800 5,700 16,800 26,600 10,500 24,800 34,100 3,700 37,600
40.0 100,000
90,000
35.0 80,000
70,000
30.0 60,000
50,000
25.0 40,000
30,000
20.0 20,000
10,000
15.0 -
2012 2013 2014 2015 2016 2017 2018 2019 2020 2021
GLA CAI portfolio Weighted average Weighted average GLA signed (sqm)
Europacity (sqm) rent signed cumulative rent signed
29Highlights Results Financing Property ESG Cap. Markets
Investment Portfolio
Tenant structure
Tenant base Tenant industry mix (annualized rent) Top 200 tenants (annualized rent)
High degree of blue chip tenants with investment grade
1% Business &
rating. Professional Services
9% 12%
Technology Public tenants
No industry dependency due to diversified tenant 26%
12%
structure (> 1,000 tenants in total). Consumer Services
& Leisure 43%
100% of 79% of IG-rated
Largest tenant PricewaterhouseCoopers accounts for annualized rent Manufacturing, annualized rent tenants
Industrial & Energy
14%
3.2% of annualized rental income. Financial Services
46%
100% of leases across the entire portfolio are 21% Other tenants
Public Sector /
17% Regulatory Body
euro-denominated and more than 90% are CPI-indexed.
Other
Largest tenants Top tenants selection
Top 40 tenants account for 47% and top 100 tenants
account for 64% of total annualized rental income.
Average WAULT (to break) of top 40 tenants at 5.2 years
and for top 200 tenants at 4.5 years.
88 of the top 200 tenants have an investment grade
rating and 17 account for the category “Public
sector/Regulatory body”.
30Highlights Results Financing Property ESG Cap. Markets
Investment Portfolio
Blue chip tenant structure with a service and technology focus (I)
Top 40 tenants (annualized rent)
Tenant Industry City %
PWC Professional Services Munich 3.2%
InterCity Consumer Services & Leisure Berlin, Frankfurt 2.7%
Frontex Public Sector / Regulatory Body Warsaw 2.5%
Google Computers / Hi-Tech Munich 2.0%
British American Tobacco Manufacturing Industrial & Energy Bucharest 1.9%
Morgan Stanley Financial Services Budapest 1.9%
KPMG Professional Services Berlin 1.8%
Land Berlin Public Sector / Regulatory Body Berlin 1.8%
TOTAL Manufacturing Industrial & Energy Berlin 1.7%
Robert Bosch Consumer Services & Leisure Vienna 1.6%
Verkehrsbüro Consumer Services & Leisure Vienna 1.6%
JetBrains Computers / Hi-Tech Munich 1.6%
Bundesanstalt für Immobilienaufgaben Public Sector / Regulatory Body Berlin 1.5%
Hypoport Financial Services Berlin 1.4%
AstraZeneca Manufacturing Industrial & Energy Warsaw 1.4%
salesforce Computers / Hi-Tech Munich 1.1%
Accenture Business Services Prague, Warsaw 1.1%
Volksbank Wien Financial Services Vienna 1.0%
ORANGE Computers / Hi-Tech Bucharest 1.0%
Finastra Computers / Hi-Tech Bucharest 0.9%
31Highlights Results Financing Property ESG Cap. Markets
Investment Portfolio
Blue chip tenant structure with a service and technology focus (II)
Top 40 tenants (annualized rent)
Tenant Industry City %
Thales Computers / Hi-Tech Bucharest 0.9%
Bitdefender Computers / Hi-Tech Bucharest 0.8%
BT Roc Business Services Budapest 0.8%
Benefit Systems Consumer Services & Leisure Warsaw 0.7%
NXP Semiconductors Manufacturing Industrial & Energy Budapest, Bucharest 0.7%
Meininger Consumer Services & Leisure Frankfurt, Vienna 0.7%
ADO Immobilien Business Services Berlin 0.7%
DXC Technology Business Services Budapest 0.7%
White & Case Professional Services Berlin 0.7%
Indeed Deutschland Business Services Duesseldorf 0.7%
K&H Bank Financial Services Budapest 0.6%
Centre for EU Transport Projects Public Sector / Regulatory Body Warsaw 0.6%
NCR Corporation Computers / Hi-Tech Belgrade 0.6%
Vodafone Computers / Hi-Tech Prague, Budapest, Bucharest 0.6%
Berlinovo Immobilien Gesellschaft Business Services Berlin 0.6%
ICZ Group Computers / Hi-Tech Warsaw, Prague 0.6%
Samsung Computers / Hi-Tech Warsaw 0.6%
Computer Generated Solutions Business Services Bucharest 0.5%
Ecovis Professional Services Munich 0.5%
Ipsos Business Services Bucharest 0.5%
32Highlights Results Financing Property ESG Cap. Markets
Investment Portfolio
Largest assets (I)
Skygarden, Munich Kontorhaus, Munich Millennium Towers, Budapest My.O, Munich JFK House, Berlin
Value € 280 m Value € 224 m Value € 203 m Value € 169 m Value € 141 m
Occupancy 100% Occupancy 98% Occupancy 89% Occupancy 100% Occupancy 96%
Tenants PwC Tenants Google, Salesforce Tenants Morgan Stanley Tenants JetBrains Tenants White & Case, Airbus
MY.B, Berlin Tour Total, Berlin Warsaw Spire B, Warsaw Riverplace, Bucharest Kavci Hory, Prague
Value € 121 m Value € 118 m Value € 115 m Value € 107 m Value € 105 m
Occupancy 99% Occupancy 100% Occupancy 100% Occupancy 93% Occupancy 98%
Tenants Hypoport Tenants Total Tenants Frontex Tenants BAT Tenants ICZ, Wüstenrot
33Highlights Results Financing Property ESG Cap. Markets
Investment Portfolio
Largest assets (II)
Heidestraße 58, Berlin Postepu 14, Warsaw Warsaw Spire C, Warsaw Ambigon, Munich Galleria, Vienna
Value € 98 m Value € 98 m Value € 94 m Value € 91 m Value € 90 m
Occupancy 100% Occupancy 91% Occupancy 93% Occupancy 100% Occupancy 88%
Tenants KPMG Tenants Samsung, A.Zeneca Tenants Benefit Systems SA Tenants BCD Travel Tenants Willhaben
Spreebogen InterCity Hotel, Berlin Königliche Direktion, Berlin NEO, Munich Capital Square, Budapest
Value € 90 m Value € 89 m Value € 85 m Value € 85 m Value € 83 m
Occupancy 100% Occupancy 100% Occupancy 100% Occupancy 18% Occupancy 80%
Tenants Land Berlin Tenants InterCity Tenants BImA Tenants Tristar, BImA Tenants KCI Hungary
34Highlights Results Financing Property ESG Cap. Markets
Investment Portfolio
Capital rotation (I)
Latest acquisitions
Am Karlsbad 11, Berlin Postepu 14, Warsaw Pohlstrasse 20, Berlin
Country Germany Country Poland Country Germany
Status Investment Status Investment Status Investment
Sector Office Sector Office Sector Office
GLA 10,098 GLA 34,490 GLA 7,788
GRI €1.3 m GRI €6.5 m GRI €1.3 m
Volume €76 m Volume €87 m Volume €47 m
35Highlights Results Financing Property ESG Cap. Markets
Investment Portfolio
Capital rotation (II)
Closed disposals 2021 YTD
Property CAI Country City Property Sector GLA GRI at sale Gross Premium /
share status (sqm) (€m) proceeds discount to
(%) (€m) BV (%) 1
1Q 2021
Land plot Duesseldorf 100% GER Duesseldorf Land Residential 179 - 0.4 -
Land plot Luebeck 100% GER Luebeck Land Hotel 6,992 - 3.5 834%2
BBC 1 / BBC 1 Plus 100% SK Bratislava Investment Office 25,471 3.2 34.9 3%
Hafeninsel I 50% GER Mainz Land Residential 6,500 - 13.7 596%2
Marina A + B 50% GER Mainz Land Mixed Use 6,750 - 13.0 1,107%2
Vor dem Osterholz 10-14 100% GER Kassel Investment Logistic 11,499 0.5 9.7 8%
Subtotal 57,391 3.7 74.8 353%
2Q 2021 YTD
Dortmund 100% GER Dortmund Land Residential 15,500 0.0 4.8 1,110%2
BelsenPark 100% GER Duesseldorf Land Mixed Use 34,578 - 61.9 145%
Marina Invest & Facilities 50% GER Mainz Other Mixed Use - - 1.5 -
Horsthauser Straße 100% GER Herne Land Residential - - 0.8 2,251%2
Subtotal 50,078 0.0 69.0 231%
Total 107,469 3.7 144.2 292%
1
36
Based on net price 2 Premium to book value according to IAS 2 accounted at amortized historical costHighlights Results Financing Property ESG Cap. Markets
Investment Portfolio
Capital rotation (III)
Selected planned disposals 2021
Meininger Hotel Rembrandstrasse, Vienna Canada Square, Budapest Wspólna, Warsaw
Country Austria Country Hungary Country Poland
Status Investment Status Investment Status Investment
Sector Hotel Sector Office Sector Office
GLA 5,000 sqm GLA 5,000 sqm GLA 7,700 sqm
GRI €0.7 m GRI €0.9 m GRI €1.2 m
Status Exclusivity Status Marketing Status Marketing
Bodenseestrasse 225-229, Munich Rheinwiesen I, Mainz Kaufmannshof, Mainz
Country Germany Country Germany Country Germany
Status Investment Status Land Status Development
Sector Hotel Sector Office Sector Mixed use
GLA 5,000 sqm GLA 19,000 sqm GLA 6,900 sqm
GRI €0.4 m GRI - GRI -
Status Marketing Status Marketing Status Marketing
37Highlights Results Financing Property ESG Cap. Markets
Property Portfolio
Prime locations in all core markets
Property portfolio split by city
(book value)
Berlin Munich
5%
7%
26%
8%
10% Total GAV
€5.7 bn
9% 17%
9% 9%
Berlin Munich Vienna
Frankfurt Budapest Warsaw
Prague Bucharest Other
Key facts
Frankfurt Vienna
CA Immo‘s properties
exclusively located in prime
inner-city locations.
Well-connected to
transportation nodes with a
large number of assets within
walking distance to main
stations.
Access to high-quality land
bank in sought-after locations
will increase portfolio in core Standing assets Properties under construction Land reserves
markets.
38Highlights Results Financing Property ESG Cap. Markets
Property Portfolio
Prime locations in all core markets
Property portfolio split by city
(book value)
Warsaw Bucharest
5%
7%
26%
8%
10% Total GAV
€5.7 bn
9% 17%
9% 9%
Berlin Munich Vienna
Frankfurt Budapest Warsaw
Prague Bucharest Other
Key facts
Prague Budapest
Portfolio focussed on eight
core urban gateway cities
that share favourable long
term structural trends.
Minimum portfolio value of
€ 300 m per city efficiently
managed by local teams to
allow for best management
and high tenant retention.
Standing assets Properties under construction Land reserves
39DEVELOPMENT
Highlights Results Financing Property ESG Cap. Markets
Development
Development start Upbeat, Berlin (I)
Project overview
Long-term lease agreement with investment grade leading financial institution
Deutsche Kreditbank AG
Lease covers 34,850 sqm of office, storage, and other area types (F&B, trading,
fitness, terrace), as well as 132 indoor parking places.
Though not rated independently, the credit rating of their direct parent company
BayernLB is investment grade (Moody’s Aa3), with sovereign credit above that.
Building description
Developed towards DGNB (Gold), WiredScore (Platin) and WELL-being (Gold)
standards at a minimum and feature a number of environmental measures such as
green roof areas, solar panels and loading points for e-cars and e-bikes.
Equipped with an extensive package of state of the art digital features, making it
future proof both for landlord, as well as tenant and employees.
In total 34,850 sqm of GLA is planned to be developed, with a building height of 82
meters across three podium levels. On completion Upbeat will be the 7th largest
building by GLA in CA Immo’s portfolio.
Permission status & timing
Zoning is in place and secured with a granted preliminary building permit. The
application for the full final building permit was submitted in December 2020, and is
expected to be approved mid-2021.
We expect to break ground in 3Q 2021 and anticipate the handover to the tenant at
the beginning of 2026.
41Highlights Results Financing Property ESG Cap. Markets
Development
Development start Upbeat, Berlin (II)
Key metrics
Total investment volume ~ €283 m
Outstanding investment €249 m
Rental area 34,911 sqm
Expected yield on cost 5.2%
Scheduled completion 1Q 2026
Economic pre-let ratio 100%
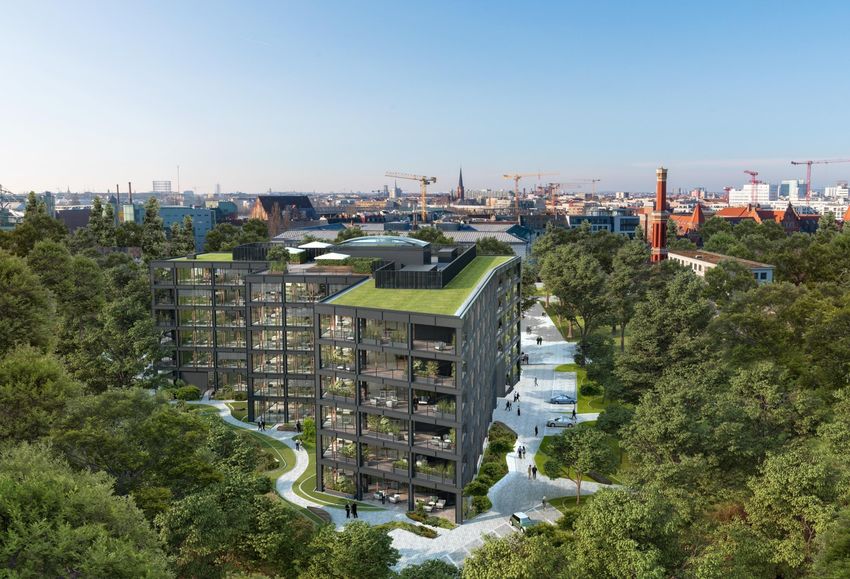
Key facts
Located at the northern entrance of the
Europacity submarket.
Construction start planned in 3Q 2021.
The construction will follow the highest
sustainability, health and connectivity
standards (DGNB Gold, WiredScore platinum
and WELL Gold).
42Highlights Results Financing Property ESG Cap. Markets
Development
Development start Upbeat, Berlin (III)
Overview Europacity, Berlin
43Highlights Results Financing Property ESG Cap. Markets
Development
Commercial value chain
Zoning Planning Under construction Completion
Millennium plot, Frankfurt Upbeat, Berlin Hochhaus am Europaplatz, Berlin MY.B, Berlin
Investment property Under construction
Former development Land reserve
High rise landmark Technical parameters: Technical parameters:
development in the north of
the Europacity submarket. Construction period: Construction period:
Potential mixed use (commercial/ 4Q 2019 – 4Q 2023e. 3Q 2017 – 1Q 2020.
residential) development. Preliminary building
application was submitted in Total investment volume of Total investment volume of
Urban development agreement with €141 m.
2019. €68 m.
the city of Frankfurt signed in 2020.
100% pre-lease of 34,850 Commercial parameters: Commercial parameters:
Next zoning/planning steps in
preparation. sqm in 20 floors above 100% pre-let to KPMG before Fully pre-let before
ground signed with Deutsche construction start completion.
Kreditbank AG (fully backed
Adjacent office Heidestraße Rental area handover to
by the public sector via two
58 also fully let to KPMG tenants fully completed.
different entities).
Expected yield on cost 6.3% Yield on cost achieved 7.3%.
Expected investment volume
of €283 m.
Revaluation result of €65 m in 1Q 2021 driven by zoning/planning, construction and commercialization/leasing progress.
44Highlights Results Financing Property ESG Cap. Markets
Development
Residential value chain
Zoning/Planning Under construction/Completion
Eggartensiedlung, Munich Ratoldstraße, Munich NEO residential, Munich
50:50 joint venture with local developer In 2016 the urban landscape competition Part of residential/mixed-use quarter
Büschl Group. was decided. development in Baumkirchen.
In 2019 Munich’s city council decided to put The goal of the competition was to draft a Completion of the NEO mixed-use building
up a local development plan for Eggarten plan for the currently underused 14 ha plot (office/hotel/residential) marks the fourth
quarter (1,750 - 2,000 apartments). for around 900 apartments. step in the Baumkirchen urban quarter
development.
The aim is to develop a sustainable and The use of the site will be split between
flourishing city quarter concept, which will townhouses, multi-family houses, Technical parameters:
serve as a model for Munich in terms of apartment buildings and social housing.
Construction period: 1Q 2017 – 1Q 2021.
climate protection, energy and mobility.
Current planning foresees four project/
Total investment volume of the residential
In 2020 the jury awarded the winners of the building phases.
part of €30.8 m.
urban and landscape planning competition.
The next steps are the approval resolution
Those results will provide the basis for the Commercial parameters:
and the architectural workshop with
further ongoing planning procedure (process Closing of sale to BMO took place in October
expected planning readiness this year.
expected to complete in the course of 2023). 2020.
45Highlights Results Financing Property ESG Cap. Markets
Development Projects Under Construction
Mississippi House & Missouri Park, Prague (Completion in 2021)
Key metrics
Total investment volume €64.5 m
Outstanding investment €24.8 m
Rental area 20,760 sqm
Expected yield on cost 6.5%
Scheduled completion 3Q 2021
Economic pre-let ratio 37%
Key facts
Mississippi & Missouri offices will complete
the River City Campus in Karlin, Prague 8.
CA Immo‘s prime assets Nile House, Danube
House and Amazon Court are also located in
the River City.
The construction will follow the highest
sustainability standards (LEED platinum).
46Highlights Results Financing Property ESG Cap. Markets
Development Projects Under Construction
ONE, Frankfurt (Completion in 2022)
Key metrics
Total investment volume €413.3 m
Outstanding investment €172.4 m
Rental area 68,575 sqm
Expected yield on cost 5.6%
Scheduled completion 1Q 2022
Economic pre-let ratio 38%
Key facts
High rise hotel & office building with a flexible
floor plan and a multi-storey car park and
logistics building.
High quality development offers all possibilities
of smart, modern and technical infrastructure.
More than 75% of construction works
contracted.
Pre-let ratio on the basis of rental area at
50%.
47Highlights Results Financing Property ESG Cap. Markets
Development Projects Under Construction
Grasblau, Berlin (Completion in 2023)
Key metrics
Total investment volume €67.0 m
Outstanding investment €39.9 m
Rental area 13,383 sqm
Expected yield on cost 8.3%
Scheduled completion 2Q 2023
Economic pre-let ratio -
Key facts
Modern office building with a high degree of
sustainability and a good connection to public
and private transport.
Utilization of building reserve on the plot of an
existing investment property in the immediate
vicinity of Potsdamer Platz.
48Highlights Results Financing Property ESG Cap. Markets
Development Projects Under Construction
Hochhaus am Europaplatz, Berlin (Completion in 2023)
Key metrics
Total investment volume €141.5 m
Outstanding investment €73.5 m
Rental area 22,948 sqm
Expected yield on cost 6.3%
Scheduled completion 4Q 2023
Economic pre-let ratio 100%
Key facts
Development of a fully pre-leased modern
Class-A high rise office building on the Baufeld
04 site in the heart of Berlin’s Europacity
submarket.
Construction of an 84 m high (21 storey) high
rise office building.
Pre-lease for 100% of the space of (KPMG
also leases 100% of the space in the adjacent
property Heidestraße 58 owned by CA
Immo).
49Highlights Results Financing Property ESG Cap. Markets
Development Projects Under Construction
Project overview
Investment portfolio Investment Outstanding Planned Gross yield Main usage Economic Scheduled
volume investment rentable on cost (%) pre-let ratio completion
(€m) 1 (€m) area (sqm) (%)
Upbeat (Berlin) 282.6 249.3 34,911 5.2 Office 100 1Q 2026
ONE (Frankfurt) 413.3 172.4 68,575 5.6 Office 38 1Q 2022
Mississippi House (Prague) 39.8 15.1 13,383 6.7 Office 40 3Q 2021
Missouri Park (Prague) 24.7 9.7 7,376 6.2 Office 33 3Q 2021
Hochhaus am Europaplatz (Berlin) 141.5 73.5 22,948 6.3 Office 100 4Q 2023
Grasblau (Berlin) 67.0 39.9 13,350 8.3 Office 0 2Q 2023
Total 968.9 560.0 160,544 5.8 62
Projects under construction (€ m) EPRA NRV per share contribution committed development projects (€)2
12.00
0.1 0.1
7% 10.00
0.9
8.00 0.8
Frankfurt 5.6
43% 6.00
Total investment 2.4
volume: Berlin
€969 m 4.00
51% 1.4
Prague 2.00
-
ONE Upbeat Hochhaus am Grasblau Mississippi Missouri Park Total
Europaplatz House
NAV contribution realized Future NAV contribution (estimated)
Excl. joint ventures 1 2
Incl. plot values (total investment volume excl. plot values amounts to €865.8 m) Based on current forecasts (pre-tax).
50ENVIRONMENTAL, SOCIAL & CORPORATE GOVERNANCE
Highlights Results Financing Property ESG Cap. Markets
Sustainability
Organizational structure and reporting
Organizational integration and management
Strategy, Monitoring,
Key incorporation in the corporate strategy. Controlling Executive Board
Targeted definition and management of
strategic sustainability activities by cross-
departmental ESG committee. ESG committee
ESG Management & Corporate Communications &
Sustainability, Corporate
ESG focus implemented in compensation Supervision, Reporting
Office/Compliance, Head of Operational
model at all levels. Departments
The performance-related Executive Board
compensation includes ESG components and
takes into account long-term stakeholder Operative Measures, Asset Development Investment Backoffice (HR
interests. Data Management Management etc.)
EPRA Gold Award for outstanding sustainability reporting
The intensive ongoing improvement of our sustainability reporting was recognized by the European
Public Real Estate Association (EPRA) with the granting of an "EPRA Sustainability Gold Award" for
the 2019 Annual Report.
ESG reporting was additionally expanded in 2020.
Continuous expansion planned in line with international standards and stakeholder requirements.
52Highlights Results Financing Property ESG Cap. Markets
Sustainability
Agenda for sustainable business operations (I)
Agenda for sustainable business operations
Climate & Energy Sustainable procurement & supply chain
SDG goals SDG goals
Targets & Principals: Targets & Principals:
Reduction of average CO2 emissions in building operation. Social and environmental requirements in CA Immo Procurement Directive.
Reduction of energy consumption of the investment portfolio.
Measures:
Increase the climate resilience of the portfolio.
Obligation of all construction service providers to comply with the
Measures: sustainability standards according to DGNB Gold or LEED Gold (e.g. material
declaration, worker protection).
100% electricity from renewable energy sources in the existing portfolio by
2023.
Development of a green lease strategy to increase the share of renewable
electricity in the investment portfolio. Resource conservation & Circular economy
Digital measurement of energy key figures for 100% of the multi-tenant
SDG goals
office portfolio by 2025. Targets & Principals:
Active energy management and energy optimisation of the investment Increase the share of recycled/recyclable waste & reduction of water
portfolio. consumption.
Definition of a group-wide standard for sustainable project development
based on tenant needs and the EU Taxonomy Regulation. Measures:
Development of all new office and hotel buildings according to at least Implementation of an active waste management system and water
DGNB Gold or LEED Gold certification standard. consumption monitoring in building operations.
Green lease contracts for optimization of waste separation.
53Highlights Results Financing Property ESG Cap. Markets
Sustainability
Agenda for sustainable business operations (II)
Agenda for sustainable business operations
Sustainable urban district development Business ethics, Corporate Governance &
Compliance
SDG goals SDG goals
Targets & Principals: Targets & Principals:
Clear focus on brownfield developments (revitalisation of old sites). Responsible corporate governance and compliance with socially,
environmentally and economically relevant requirements.
Measures:
100% of all buildings currently developed by CA Immo are brownfield Measures:
developments. Commitment to strengthening worker´s rights, preventing human rights
Continuation of the strategic focus on revitalisation of old sites. abuses and acting in accordance with the principles of non-discrimination,
equal opportunities and zero tolerance of corruption and bribery throughout
Development of all new office and hotel buildings according to at least our sphere of influence.
DGNB Gold or LEED Gold certification standard.
Certified property assets by book value (€ bn)
Health & Safety
4.0
SDG goals
Targets & Principals:
51%
3.0 61% Avoiding accidents in buildings and on construction sites & maintaining the
long-term performance of own and external employees (tenants,
62%
contractors).
2.0 59%
Measures:
1.0 34% Consideration of a wide range of measures for the health and comfort of
36%
35% future users already in the course of building planning and development
38%
(DGNB, LEED, WELL certification standards).
3% 2% 3%
4%
0.0 Standardised safety concepts on construction sites and in building operation
2017 2018 2019 2020
Comprehensive protective measures in the wake of the Covid-19 pandemic.
Austria Germany CEE In certification process
Occupational health care, flexible working time models. 54Highlights Results Financing Property ESG Cap. Markets
Sustainability
Initiatives for climate and environmental protection
Sustainability certification Office investment portfolio according to certification standard
As of December 31, 2020, 71% of the total building stock (office: 74%) was DGNB Gold
16%
certified according to LEED, BREEAM or DGNB (43 office and 2 hotel buildings). DGNB Platin
26%
Taking into account the buildings in the certification process, 78% of the total
LEED Gold
stock was certified. 10%
LEED Platin
€4.3 bn
7% BREEAM Interim
Reduction of the CO2 footprint 13%
4% BREEAM Very Good
Group-wide conversion of energy procurement to CO2-neutral, renewable 15% 9% BREEAM Excellent
energy sources (electricity and gas) almost completed; conversion of actual Not certified
operations to green electricity will take place when current energy contracts
expire.
CO2 emissions 1 (kg CO2e/sqm/year)
Energy management -12%
Establishment of a Group-wide, digitally supported energy management system 52
-20%
initiated in 2020.
46
Effective monitoring and controlling of current consumption and emissions data 37
through conversion to smart meters (digital meters) and implementation of
energy data management software.
Widespread rollout of digital meters will start in 2021.
2018 2019 2020e
1 Basis: office buildings. Total building incl. general electricity, heating and cooling, excl. tenant electricity. The estimated values for 2020 are based on around 50% of the data basis. 55You can also read