Wind power forecasting: IEA Wind Task 36 & future research issues - IEA Wind TCP
←
→
Page content transcription
If your browser does not render page correctly, please read the page content below
Wind power forecasting: IEA Wind Task 36 & future
research issues

       G Giebel1, J Cline2, H Frank3, W Shaw4, P Pinson5, B-M Hodge6, G Kariniotakis7,
       J Madsen8 and C Möhrlen9
       1
         DTU Wind Energy, Risø, Frederiksborgvej 399, 4000 Roskilde, Denmark
       2
         Department of Energy, Wind and Water Power Program, 1000 Independence Ave.
       SW, Washington DC 20585, USA
       3
         Deutscher Wetterdienst, Frankfurter Str. 135, D-63067 Offenbach, Germany
       4
         Pacific Northwest National Laboratory, 902 Battelle Boulevard, P.O. Box 999, MSIN
       K9-30, Richland, WA 99352 USA
       5
         DTU Elektro, Ørsteds Plads, 2800 Kgs. Lyngby, Denmark
       6
         National Renewable Energy Laboratory, 15013 Denver West Parkway, MS ESIF200,
       Golden, CO 80401, USA
       7
         MINES ParisTech, PSL Research University, Centre PERSEE, CS 10207, 1 Rue
       Claude Daunesse, 06904 Sophia Antipolis Cedex, France
       8
         Vattenfall AB, Jupitervej 6, DK-6000 Kolding, Denmark
       9
         WEPROG Aps, Willemoesgade 15B, 5610 Assens

       E-mail: grgi@dtu.dk

       Abstract. This paper presents the new International Energy Agency Wind Task 36 on
       Forecasting, and invites to collaborate within the group. Wind power forecasts have been used
       operatively for over 20 years. Despite this fact, there are still several possibilities to improve
       the forecasts, both from the weather prediction side and from the usage of the forecasts. The
       new International Energy Agency (IEA) Task on Forecasting for Wind Energy tries to organise
       international collaboration, among national meteorological centres with an interest and/or large
       projects on wind forecast improvements (NOAA, DWD, MetOffice, met.no, DMI, …),
       operational forecaster and forecast users.

       The Task is divided in three work packages: Firstly, a collaboration on the improvement of the
       scientific basis for the wind predictions themselves. This includes numerical weather
       prediction model physics, but also widely distributed information on accessible datasets.
       Secondly, we will be aiming at an international pre-standard (an IEA Recommended Practice)
       on benchmarking and comparing wind power forecasts, including probabilistic forecasts. This
       WP will also organise benchmarks, in cooperation with the IEA Task WakeBench. Thirdly, we
       will be engaging end users aiming at dissemination of the best practice in the usage of wind
       power predictions. As first results, an overview of current issues for research in short-term
       forecasting of wind power is presented.
1. Introduction
Wind power forecasting has more than 20 years of operational use [1,2], and has seen continuous
improvements during those years [e.g. 3]. The main use of the forecasts is in the operation of the
power system, often embodied in the general rules for participation in the power matkets. Generally,
for a day-ahead forecast, the output (typically wind speed and direction, in some cases also
temperature, atmospheric stability or other measures) of Numerical Weather Prediction (NWP) models
is used as input in auto-regressive statistical or other machine learning models, which convert the
meteorological data to power, consistent with the relationship between the two in the past. This can be
done for a single wind farm or an entire region. For an overview of the process, see e.g. [4] or [5]. In
the last decade, the use of probabilistic forecasts has prevailed in science and from the operational
forecasters [6].
A wide group of wind power forecast stakeholders from academia, met services, commercial
forecasters and forecast users from a dozen countries has now come together to collaborate on further
improvements to the forecasts, from operational issues to details of the NWP models. The
collaboration is organized in a Task under the International Energy Agency (IEA) Wind Energy
Technology Network, as IEA Wind Task 36 Forecasting for Wind Power.
The Task began with a kick-off meeting at DTU Wind Energy in Risø, Denmark, in January 2016.
Three activities are undertaken: coordination of improvements in the NWPs building the base of all
modern forecasting systems beyond a few hours. Improved and standardised benchmark procedures,
and the delivery of benchmarks is the second activity, and lastly the optimal use of all the information
contained in the forecasts is collected and disseminated.
The first activity to include the wider public is a workshop in Barcelona on June 9 on “Experiences
in using Wind Power Predictions and Gaps in Forecasting Research”. For the findings, see chapter 6.
The slides from the workshop as well as a video stream of the full seminar are on the Task home page
www.ieawindforecasting.dk.
2. Improvements in NWP models
This WP brings together global leaders in NWP models as applied to the wind industry to exchange
information and recommendations regarding most promising areas to improve both the physics of
these models and data assimilation methods, and the influence of various data types, such as data from
drones, masts, lidars and turbines in data-sparse areas, e.g. offshore for wind energy forecasting. The
emphasis will be on improvements of the wind-related forecast performance of these models
especially in typical rotor heights of 50-200m. There, the effects of changing stability, complex
terrain, the influence of the surface and phenomena such as low-level jets still are only poorly
modeled. Forecasting time horizons of 0-3 hours, 3-12 hours, day ahead, 2 weeks ahead, and seasonal
are the relevant time scales for the power system, and will be the focus of separate investigations.
Task 1.1: Compile list of available data sets, especially from tall towers. Currently, 14 towers are
on the list, including contact data to get access to the data.
Task 1.2: Creation of annual reports documenting and announcing field measurement programs and
availability of data.
Task 1.3: Verify and Validate (V&V) the improvements through a common data set to test model
results upon and discuss at IEA Task meetings. The V&V framework is originally from Sandia
National Laboratory, and has been adapted to the case of wind farm flow models [7]. This task will
collaborate with IEA Wind Task 31 Wakebench [8], which also will implement the benchmarking
framework used in WP2.
Task 1.4: Organization of regular meetings and special sessions at international conferences on
wind energy, e.g. a special session at the Annual Meeting of the American Meteorological Society, 22-
26 January 2017 in Seattle [9].3. Wind Power Forecasting Benchmarks
This second work package will review the state-of-the-art for error and uncertainty quantification for
wind and wind power forecasting models, with a special emphasis on the underlying NWP forecasts.
This activity will further engage both NWP and field measurement researchers to develop guidelines,
best practices, and perhaps standards, for evaluating forecast uncertainties. For model evaluation, we
would work together with Task 31 in their Model Evaluation Protocol (MEP) implemented in the
WindBench platform [10]. This would include trying to use some of their collected datasets while also
opening a call for additional datasets for benchmarking.
Task 2.1: Design of benchmark exercises: best practice. The background for this exercise is the
anecdotal evidence from many of the commercial partners, who have had bad experiences with
customer benchmarks. In some cases, the benchmarks were not set up in a way as to find the best
forecasts, for example using misguided self-made error measures or too short trial periods. Even in the
best case, there remains an element of chance, as shown in the original ANEMOS benchmarks [10].
Back then, 11 different models were used with the same NWP data for 6 sites for a year, and while
there was a clear trend separating the better from the worse models, the selection of any four sites
would have led to different rankings of forecast quality. Therefore, this sub-task will write an IEA
Recommended Practice on Wind Power Forecast Evaluation, which will take both deterministic and
probabilistic forecasts into account.
Task 2.2: Standard evaluation protocol for both deterministic and probabilistic forecasts: review of
existing, best practice, and critical assessment of new proposals. While there are some measures which
over time became a standard, both in the literature and in the market place (Root Mean Square Error
normalized with the installed capacity probably being the most universal one), since the suggestions
from the ANEMOS consortium for deterministic [11] and the ANEMOS.plus consortium for
probabilistic [12] forecasts, some additional criteria have emerged.
Task 2.3: Uncovering uncertainty origins and development through the whole modelling chain.
Parallels with the Windbench platform. In this sub-task, a full uncertainty analysis from end to end of
the forecast will be undertaken, including the propagation of uncertainty.
Task 2.4: Set-up and dissemination of benchmark test cases and data sets. Science lives from the
possibility to experiment, but in a world where data is secret, it is hard for new teams with new ideas
to test their ideas against established benchmarks. Therefore we will find wind power data from our
partners together with fitting NWP data and distribute those along the lines of the quite successful
Global Energy Forecasting Competitions 2012 and 2014 [13].
4. Advanced Usage of Forecasts
The third WP will survey the current state of use of forecast uncertainties by the power systems sector,
which will be documented in a report. It will then engage both actors of the wind industry and the
research communities to identify how current and emerging capabilities to determine uncertainties can
be used to address the variety of decision-support needs of the industry. Where useful, simple
indicators of forecast quality will be developed. This WP will also provide outreach to users of
forecasts via webinars or other means to enhance their knowledge and ability to use all available
information for operations.
Task 3.1: State of the art of use of forecasts uncertainties in the business practices
(operation/management, planning of power systems, markets operation/participation) of actors in the
power systems sector (TSOs, DSOs, ESCOs, traders etc). This task has started work already, and is
currently distributing a questionnaire 1 trying to map the current use of forecasting systems. This sub-
task has already begun, please find more information in Chapter 5.
Task 3.2: State of the art and knowledge sharing from demonstration/pilot projects that deal with
the use of forecasts in decision making. The latest frontier for renewable energy forecasts are in
1
https://www.dropbox.com/l/sh/2enjMxIGWsOvVvcGxBNjRoSmartGrid / SmartCity projects. Here the forecasts only play as one component in a much bigger game, and the innovative content often is rather in the use of the forecasts. Task 3.3: In several projects, e.g. for projection of the power system evolution by 2030/2050 with high shares of renewables, it is necessary to generate multi annual time series that simulate wind power forecast errors with hourly resolution. State of the art, benchmarking, recommended methodology. Task 3.4: Review of existing/proposal of best practices on how to measure/quantify the value from the use of probabilistic forecasts. The value of a forecast is often not directly related to the pure error measure. An on average good forecast can have an outlier at a time which is unfortunate in relation to the cost function of the user, while a generally worse forecast might do better in times of crisis. Task 3.5: Communication of wind and wind power forecasts to end-users. Review, recommendations/best practice. There is a perceived disconnect between the latest probabilistic methods in statistics and the actual use of the forecasts at the end users. Sometimes, the way the control room is set up, the easiest to deal with is the deterministic forecast, and therefore the users request the “best” forecast, ‘unencumbered’ by uncertainty bands or other ancillary carriers of information which do not have a decision making process associated with it. The sub-task will map the current practice and distil a recommendation from it. Task 3.6: Set up data sets for benchmarking on the value from the use of forecasts, i.e., for trading. Similarly to the benchmarks of sub-task 2.4, the benchmarks in this task will also have to contain pricing or similar information in order to distinguish a forecast with low economic impact from one with high impact. 5. Mapping of the State of the Art regarding Use The purpose of this sub-task is to get an overview of the current situation regarding use and application of probabilistic forecasts in the power industry in order to estimate and deal with uncertainties. A set of experts with expertise in probabilistic forecasting are collecting information from the industry in order to identify areas, where progress is needed and where it is difficult to achieve further progress. By combining this information with their expert knowledge, white papers and practical recommendations for the industry will be formulated and published. Uncertainty in wind power forecasting and other renewable energies are an aspect that grows with increasing penetration of these sources into our energy mix. Once a certain level is reached, not knowing when we can trust in forecasts or not, is becoming expensive in terms of reserve requirements, but also can become dangerous in terms of grid stability. The flexibility requirements in both the grid handling and the remaining generation capacity are also increasing and require tools and mechanisms that can predict to a large extend and assist in decision making. It is only if we can prepare and are warned about a given situation that we can act rational and efficient. Therefore, we need to understand these new needs in order to serve the industry and to guide research towards development of the tools that will be needed in the future. Phase 1: Collection of Information The first part of this task is to collect information about the state-of-the-art in using and applying forecasting tools in general and tools to deal with uncertainty of wind power production and other Renewables. For this purpose we have compiled a set of interview questions for different branches in the power industry. We set 2 main objectives with the questionnaire: (1) to focus on information not on person/organisation and (2) to get a broad overview over all participants dealing with forecasting. To fulfil the first objective, we decided to treat all answers anonymously and only collect categorised information, if available. The questions were divided into two main categories:
1. General character questions had the purpose to:
 → identify the type of business
 → identify the size of the organisation
 → identify the span of the business processes
 → identify the barriers

2. Forecasting and uncertainty questions had the purpose to:
 → identify the level of forecasting products that are used today
 → identify the knowledge and awareness of probabilistic products
 → identify the challenges that hinder implementation of new products

For that purpose, and because we wanted to get a brought overview of the industry, the interviews
needed to be adjusted, dependent on which party was to answer. Therefore, we categorised the
interview questions to 5 categories:
- System operator (SO): These are transmission system operator, regional transmission organisation,
independent system operator, distribution system operator, market management company etc.
- Trader (TR): organisation that trades energy from wind parks
- R&D: research and development companies and organisations
- Energy Service Organisations (ESO): distribution network operators, service organisations
- Power Producer or Power Management company (PP_PM): wind farm owners or operators

The interview questions were additionally translated to other languages, such that local interviews
could be carried out. Currently the questionnaires are available in Danish, English, German and some
in French.

The interviews and a short instruction on how to submit can be downloaded from a Dropbox1
throughout the project phase, because we want to keep this a “work-in-progress” type of research.
Instructions for the submission of the documents to the team has been put inside the document.
With the “work in progress” strategy, it is our hope that we get a world wide participation in this phase
as well as we get information from other studies incorporated into our findings and results in order to
find the challenges and gaps that may prevent progress, where it's needed and to generate a platform,
where information regarding probabilistic forecasting in the power industry is collected and
communicated.

Phase 2: Analysis of Results
As soon as we have a critical number of interviews collected, we begin our analysis of the answers.
Through this process, we may also refine some of the questions and re-launch interview questions.
Most important in this process is that we get an understanding of the different views and practices
around the world and the different challenges that are observed and experienced.
Round 1 Results:
The first results indicate that forecast uncertainty is a well-known topic among all players that were
interviewed. However, there is almost none of the 24 answers in the first round that use forecast
uncertainty actively in their business practice. This means that there is large untapped potential for
improvement of the value of forecasting for the business processes of the users.
Interviews Task 3.1
3 5 R&D
PP_PMC
ESO
7 3
SO
ETC
6
Figur 1: Distribution of answer according to user types.
Figur 1 shows the distribution of organisations that participated in the first round. There were no
traders that participated in the first round.
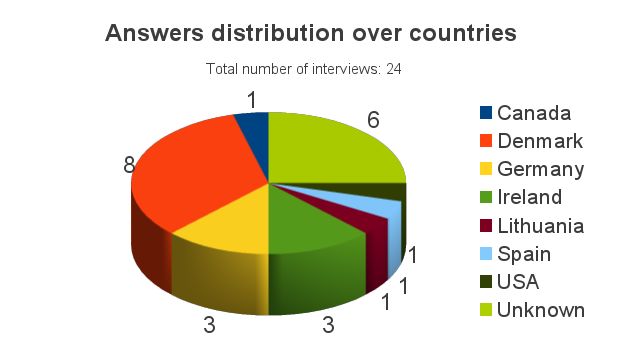
Figure 2 shows the distribution over countries of those questionnaires that were not handlet in
confidentially, or personal interviews were carried out. The “unknown” part are those interviews that
were submitted annonymously.
Figur 2: Country distribution of questionnaire answers.
Additionally to Figure and Figure, our first round analysis is based on 46% of the participating
organisations that are in the power trading, 12.5% in the managing of power, 6% balancing of power
and only 4% specifying O&M as their main business area.
Although the first round results are not at all representative, an interesting pattern can be seen. 88% of
the organisations that answered were dealing with day-ahead forecasting, but only 58% were also
active in the intra-day and 29% in the reserve market. In a study carried out in 2010 by DOE [14] it
was mentioned that the intra-day and intra-hour requirements for forecasting will increase in the near
future and reach the same level as the day-ahead. Our first round evaluation seems to suggest that this
has not yet happened. This is also reflected in the business hours, where only 50% of the participating
organisations mentioned that they were running a 24/7 operation and only 4% an extended business
plan of 7-22h.On the other hand, it was quite interesting to see that solar power forecasting has almost reached the same level as wind power forecasting with 71% against 75%, respectively of the participating organisations applying these forecast types in their business. Weather forecasts are only used by 14% of the participating organisations, which indicates that situational awareness and weather related uncertainty has not yet come far into the operational rooms, or alternatively, it is free weather forecasts that are supplied by the national met centers that are used and hence not mentioned as service. A rather interesting result is the fact that none of the TSOs that participated so far employ meteorologists, neither in their trading teams nor in their analysis teams, although it is widely recognised that weather uncertainty has an impact on their business. Regarding the use of uncertainty information or in general probabilistic forecast information, it was confirmed that 71% know the existence of probabilistic forecasting, specifically ensemble forecasting, but only 21% are using any type of probabilistic forecast information in any way in their operations. On the question, whether the lack of implementation of probabilistic forecasting in the operations has to do with a lack of staff in general, a lack of educated staff in the topic or a lack of staff for implementation of IT solutions, none of these were considered the reason for the lack of application of probabilistic information in the operations. On the other hand the statement “Fear that speculative planning may result in a loss” was agreed upon by 54% of the participating organisations. This could provide a hint to that the lack of use of probabilistic information is in fact a misunderstanding by many for what and how probabilistic information can and should be used, especially in the trading of power. Moehrlen et al, [2012] presented a 1-year study on intra-day trading carried out on the German market, where it was proved that there is a certain amount of uncertainty associated with forecasts, even in the intra-day, and that trading within this uncertainty is not only economically to the disadvantage for the traders, but also from a system security perspective counter productive. This is so, because the sign of the forecast error changes frequently and causes unneccessary trading of the same energy, if within a uncertainty band of the forecast. It has been shown there, that probabilistic information can help identify which part of the forecast has a certainty to be useful for balancing power in the intra-day market. The first results and discussion during some of the personal interviews revealed that this is still an unknown aspect of applicability and that the described fear for speculative behaviour by using probabilistic information in fact seems to show that the knowledge about applicability is still limited. This first round evaluation is going to be used to get back to some of the participating organisations in order to get a deeper understanding of the issues at hand, while still collecting more information around the world from organisations that use forecasting of wind power in their business operation. 6. Future Research issues There is still a large list of issues which the met services, commercial forecasters and researchers can work on for years to come. Those were discussed at a recent workshop in Barcelona in June 2016, organized by the IEA Wind Task [15]. Seen from the perspective of the IEA Wind Task, one could classify the list into “low hanging fruit”, “follow the development initiated by others”, and “research need for us”. The easiest to harvest “low hanging fruit” is the increase in temporal resolution in the output. While at the current time, most institutes give out hourly data, some are still only handing out 3-hourly data. For even higher temporal resolution (half an hour, or even every 10 minutes), the concern of the met institutes is that higher resolution output significantly increases the storage requirements, and input/output from the supercomputer to the disk systems is already a limiting factor in the timing of the runs. The other concern was that it has not been sufficiently proven that at such high resolutions, there is an improvement of the forecast. It could very well be that writing out the results every 10 minutes admittedly increased the variability of the result, but for the horizons beyond a few hours, the
information contained in the meteorological model is presumably just a model generated variability,
and not a physical data-driven accuracy.
Likewise, to get model results more frequently was also high on the wish list of the end users, but
that would require additional model runs. Most meteorological institutes already offer a new result
every 6 or 3 hours, and for some applications it is doubtful whether there is enough new data available
in between runs to make a new forecast run worthwhile. For some applications, a Rapid Update
Cycle model running hourly or every other hour would be appreciated. But the resources involved in
running both a new data assimilation cycle and a new meteorological model run make this possibility
only available to the met services.

In the second category there are several developments which have to be tackled by the meteorological
community, but where wind power forecasting piggybacks on their advances. This is especially
meteorology below 1 km horizontal resolution, which some institutes (and private companies like
Vestas 2) are embarking on to improve the skill for forecasts. But even more than the case of the higher
temporal resolution, the double penalty problem (imagine a peak being forecasted at the wrong time:
this would lead to a relatively large error where the predicted peak is, and then again where the
measured peak is) makes the traditional forecasting error scores like Root Mean Square Error worse.
Very small scales are predictive only for very short times. With strong orographic forcing more details
of the flow will be modeled. However, in uniform terrain as e.g. offshore, detailed structures of flow
cannot be deterministically predicted. In those cases, the high-resolution scores would remain the
same as the scores for a more traditional approach.

An even more difficult task is to run Data Assimilation [16]. The data assimilation models required
nowadays are computationally even more expensive than the Numerical Weather Prediction (NWP)
models themselves. Data assimilation systems are also so complex, that even among meteorologists,
the people able to do data assimilation are specialists. For the purposes of wind power forecasting,
there is regularly the possibility voiced to use wind power measurements (especially the power data
from offshore wind farms) to improve the models where they do not yet have a significant
observational network, i.e. offshore and in 100m above the ground. There are projects underway to use
new data sources including data from wind farms. However, it is difficult to improve on a system
which already uses 10 million data sources. On top, it has been identified that there are not standards
and no quality control of such data yet, as well as there are concern regarding unplanned reductions or
shutdown of turbines without communication practices in place. The value of a single observation will
therefore be quite limited, and data not adhering to the highest quality standards can even be counter-
productive.
In addition to medium range ensemble forecasts there are short term ensembles as e.g. the COSMO-
DE-EPS of Deutscher Wetterdienst, the regional MOGREP of the UK MetOffice, the CMC of the US
NCEP or WEPROG's Multi-Scheme Ensemble Prediction System (MSEPS). Still, the spread of the
forecasts from most of these approaches is too small and the ensembles mostly need calibration to
fully represent the natural variability. The multi-scheme approach is so far the only approach that
generates realistic spread on every time horizon.
A number of issues which came up could be subsumed under “improved NWP model physics”.
Amongst those, improved calculation of stability and its daily pattern, low level jets as a relatively
localized nightly phenomenon, and an improved nowcast for difficult situations, thunderstorms, small
low pressure systems and other issues received explicit mentions. As especially offshore wind farms
are increasing in size and numbers, they are becoming large enough to have a sizeable effect on the
local weather, and should therefore be included in the weather models. Some research on this has been
underway for a while, but a full inclusion of the effect in the weather models of operational centres has
not yet materialized.
2
    http://www.wemcouncil.org/wp/wp-content/uploads/2015/07/1550_MarkZagar.pdf
Icing is a multidisciplinary issue with impacts or use for forecasting, but as it is handled in IEA Wind Task 19 already, we will not take it up separately. Finally, we will tackle aspects of the following issues, mostly along the lines of benchmarking or recommendations. As wind farms are getting very large, and as wind farm wakes can stretch quite a long way, the calculation of the interaction between wind farms will need to be taken up better. While in some cases this is already explicitly or implicitly modelled in e.g. a 2D wind farm power curve (using wind speed and direction as input parameters), the quality of the local direction forecast is getting a higher importance. Our Task will help with finding the proper evaluation criterion, and possibly build a test case for direction forecasting. Another way to improve the forecasts could be spatio-temporal forecasting, i.e. taking upstream live information into account for a given wind farm or region. While some work has been done already, not much of it is actually implemented in operational models, and it has been verified only for high- wind regions where the driving wind comes from the sea (Denmark and Portugal), while more research should be done both on the methods and the applicability elsewhere. We will build a test case for the development of models. Many users are concerned about ramps, even though they often do not have a standardized way of dealing with the ramp forecast. While some work has been done both in the scientific and in the commercial arena, the interaction between end users and forecasters on how to make a ramp forecast useful and how to interpret it is still needed. We will work on a test case, and on the definition of ramps, including a mapping of the current best practice. A similar case, but without the user pull, is seasonal forecasting. Here, the possibility currently is investigated by various institutes and companies, but the business model for application is still quite sketchy. Nonetheless, use cases like O&M scheduling or the connection between wind and hydro power are important considerations. The same goes for the optimal use of probabilistic forecasts. The preliminary 24 answers of the questionnaire to map the current state of forecast use show almost none actively using the forecast uncertainty in their daily operation. So the interaction between academia / industry and end users should be put on a new footing. At the same time, for some particular problems (often related to the security of the electrical grid), some extreme quantiles are needed, which can only be tuned by events occurring every few years or less. How to do a reliable quantile estimation for the rare outliers is a question for research. 7. Call for Collaboration The operating agent of the task is Gregor Giebel of DTU Wind Energy (Denmark), co-operating agent is Joel Cline of the US Department of Energy. Collaboration in the task is solicited from everyone interested in the forecasting business. We will collaborate with IEA Wind Task 31 Wakebench, which developed the Windbench benchmarking platform, used in Task 36 for forecasting benchmarks, and with the task on Solar Forecasting under the IEA PV Annex. The task will run for three years, starting in 2016. Participation is open for all institutions in member states of the IEA Annex on Wind Power.
8. References
1
  Landberg, L., and S.J. Watson: Short-term Prediction of Local Wind Conditions. Boundary-Layer Meteorology
70, p. 171 (1994)
2
   Nielsen, T.S., H. Madsen, and J. Tøfting: Experiences with Statistical Methods for Wind Power Prediction.
Proceedings of the European Wind Energy Conference, Nice, France, 1-5 March 1999, pp. 1066-1069,
ISBN 1 902916 00 X
3
  Lange, B., K. Rohrig, B. Ernst, F. Schlögl, Ü. Cali, R. Jursa, and J. Moradi: Wind power prediction in Germany
– Recent advances and future challenges. European Wind Energy Conference and Exhibition, Athens (GR),
27.2.-2.3. 2006
4
   Giebel, G., R. Brownsword, G. Kariniotakis, M. Denhard, and C. Draxl: The State of the Art in Short-term
Prediction of Wind Power: A Literature Overview, 2nd Edition. 110 pages, Roskilde, Denmark, 2011
5
   Monteiro, C., R. Bessa, V. Miranda, A. Botterud, J. Wang, and G. Conzelmann: Wind Power Forecasting:
State-of-the-Art 2009. Argonne National Laboratory ANL/DIS-10-1, November 2009 (see also
http://www.dis.anl.gov/projects/windpowerforecasting.html)
6
   J.M. Morales, A.J. Conejo, H. Madsen, P. Pinson, M. Zugno, 2013: Integrating Renewables in Electricity
Markets. International Series in Operations Research & Management Science, Springer US.
7
  Sanz Rodrigo J., and P. Moriarty: Model Evaluation Protocol for Wind Farm Flow Models. Deliverable of
IEA-Task 31 Wakebench, October 2014
8
  http://ieawind.org/task_31.html
9
  https://annual.ametsoc.org/2017/
10
    Kariniotakis, G., I. Martí, D. Casas, P. Pinson, T. S. Nielsen, H. Madsen, G. Giebel, J. Usaola, I. Sanchez,
A.M. Palomares, R. Brownsword, U. Focken, M. Lange, J. Tambke, P. Louka, G. Kallos, C. Lac, G. Descombes,
G. Sideratos: What performance can be expected by short-term wind power prediction models depending on site
characteristics? Paper for the European Wind Energy Conference and Exhibition, London (UK), 22-25
November 2004
11
     Madsen, H., P. Pinson, G. Kariniotakis, H.Aa. Nielsen, T.S. Nielsen: Standardizing the Performance
Evaluation of Short-term Wind Power Prediction Models. Wind Engineering 29(6), pp. 475-489, 2005
12
    Pierre Pinson, Henrik Aa. Nielsen, Jan K. Møller, Henrik Madsen, George N. Kariniotakis: Non-parametric
probabilistic forecasts of wind power: required properties and evaluation, Wind Energy 10(6), pp. 497-516,
2007
13
   http://www.drhongtao.com/gefcom/
14
    Jones, L.W.: Strategies and Decision Support Systems for Integrating Variable Energy Resources in Control
Centers for Reliable Grid Operations, Global Best Practices, Examples of Excellence and Lessons Learned,
study for the U.S. Government Department of Energy under Award Number DE-EE0001375, 2012
15
   http://www.ieawindforecasting.dk/News/Nyhed?id=6270327C-6ADD-4128-AC04-823BF6031C01
16
   Draxl, C: On the Predictability of Hub Height Winds. PhD thesis 104 p. (Risø-PhD; No. 84(EN))., DTU Wind
Energy, Risø, Denmark.
You can also read