PRESENCE Worked Examples and Exercises in
←
→
Page content transcription
If your browser does not render page correctly, please read the page content below
Worked Examples and Exercises in
         PRESENCE

  These notes are to be used in conjunction with the workshop notes.

                                  1
Contents
Introduction ........................................................................................................................... 3
The First Step – starting a new project and getting your data into PRESENCE ...................... 3
Next Step: Getting Some Estimates. ...................................................................................... 8
Stepping it up: using the custom models .............................................................................. 15
Exercise 1............................................................................................................................ 22
Fitting models with covariates ............................................................................................. 22
Exercise 2............................................................................................................................ 29
Predicting Occupancy at Other Units ................................................................................... 30
Sample Size Investigations .................................................................................................. 31
Multi-season models – a first example ................................................................................. 33
Exercise 3............................................................................................................................ 37

                                                                    2
Introduction
PRESENCE is software that has been primarily developed fit occupancy models to
detection/nondetection data. The basic sampling situation envisioned for all of these models
is that within a landscape appropriately define sampling units are surveyed for a species to
establish its presence/absence, but due to imperfect detection each ‘survey’ consists of
multiple surveys of the sampling unit. The detection/nondetection of the species in each of
the multiple surveys is recorded providing the necessary information to separate out false and
true absences.

It has been purposely designed to resemble Program MARK to lessen the learning curve for
users familiar with this popular mark-recapture software. A user can fit multiple models to
their data set and PRESENCE stores the results for each model and presents a summary of
how well the models rank according to a model selection metric (AIC is used as the default).
Models are fit using maximum likelihood techniques, hence parameter estimates are known
as maximum likelihood estimates.

PRESENCE consists of 2 main windows; 1) a typical Windows graphical user interface
(GUI); and 2) a CMD window (reminiscent of a DOS-window if your can remember back
that far) that performs the number crunching. The entire analysis can be conducted using the
GUI window, with the CMD window displaying progress on the model fitting procedure.
This is useful as the CMD window indicates the current iteration number for the
maximization routines (so it should be increasing, possibly slowly, if PRESENCE hasn’t
hung) and will sometimes contain hints for ‘when things go wrong’.

The analysis results are stored as a project. Each project consists of 2 files, a data file: *.pao;
and a results file: *.pa2. The data file is a tab-delimited text file with a specified format.
These can be easily created external to PRESENCE, and then imported when a new project is
begun, or inputted directly into PRESENCE using a spreadsheet-like interface. The results
file contains the results for all models that have been fit to the data, and is given the same
base filename as the data file.

The First Step – starting a new project and getting your data into
PRESENCE
Here we’re going to start a new project using one of the sample data sets that is installed
along with PRESENCE. The data set is for the blue-ridge two-lined salamander (Eurycea
wilderae) that was sampled at 39 transects, with 5 surveys per transect. For further details see
page 99 of MacKenzie et al. (2006). We imagine that in most cases people will have their
data stored in a format similar to this example, or would be able to get it into this format
relatively easily. As a last resort, the data can be entered manually if need be.

Once you have started PRESENCE, in the menu bar, select File>New Project.

                                                 3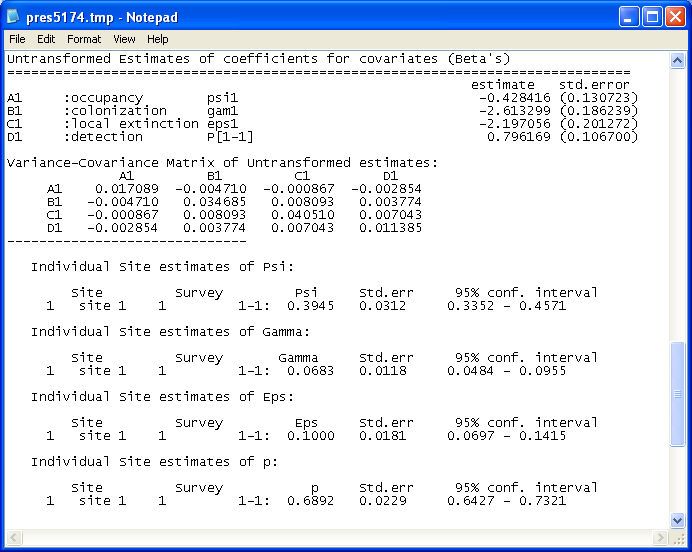
This will bring up a dialog window entitled “Enter Specifications for PRESENCE Analysis”,
and you should select the large “Input Data Form” button in the bottom left corner.

                                                                          Select this button to open the
                                                                           Data Input Form window.

This, in turn, will open a data input interface window that allows you to copy and paste your
data into PRESENCE from a spreadsheet package. The Data Input Form has a spreadsheet-
like format. The detection/nondetection data or covariate values are entered into the
respective grid cells, with the five text boxes near the top of the window being used to define

                                               4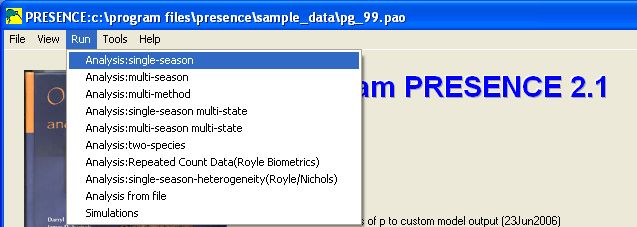
the various dimensions of the spreadsheet; the number of rows (sampling units; A), number
of cols (repeated surveys; B), number of survey occasion per season (C), number of site-
specific covariates (D) and number of sampling or survey-specific covariates (E). For this
example there are no covariates, so we’ll leave the last 2 boxes as ‘0’, and PRESENCE will
automatically adjust the number of rows and columns when we paste in the data. When
running a single-season model (as in this example), PRESENCE will ignore the value in box
C, however it’s good practice to enter the number of columns associated with each seasons
data in a comma delimited list. If you don’t understand that at present, all will become clearer
later.

   A      B                  C              D               E

Now we want to open the data file in our spreadsheet program, and paste the data into
PRESENCE. In the PRESENCE installation folder (e.g., c:\program files\PRESENCE\) there
will be a folder called sample_data, within which is the data file for this example
Blue_Ridge_pg99.csv.

                                                5
From within your spreadsheet package, or by exploring My Computer, open this file. The
data should appear as a series of 1’s and 0’s arranged in 39 rows (1 for each transect) and 5
columns (1 for each survey). It is presumed that your data is in a form where each row
represents a site or sampling unit, and in each column is the result of the repeated
detection/nondetection surveys for each unit. Select the entire data range (i.e., from cell A1-
E39) and copy to the clipboard, then return to the Input Data Form (note you may need to
locate the window in your task bar) and select Edit>Paste>Paste Values from the Edit menu.
The detection/nondetection data should now appear in the grid cells, with the number of rows
and number of columns being automatically updated to 39 and 5 respectively. It’s
recommended that you manually enter that the number of occasions per season is 5. Once
you’ve done this, the top portion of your Data Input Form should look like this:
6Finally, before proceeding you need to save your data to a suitable location with an
appropriate name in the usual manner by selecting File>Save As. When you do so, a message
box wiil appear asking whether you want to use the last column of the detection data as
frequency data (time of time which history was observed). Seelct No. The extension for a
PRESENCE data file is .pao which will automatically be added to the filename.
Once saved, you can close the Data Input Form and return to the Enter Specifications
window. Hit the “Click to select file” button, browse for and then select the data file you’ve
just saved (I called it pg_99.pao). After you have selected the detection data file, the full
filename and pathway will appear in the middle text box and the project filename will be
shown in the third text box. The naming convention for the project file is to use the same base
filename as the data file, but to change the extension to .pa2. This is important as if you want
to reanalyse the same data set, but retain the results of a previous analysis, you first want to
create a copy of the data file otherwise PRESENCE will attempt to overwrite the previous
project file (although you will be prompted as to whether you want to overwrite the project
first). The project title in the first text box is simply for your own reference and can be
anything. The default is that the data filename is used for the project title. On the Enter
Specifications window, once you’ve selected the data file, summary information is presented
on the number of sites, number of surveys, etc. In a previous version you modified these
values here rather than on the Data Input Form, but this information has been retained here to
provide a double check that you’ve selected the right file. You also have the option of
viewing the raw .pao file, which is just a tab delimited file with a specific layout.
7Project title
Detection data filename
Project filename
Summary information about
data set that has been read in
by PRESENCE
Select this button once you are
ready to create your project and
begin the analysis.
In order to create the project file and proceed with the analysis, you must hit ‘OK’. After
doing so, the Enter Specifications window should close and be replaced with the Results
Browser window. If the Results Browser window does not appear, you have not created
the project file and must repeat the above steps.
Congratulations! Your data has been inputted, project file created and now you’re ready to
begin your analysis.
Next Step: Getting Some Estimates.
Here we are going to fit some single-season models to the blue-ridge salamander data that we
have just set up the project for above. If you happened to have closed PRESENCE after
creating the project file you can reopen the project by selecting File>Open Project from the
8main PRESENCE window. Note that recent projects are also listed down the bottom of the
File menu.
To run a single-season analysis, in the main PRESENCE window select
Run>Analysis:single-season. This will bring up the Setup Numerical Estimation Run
(SNER) window. This same window is used for all analyses, only the Model box varies
between the different types of analyses. The other parts of the SNER window include the
analysis title (which should be carried over from the title given when the project was created),
model name, the ability to fix real parameter values, and various options that we shall ignore
for now.
Model Box
Options: ignore
for now
9Within the model box, there are 2 options, Pre-defined or Custom. By default the pre-defined
option is selected which provides a list of 6 pre-defined models that users can select to learn
how to use PRESENCE, but generally will be of limited use for a full-blown data analysis
(see the Help documentation for a definition of these models). In this example, we are going
to fit the first 2 pre-defined models to the data, then fit the same 2 models using the Custom
model and compare the outputs. The first model is estimating the same occupancy probability
for all transects, and that detection probability (p) is constant across both transects and survey
occasions (i.e., only 2 parameters will be estimated). The second model again assumes that all
transects have the same probability of occupancy, but that p can vary between the five
surveys although at each survey occasion, p is the same at all transects (i.e., 6 parameters will
be estimated). So making sure the first pre-defined model is highlighted, hit the ‘OK to Run’
button (you may need to enter a title if this text box is blank). After a few micro-seconds, a
message box should appear with some summary information about the results, asking you to
confirm that you want these results added to the project file. Generally you would select
‘Yes’, as you should now.
When you do so, then the model name appears in the Results Browser, along with some other
information that is largely uninteresting at this point as we have only fit 1 model to the data.
To view the results for this model, first left-click on the model name to select it, then right-
click to open a pop-up menu (as indicated above), and then select View model output. The
following output should appear in your default text editor (e.g., Notepad). The output begins
with the model name, followed by some summary information about the data file and internal
coding used by PRESENCE to define which model is being fit to the data. Following that
there is some more summary information about the data file; number of groups assumed by
predefined model (again, see Help for details), number of sites (transects in this case), etc.
Following this we get into the more interesting part of the output. Reported is the number of
parameters used to fit the model, twice the negative log-likelihood value evaluated at the
maximum likelihood estimates (which is used to calculate AIC values or could be used in
likelihood ratio tests), the AIC value for the model and the naïve estimate. The naïve
estimate is the proportion of sites that were surveyed where the species was detected at least
10once, which one would use as the estimate of the occupancy probability (psi) without
correcting for detection probability.
Model name
Summary
information
More summary
information about the data
Estimate SE
Below the naïve estimate are the estimated parameter values from the model. Psi (ψ) is the
probability of occupancy with the standard error (SE) given in parentheses, theta (θ) is the
probability of group membership which is 1.0 in this case because we selected the predefined
model with only 1 group. Next on the output are the estimated detection probabilities. In this
11predefined model, detection probability was constant for all 5 surveys, so only a single
estimate is presented that is the same for all 5 survey occasions. Finally is the variance-
covariance matrix which can be used in association with the delta method to obtain standard
errors for transformations of parameters. At this point simply note that the values on the main
diagonal (top left to bottom right) are the variances for the estimated parameters; if you take
the square-root of these values you obtain the reported standard errors.
The next step is to fit the second predefined model “1 group, Survey-specific p” using the
same procedure as before, but selecting the second model in the pre-defined list and hitting
‘OK to Run’. After confirming this second model, your results browser should now look like
this.
With 2 models now having been fit in our project, the results browser is more interesting so
let’s work through it. The results browser provides us with a summary of all the models that
have been fit to the data in the project. PRESENCE ranks the models in terms of Akaike’s
Information Criterion (AIC). We are not going to go into details of what AIC is here (see
Burnham and Anderson, 2002; or Google it), but will say it is a method for ranking models in
order of parsimony. There are 7 columns in the results browser, each presenting a piece of
summary information about the model, and how it ranks compared to others in the set. Model
is obviously the name that was specified for each model; AIC is the AIC value for each
model; deltaAIC is the relative difference in AIC values between each model and the
currently top-ranked model (the one with smallest AIC); AIC wgt is the AIC weight which is
a measure of support for each model being the ‘best’ model; Model Likelihood is the ratio of
each models AIC weight over the model weight for the top-ranked model; no. Par is the
number of parameters in the model; and -2*LogLike is twice the negative log-likelihood
evaluated at the maximum likelihood estimates (MLEs).
Examining the results, a difference of only 1.95 AIC units between these 2 models indicates
that even though it is not ‘the best’, the second model still has a reasonable level of support
and there is further evidence of this with the second model having a substantial amount of
AIC weight. Thus, while most of the evidence point towards the probability of detection
being constant, the evidence is not overwhelming and there is some indication that the
probability of detection varies between surveys. Alternatively, one could use these results to
perform a likelihood ratio test of the null hypothesis of detection probability being constant,
and the alternative hypothesis being that detection probability varies between surveys. The
test statistic for this is 161.76 - 155.71 = 6.05, which we would compare to the chi-square
distribution with 6 – 2 = 4 degrees of freedom, resulting in a p-value of 0.195 so there is
insufficient evidence to reject the null hypothesis.
12Opening the output for the second model, note that the same layout has been used as for the
first model. The only major difference is towards the bottom of the output where rather than
just the one estimate of detection probability being reported, there are now 5. Note there is a
large degree of variation in the estimated values of p, and that the likely reason this model
does not have grater support is the small sample sizes.
13Finally, note that for both models, the estimated occupancy probability is very similar; 0.595
and 0.581 from the first and second models respectively. Hence, even though there is no clear
indication of which model is the ‘best’, when interest is on estimating the probability of
14occupancy, both models give essentially the same results, and both are 26% larger than the
naïve estimate suggestion that the blue-ridge salamander was never detected at 1 in every 4
occupied transects.
Stepping it up: using the custom models
Continuing with this example, we shall now fit the same models as above, but using the
custom model option. Once again we can begin a single-season analysis from the run menu,
or alternatively we can repeat the previous type of analysis by clicking on the button with the
green triangle towards the top of the results browser (this will be greyed out if no previous
analysis has been conducted in this session).
Selecting this button
repeats the previous
type of analysis.
Selecting the Custom radio button in the Model box in the SNER brings up the Design Matrix
window. The design matrix is used to specify what factors you want to include in the model
for each parameter type. Unlike Program MARK, in PRESENCE, the design matrix for each
parameter type is given a separate sheet, and in the single-season model there are 2 parameter
types: Occupancy and Detection probabilities.
View the design matrix for
the different parameter
Beta parameters are types by selecting each tab.
included as columns
in the design matrix.
In the grid cells, values
are entered that define the
Real parameters are regression equation used
included on the rows for each real parameter.
of the design matrix.
Each row of the design matrix represents a real parameter, e.g., occupancy and detection
probabilities. The columns represent the beta parameters: these are the parameters that are
actually estimated by the algorithm that is attempting to maximise the likelihood and are the
coefficients in the regression equation that is created when values are inputted to the grid
cells in the design matrix. It should be remembered that there is a 3rd dimension to the design
15matrix that drills back into the computer screen, namely the sampling units. Therefore, if a
numeric value is entered into the design matrix, that value is applied to all sampling units. If a
covariate name is entered into a grid cell, the value of that covariate for each sampling unit is
used in the regression equation. We’ll see examples of this later. The way one reads a design
matrix is to move along each row and sum the terms that result from multiplying the value in
the cell by the corresponding beta parameter. For example, the above design matrix defines
the following logistic regression equation for the occupancy probability:
logit ( ψ i ) = 1× a1
= a1
That is, the probability that a sampling unit (transects in this example) is occupied is the same
for all sampling units, the logit of which will be estimated as a1. For the remainder of this
example we are going to leave the design matrix for occupancy unchanged.
Next, select the tab labelled ‘Detection’ and note there are now 5 rows in the design matrix,
each one corresponding to the probability of detection in each of the 5 surveys (in general
there will be one row in the detection design matrix for each survey). For this design matrix
there are 5 corresponding logistic regression equations:
logit ( pi1 ) = 1× b1 = b1
logit ( pi 2 ) = 1× b1 = b1
logit ( pi 3 ) = 1× b1 = b1
logit ( pi 4 ) = 1× b1 = b1
logit ( pi 5 ) = 1× b1 = b1
So in effect, this design matrix represents a model where detection probability is the same for
all 5 surveys, the logit of which equals an amount b1. Therefore, this model is equivalent to
the first predefined model: there is a single occupancy probability for all transects, and
detection probability is constant both in time and across transects. To run this model, return
to the SNER window (you may need to navigate through your task bar to locate the correct
window) and hit ‘OK to Run’. After confirming the results, the Results Browser should now
look similar to:
16Note that the results summary for the custom model we have just fit (denoted as psi(.),p(.)) is
identical to the first predefined model, as it should be. However, opening the output for this
custom model we’ll see there are some differences. At the top of the output we again see the
model name followed by some summary information. Below the summary information the
design matrix for each parameter type is given.
Model name
Summary
information
Design matrix for occurrence probability
Design matrix for detection probability.
17Following the design matrices there is some more summary information, as in the predefined
model. The table titled ‘Untransformed Estimates of coefficients for covariates (Beta’s)’
presents the estimated beta parameters, with the label for each beta parameter in the leftmost
column corresponding to those used in the design matrices. So here a1 is estimated to be
0.383 with a standard error of 0.509, and b1 is estimated to be -1.053 with standard error
0.301.
Summary
information
Beta parameter Beta parameter
labels estimates and SE’s
Real parameter
estimates
Derived parameter
estimates
After the table is the variance-covariance matrix for the beta parameters, then the estimated
occupancy and detection probabilities are presented. These values are calculated using the
design matrices and the logit link. So recall that for occupancy the design matrix provides the
equation (where the ‘hats’ indicate we now have estimated quantities):
18logit ( ψˆ i ) = aˆ1 = 0.383
e0.383
ˆi =
ψ
1 + e0.383
= 0.595
ˆ i is obtained using the delta method, which for this model is
The standard error for ψ
relatively simple because the transformed quantity of interest ( ψˆ i ) is only a function of 1 beta
parameter.
2
Var ( ψˆ i ) = ( ψˆ i (1 − ψˆ i ) ) Var ( aˆ1 )
2
= ( 0.595 × 0.405 ) × 0.259
= 0.015
SE ( ψˆ i ) = Var ( ψ
ˆi)
= 0.123
A similar procedure is used to calculate the detection probability and its standard error. You
should take a few minutes to compare the results to the first model we fit and note the same
estimates are obtained. The final piece of the output on the custom model is a derived
parameter: a quantity that is not directly in the model structure, but can be calculated from
parameters that are. For the single-season model the derived parameter is the probability that
a unit is occupied given that the species is never detected there. So in this example, if the
species was not detected in any of the 5 surveys of a transect, what is the probability of blue-
ridge salamanders being present there (see MacKenzie et al. 2006 for details).
To fit the equivalent of the 1 group, Survey-specific P model, again select to run a custom,
single-season model. Leave the design matrix for occupancy as the default option (as in the
last model), and set the design matrix for detection probability to be as indicated below.
A shortcut to creating this design matrix is to select the menu item Init>Full Identity. This
creates the identity matrix which has as many columns as rows, with 1’s on the main diagonal
and 0’s elsewhere. From this matrix we can write the following sets of equations.
19logit ( pi1 ) = 1 × b1 + 0 × b2 + 0 × b3 + 0 × b4 + 0 × b5 = b1
logit ( pi 2 ) = 0 × b1 + 1 × b2 + 0 × b3 + 0 × b4 + 0 × b5 = b2
logit ( pi 3 ) = 0 × b1 + 0 × b2 + 1 × b3 + 0 × b4 + 0 × b5 = b3
logit ( pi 4 ) = 0 × b1 + 0 × b2 + 0 × b3 + 1 × b4 + 0 × b5 = b4
logit ( pi 5 ) = 0 × b1 + 0 × b2 + 0 × b3 + 0 × b4 + 1 × b5 = b5
Note that the coefficients associated with each beta parameter in each equation correspond
with the entries in the design matrix, and result in a model where the probability of detecting
the salamanders in each of the 5 surveys will be estimated by a different beta parameter.
Going back to the SNER window, before running the model we need to change the name of
the model. So far we have simply used the default names for each model, but here we should
enter something meaningful. Now model names are completely arbitrary and the main point
to consider is that the model name is meaningful to you. However, we suggest that you
follow a convention that is becoming widely used where each parameter type is listed, and in
parentheses the factors that affect that parameter are listed.
Model name
Here, there are no factors influencing occupancy probability (it is the same for all transects)
which is denoted as ‘psi(.)’, and detection probability is different for each survey hence
‘p(Survey)’. After renaming the model, hit ‘Ok to Run’, and after confirming the results, your
results browser should now look like as below where the summary information for the model
psi(.), p(Survey) is the same as the predefined model, 1 group, Survey-specific P.
20Opening the output for this model we again see the initial summary information followed by
the design matrices. Note the more complex design matrix for detection probability. Below
the portion of the output starting from the table of beta parameter estimates is presented.
Given the design matrix, the estimated beta parameters b1-b5 represent the absolute
probability of detecting salamanders at an occupied transect in each survey (on the logit-
scale). The real parameter estimates are calculated in much the same way as for the previous
custom model, based upon the defined design matrices and estimated beta parameters.
Comparing these real parameter estimates to those obtained from the corresponding
predefined model you will note they are very slightly different, which is due to the -2LogLike
values actually being different in the decimal place, but the difference is effectively
negligible.
21Following the real estimates for p, a brief histogram of these estimates is given as a visual
summary of the result, with the last piece of the output being the derived parameter for the
probability of occupancy given salamanders were never detected at a transect.
Exercise 1
For the following three design matrices for detection probability; 1) write out the set of
equations for detection probabilities; 2) fit the model; 3) describe what the model means in
terms of variation in detection probability; and 4) interpret the result. In all cases maintain
occupancy to be constant for all sites, i.e., a psi(.) model.
Hint: to add a column to the design matrix, right click the mouse button when over any cell to
open a pop-up menu and select the appropriate option.
Fitting models with covariates
In this example we shall fit models that involve covariates for both occupancy and detection
probabilities to data that has been collected on the Mahoenui giant weta in a scientific reserve
by the Department of Conservation in the King Country district of New Zealand. 72 3m-
radius circular plots were surveyed between 3-5 times for weta. Each plot was assessed as to
the level of browsing by feral goats and each survey was conducted by 1 of 3 observers. See
MacKenzie et al. (2006) for more details. The data is included in the sample data folder that
is installed along with PRESENCE in the Excel spreadsheet Weta_pg116.xls. This file
consists of 5 sheets containing the detection-nondetection data (detection_histories), whether
a plot was browsed or unbrowsed (site_covar), and which observer conducted which survey
22(Obs1, Obs2 and Obs3). In this example the number of surveys is not constant for all plots
hence the detection-nondetection data includes missing observations that are indicated with a
“-“. Each of the covariates are dummy variables that =1 if the covariate is of the value
indicated by the covariate name, and =0 otherwise. Note that continuous valued covariates
are also possible.
Photo credit: Mahoenui giant weta, Amanda Smale, Department of Conservation.
Begin PRESENCE, start a new project and open the data input form. Copy and paste the
detection-nondetection data from the spreadsheet into PRESENCE in the same manner as for
the previous example, changing the number of surveys per season to 5. Next we have 2 site-
specific covariates (whether a site was browsed or unbrowsed by the goats) and 3 sampling
occasion, or survey-specific, covariates we want included in our data file. Therefore, change
the number of site-specific covariates to 2 and the number of sampling covariates to 3. Note
that when you do so additional tabs appear for sheets on which you enter your data. As the
site-specific covariates must remain constant for the entire season, each one only requires 1
column hence all site-specific covariates are entered on a single sheet. The sampling occasion
covariates can vary with each survey hence the covariate will have the same dimensions as
the detection-nondetection data, hence 1 sheet is required by each sampling covariate.
23Number of site-
specific covariates.
Note the additional
tabs that appear. Number of sampling
occasion covariates.
To input the site-specific covariates, in your spreadsheet programme select the sheet labelled
site_covar, highlight the range of the covariate data including the covariate names (i.e., cells
A1:B73), copy the selected cells, return to PRESENCE’s data input form and select the tab
labelled Site Covar. Click on the top-left grid cell and make sure the cell border becomes a
dotted line (not a flashing cursor), then from the edit menu, select Edit>Past>Paste
w/covnames. This paste option will not only paste the covariate values into the grid cells, but
will also paste in the covariate names.
Select this tab to enter
site-specific covariates.
Note the dotted outline
which indicates which
cell/column is active.
The enter the sampling (or survey-specific) covariate that indicates whether observer 1
conducted the survey, return to your spreadsheet software and select the tab labelled Obs1,
select and copy the values (cells A1:E72), return to the data input form and select the tab
labelled SampCov1. Make the top-left cell active and paste the values by selecting
Edit>Paste>Paste values. Next rename the covariate by selecting Edit>Rename covariate
and in the text box insert Obs1 and hit ‘OK’. Repeat these steps for the covariates Obs2 and
Obs3.
24Note that the observer covariates contain missing values, and that these exactly correspond
with the missing values in the detection-nondetection data. Covariate values are allowed to be
missing, but only if the detection-nondetection data for the corresponding survey of the
sampling unit is also missing. The assumption is required by most statistical methods.
Missing values for site-specific covariates are not allowed.
Once you have entered all 3 observer covariates, save the data file using an appropriate name
(here I have used ‘weta_116’) then close the data input form which will return you to the
Enter Specifications for PRESENCE Analysis window. Select the data file you have just
created, add a title for the project then select ‘OK’. After a couple of seconds a blank results
browser should appear. Remember, if you do not see the results browser, you have not
successfully set up your project file.
Here we are going to follow the example on page 116 of MacKenzie et al. (2006), with
details initially being provided for how to include covariates in a few simple models and
fitting the remainder of the candidate model set being left as an exercise.
First, let’s fit a simple model where the probability of occupancy is the same for all plots and
the probability of detection is the same in all surveys. In our earlier notation we could call
this model psi(.),p(.). This is the same as the first custom model that we fit in the salamander
example, so recall the design matrix for occupancy was just a ‘1’ in the single grid cell, and
for detection probability we have five rows (for the 5 possible survey occasions) and require
a single column of ‘1’s. This is actually the default model that appears where you select to
run a custom, single-season model, hence after the design matrix appears you just need to hit
‘Ok to Run’ then confirm the results to add them to the results browser.
Next we shall fit a model where the probability of occupancy will vary between plots
according to the level of browsing, and detection probability will be allowed to vary among
days. We could call this model psi(Browsed),p(Day). We shall first fit the model, then work
back through it explaining what we’re actually doing. So start the analysis by selecting
Run>Analysis:single-season and clicking on the Custom radio button if it is not already
selected. This will bring up the design matrices window and set the design matrix for
occupancy to look like the following.
This will require you to add a column to the design matrix, then enter the respective covariate
name. To add a column, you simply right-click anywhere on the design matrix which opens a
25pop-up menu and select Add Col (the 5th item in the menu) which will create an empty
column on the right-hand side of the design matrix. You can then either type the name of the
covariate into the grid cell, but if you do so you must get the name 100% correct and
PRESENCE is case sensitive. Alternatively, if you open the Init menu you will notice that all
of the available covariates are listed there, prefixed with a ‘*’. After activating column 2 (so
the grid cell in the second column has the dotted outline), select Init>*Browsed and the
covariate name Browsed will be inserted into the correct column.
To define a model where detection probability varies among days, after selecting the
detection tab, select Init>Full identity which will give:
Once the design matrices are setup up, return to the SNER window (without closing the
design matrix window), rename the model then hit ‘OK to Run’ and confirm the results when
prompted.
So what have we just done? Lets start with the simple one; the design matrix for detection
probability. Recall that we have already used this design matrix in the blue-ridge salamander
example, and that to read the design matrices we move along the row, we sum the terms
produced by multiplying the values in the grid cell with the corresponding beta parameters
for each column. So here we could write the set of equations:
logit ( pi1 ) = 1 × b1 + 0 × b2 + 0 × b3 + 0 × b4 + 0 × b5 = b1
logit ( pi 2 ) = 0 × b1 + 1 × b2 + 0 × b3 + 0 × b4 + 0 × b5 = b2
logit ( pi 3 ) = 0 × b1 + 0 × b2 + 1 × b3 + 0 × b4 + 0 × b5 = b3
logit ( pi 4 ) = 0 × b1 + 0 × b2 + 0 × b3 + 1 × b4 + 0 × b5 = b4
logit ( pi 5 ) = 0 × b1 + 0 × b2 + 0 × b3 + 0 × b4 + 1 × b5 = b5
Or we could represent it graphically as:
263
b1
2 b4
1 b2
logit(p)
0
0 1 2 3 4 5 6
-1 b5
-2 b3
-3
Day
So there are no constraints on how detection probability might vary among days; each day is
free to have a unique value that is different to the others, and the logit of these values is b1-b5.
That is, this design matrix represents the model that allows detection probability to be day
specific, with all plots having the same probability on each day.
Next, lets consider the design matrix for the occupancy probability, which is a representation
of the following equation.
logit ( ψ i ) = 1 × a1 + Browsed i × a2
= a1 + a2 × Browsedi
Recall that Browsed is a covariate that we defined such that if plot i showed signs of
browsing = 1, and = 0 otherwise. Therefore, for an unbrowsed plot (where Browsedi = 0),
logit ( ψ i ) = a1 + a2 × 0
= a1
and for a browsed plot (where Browsedi = 1),
logit ( ψ i ) = a1 + a2 ×1
= a1 + a2
Note that a2 is therefore the difference in occupancy between a browsed and unbrowsed plot
(on the logit scale), or alternatively what effect browsing has on occupancy compared to plots
with no browsing. Graphically, we could represent this as:
273
2.5
2
logit(psi)
a2
1.5
a1
1
0.5
0
Unbrowsed Browsed
Looking at the output from this model, â2 = 1.24 which, as it is >0, indicates that the
probability of occupancy is higher at browsed plots. In this fairly simple model we can
interpret â2 in a fairly straightforward manner, although for more complicated models it can
be useful to interpret the effect of a covariate in terms of an odds ratio. Using the logit link
the odds ratio can be calculated as:
OR = e aˆ2
= e1.24
= 3.44
The interpretation of this would be that the odds of occupancy at a browsed site is 3.44 times
larger for a browsed plot than an unbrowsed plot. An approximate 2-sided 95% confidence
interval for the odds ratio would be:
= ( exp (1.24 − 2 × 0.787 ) , exp (1.24 + 2 × 0.787 ) )
= ( e −0.27 , e 2.74 )
= ( 0.76,15.49 )
28Exercise 2
1. Working in small groups, fit the model with the following design matrices. Write out
the corresponding equations, draw the graphs and interpret the resulting beta
parameter estimates. Fit the same model but with a different parameterization for both
design matrices.
2. Within your groups fit the following set of models to the weta data, and discuss the
results.
i. psi(.)p(.) v. psi(Browsed)p(.)
ii. psi(.)p(Day) vi. psi(Browsed)p(Day)
iii. psi(.)p(Obs) vii. psi(Browsed)p(Obs)
iv. psi(.)p(Day + Obs) viii. psi(Browsed)p(Day+Obs).
3. Calculate the summed AIC weights for the Browsed covariate for occupancy, and the
Observer covariate for detection (hint: if you right mouse click on the Results
Browser you can copy the table to the clipboard, and then paste into a spreadsheet).
4. Calculate the model averaged estimate (and SE) of the probability of occupancy for a
browsed plot.
29Predicting Occupancy at Other Units
Once a model has been fit to the data, the resulting regression equation of species occurrence
can be used to predict the probability of occupancy at other units based upon the values of the
covariates that are in the equation that have been measured at the other units. You might be
interested in doing so to build maps of species occurrence for example. For large problems it
is likely to be most efficient to set the procedure up within software such as R or SAS, or
write specific code to do so. However for smaller problems it is possible to trick PRESENCE
into doing this prediction for you.
The secret is to add the required number of rows to the bottom of the detection data, with all
surveys indicated as missing. By doing so, this will have no effect on the estimation of the
parameter values. The site-specific covariate values for these ‘phantom’ units can be entered
as normal, and the survey-specific covariates could also be entered is missing values. Hence,
when the model is fit within PRESENCE, a value for the predicted occupancy probability
will be outputted for these other units alongside the estimates for the units that were actually
surveyed.
30Sample Size Investigations
PRESENCE can be used to perform analytic-numeric investigations of sample size
requirements. There is a ‘hidden’ option in PRESENCE that allows a summarised version of
the data to be entered, with 1 row for each unique detection history and covariate
combination, rather than a single row for each sampling unit. If our ‘data’ consists of all
possible detection histories given the number surveys, and we calculate the expected number
of units with each history, we can use PRESENCE to get asymptotic (large-sample) results
for different sampling designs. This example is to demonstrate how you might go about this
firstly for the situation where you only have a single group of units, and secondly where you
have 2 groups of units and the intent to accurately estimate the difference in the probability of
occupancy for the 2 groups.
One Group
Open the spreadsheet Sample Sizes.xls which can be found in the Exercises folder of the
workshop materials, and select the sheet titled One Group. Follow the instructions on the
worksheet to calculate the expected number of histories; specifying that psi = 0.63, p = 0.4
and s = 40. Select and copy the cells A7:E22 (i.e., the detection histories and expected
number of units with each history). Start a new project in PRESENCE, open the data input
window and paste in the data. Set the number of sites to 16, leave the number of survey
occasion as 5, but enter the number of surveys per season as 4. When you save the file, when
prompted if the last column is the frequency, select Yes. Save the file with an appropriate
name, then close the data input window. Select the file you’ve just created (you will get a
warning that you can ignore), then hit the ‘Click to view file’ button to open the pao file in
your default text editor. The image below should appear on screen.
The pao (data) file is simply a tab-delimited text file with a specified format. The main points
of interest are indicated below, although this data file is a little bit different in that we’ve
included an extra column for the expected number units with each history. If there were
covariates in the data file, these would be inserted immediately after the integer indicating the
number of covariates of each type. First the covariate name would be listed, then the
covariate values, then the name of the next covariate and so on. Once you are familiar with
the data file format, you can always create your own data files rather than using
PRESENCE’s data input interface. When you do so, you only need to include the information
up to the line immediately before the project title; PRESENCE will append all of the
information from the title line onwards when the project is created.
Complete the process to create the new project.
31Number of detection histories and
total number of survey occasions.
Detection-nondetection data.
Number of units with each
history. If not included then
a 1 is assumed.
Number of site-specific and survey-
specific covariates respectively.
Number of surveys per season.
Project title line.
Sampling unit names.
Survey occasion labels.
Checksum value.
Fit a psi(.)p(.) custom, single-season model and open the output. Note that the estimates of
psi and p correspond exactly to the values used to generate the expected values, hence the
method is unbiased. The reported standard errors indicate its expected value given a study
with 40 units and 4 surveys. Clearly we’ve assumed perfect data here and in practice we can
only have an integer number of units with each detection history. There may be other small-
sample issues that may create some problems and simulation is a handy tool for assessing
that.
Repeat the process with 80 and 200 sampling units and note the difference in the standard
errors.
Two Groups
In the spreadsheet select the worksheet labelled Two Groups. Note that life has been made
easier here for you with the probabilities and expected value calculations already inputted;
you just need to input psi, p and s values for both groups. Specify your own values for psi and
32p for each group, but make sure the difference in psi is 0.2 and use p values in the range of
0.3-0.6. Initially, specify 30 units for each group. Once you have done this, the probabilities
and expected values should be automatically calculated. Copy and paste the detection
histories and expected values into a new project in PRESENCE as for the one group example.
There are also 2 site-specific covariates to be included this time indicating each group. Copy
and paste this into PRESENCE also. If you copy the covariate names, be sure to paste w/cov
names. Finish creating the project, then fit the model psi(Group)p(Group) twice, using the 2
different design matrices for occupancy indicated below.
Open the output from these 2 models and describe the difference in the interpretation of the
beta coefficient a2 in each of them. What do these results indicate about your ability to
precisely estimate a difference of 0.2 in the probability of occupancy with only 30 units per
group?
Repeat this process again, but this time increase the total sample size to 120 with the
following combinations of units in group 1 and group 2 respectively; 1) 40 and 80; 2) 60 and
60; and 3) 80 and 40. Comment on the results.
Multi-season models – a first example
In this example we are going to create a project with detection-nondetection data from
multiple seasons (years) for the grand skink dataset referred to in the notes, then fit a range of
models to investigate how important, and what effect, having a modified matrix between
rocky outcrops (tors) has on each of the 4 parameters of interest.
Open the file Grand Skinks.xls, located in the Data folder of the coursework material. Data
has been collected on 352 tors over a 5 year (the ‘seasons’) period, although not all tors were
surveyed each year, with up to 3 surveys of each tor per year. The detection-nondetection
data is in the correct format to be imported into PRESENCE. Not that the first surveys of all
tors each year are in the same column, so the 15 columns are in 5 blocks of 3. There is also a
site-specific covariate Pasture indicating whether the surrounding matrix is either
predominately the modified habitat (farm pasture, Pasture =1) or “native” grassland (tussock,
Pasture = 0).
Begin a new project in PRESENCE, copy and paste the detection data and Pasture covariate.
As this is mutli-season data, before saving the file, we need to tell PRESENCE how surveys
occasions are in each of the 5 seasons. This is accomplished by simply listing the numbers
(separated by a comma) in the text box labelled No. Occ/season. So here you would enter
3,3,3,3,3. Save the data, then complete setting up the project as for the single-season models.
33Specify number of surveys per
season here. Note the change in
the column labelling.
Once the Results Browser appears, select Run>Analysis: multi-season, which should bring
up the following window. Note that it is a similar format to the single-season analysis, but
with a different selection of models in the model box. Initially we are will just use the first
parameterization and use the other parameterizations in later examples. Note that there are no
predefined models, and that all models have to be fit using the design matrix. Looking at the
design matrix, previously we only have 2 named tabs in the design matrix window, and note
that now we have 4, one for each of our parameter types. There is still only 1 real parameter
(row) for occupancy as under this parameterisation we are only estimating the probability of
occupancy in the first season. There are 4 real parameters for colonization; there are 5
seasons of data so 4 between-season opportunities for the species to colonize a location.
Similarly, there are 4 real parameters for extinction probabilities. Finally there are 15 real
parameters for detection, 1 for each survey occasion.
Different parameterizations
available for the multi-
season model.
34The first model we are going to fit is psi(.),gamma(.),eps(.),p(.), i.e., each of our parameters
are constant across time and space. This is actually the default model when you open the
analysis window so here we just have to rename the model, then press ‘Ok to Run’. Confirm
the model then open the output. Note that the first part of the output is very similar to the
single-season output, with the main exception being that there are now 2 additional design
matrices, one for colonization (gamma) and one for extinction (eps) probabilities. Focusing
on the estimation part of the output, first there are the beta parameters that are reported on the
logit-scale, and their variance-covariance matrix. This is followed by the real parameter
estimates. From this model we would therefore could that; 1) the probability of occupancy in
the first year was 0.39; 2) between all seasons, the probability that skinks colonize a
previously unoccupied rocky outcrop is 0.07; 3) between all seasons, the probability that
skinks go locally extinct from an occupied rocky outcrop is 0.10; and 4) given an outcrop is
occupied by skinks, the probability of detecting skinks in a single survey is 0.69.
Below the real parameter estimates, some derived estimates are reported. These are calculated
using some equations that shall be covered later, but briefly the derived estimates are the
probability of occupancy in years 2-5, and then an occupancy-based population growth rate
that are calculated as the ratio of successive occupancy estimates. From these estimates one
might conclude (based upon this particular model) that the system appears relatively stable,
as the derived probabilities of occupancy are very similar and the lamdas are approximately
1.
Beta parameter
estimates.
Real parameter
estimates.
35Derived parameter
estimates.
Now, fit the model psi(.),gamma(year),eps(year),p(year), that is, we are allowing
colonization, extinction and detection probabilities to be different in each year. The design
matrices for colonization and extinction can be defined by selecting Init>Full Identity in the
design matrix window (there are also other parameterisations possible that will give the same
model). For detection probability, we are assuming that detection probability varies among
years, but within years the probability of detection is constant. A shortcut to defining this
type of model for detection is available in the Init menu with the Seasonal effects option (this
option is unavailable for the other design matrices).
36Looking at the results, the estimated probability of; 1) occupancy in the first year is 0.38; 2)
colonization is 0.12, 0.01, 0.07 and 0.10 for each of the between year periods respectively; 3)
extinction is 0.07, 0.07, 0.14 and 0.17 for each of the between year periods respectively; and
4) detecting the skinks in a single survey is 0.70, 0.65, 0.69, 0.84 and 0.66 in each of the 5
years respectively.
The next step in this example is to consider how much evidence is there for the importance of
the Pasture covariate as a predictor for the occupancy-related parameters. We’re going to fit
a range of models representing different hypotheses about how we believe pasture might
influence occupancy and its vital rates. Our model set is generated by considering the
different combinations of these hypotheses.
Parameter Hypothesis
Occupancy - Is the same for all outcrops
- Is different for outcrops surrounded by pasture
Colonization - Varies in time, does not depend upon intervening matrix
- Varies in time, intervening matrix has an effect that is consistent each year
Extinction - Varies in time, does not depend upon intervening matrix
- Varies in time, intervening matrix has an effect that is consistent each year
Exercise 3
1. Define a candidate set of models based upon these hypotheses. For all models allow
detection probability to vary among years, but be constant within years, and allow
37detection to be different dependent upon the surrounding matrix with the effect being
constant for all years, i.e., a p(year + Pasture) model.
2. Fit these models in PRESENCE.
3. Determine the amount of evidence for each hypothesis.
Multi-season models – another example
This exercise is designed to show how to run program PRESENCE to compute species
presence, detectability, colonization and extinction estimates from 'presence-absence' data.
Start program PRESENCE.
Click 'File/New Project' to start a new analysis. A dialog box will appear asking for a title,
filename, number of sites,etc.
Now, start your spreadsheet program, and load the sample data file named 'NSO_pg209.xls'.
Determine the number of sites, years, and total number of surveys in the file. Select all data
cells (using the mouse), and copy to the clipboard ('Edit'/'Copy').
Next, return to program PRESENCE and enter the number of sites, total number of surveys,
and the number of surveys per year in the appropriate boxes. Then, click 'Data Input Form'
and click in the first cell of the input data form (site 1, 1-1). Go to the 'Edit' menu, and click
'Paste', 'paste values'.
Save the input by clikcing 'File/Save as' and name the file 'NSO_pg209.pao'. Close the Input
Data Form window by clicking the X in the upper right corner or clicking 'File/Close'.
Next, click the 'Click to select file' button on the 'Enter Specifications' window. When the
dialog box appears, select the file just created (NSO_pg209.pao) and click 'Open'. Click in
the 'Title' box and enter 'Multi-season example from page 209 Northern Spotted Owls'. Click
'OK'.
You're now presented with a 'Results Browser' window where a summary of each model will
be saved. To run our first model, click 'Run/Analysis:multi-season' from the menu-bar.
When the 'Setup Numerical Estimation Run' window appears, click the design-matrix
window to bring it to the front. The first model to run will be one where colonization and
extinction are constant over time and detection probabilities are year-specific. With the
default parameterization, there is only an initial occupancy parameter (psi), and colonizatin
(gam) and extinction (eps) are preset to constant over time, so we only need to make
detection year-specific. Click the 'Detection' tab, go to the 'Init' menu, and click 'Seasonal
Effects'. Then, go back to the 'Setup Numerical Estimation Run' window, enter
'psi,gam(.),eps(.),p(yr)' for the model name and click 'OK to Run'.
Next, run a model which is the same as the last one except that colonization (gamma) and
extinction (eps) are year-specific. Click 'Run/Analysis:Multi-season', make sure the first
model parameterization option is selected and click on the design-matrix window. We can
retrieve the design-matrix from the previous model by clicking 'Retrive model' and select the
38previous model from the list. Next, click the 'Colonization' tab, click 'Init/Full Identity' to
make colonization different for each year. Do the same for extinction. Go back to the 'Setup
Numerical Estimation Run' window and enter 'psi,gam(yr),eps(yr),p(yr)' for the model-
name and click 'OK to Run'.
Next, let's run a model where occupancy is constant, colonization is constant, and detection is
year-specific. (Note that we're talking about seasonal occupancy being constant, not the initial
occupancy parameter.) For this, we need to select the 2nd model parameterization option
(Seasonal occupancy, colonization and detection). Click 'Run/Analysis:multi-season' and
select the 2nd model parameterization option. When you do this, the 'extinction' tab will
disappear from the design-matrix window, and rows will be added to the occupancy table to
allow occupancy to (potentially) differ each year. By default, there is only one column in the
occupancy table, so occupancy will be constant over time. If you click the 'Colonization' tab,
you'll see that colonization is constant over time by default. To make colonization year-
specific, click the ‘Init’ menu, then ‘full identity’. Click the Detection tab and click
'Init/Seasonal effects' to make detection year-specific. Go back to the 'Setup Numerical
Estimation Run' window, change the model name to 'psi(.),gam(yr),p(yr)' and click 'OK to
Run'.
Exercise: Fill in the following table after running the other models..
Model Markovian Equalibrium?
or
Random?
1 Psi(.),gam(yr),eps(yr),p(yr)
2 Psi(.),gam(.),eps(.),p(yr)
3 Psi1-5(.),gam(yr),p(yr)
4 Psi(.),gam(yr),eps=1-gam,p(yr)
5 Psi(.),gam(.),eps=1-gam,p(yr)
6 Psi(.),gam=eps=0,p(yr)
Enter ‘markovian’ if the model specifies ‘markovian’ changes in occupancy over time, or
‘random’ if not. Enter ‘yes’ or ‘no’ if occupancy is in ‘equilibrium’. Markovian means that
occupancy in time t depends on occupancy in time t-1, and equilibrium means that occupancy
no longer changes over time, or change in occupancy is constant.
39You can also read