Access to intensive care in 14 European countries: a spatial analysis of intensive care need and capacity in the light of - COVID-19 - Helmholtz ...
←
→
Page content transcription
If your browser does not render page correctly, please read the page content below

Access to intensive care in 14 European
countries: a spatial analysis of intensive
care need and capacity in the light of
COVID-19

Jan Bauer, Dörthe Brüggmann, Doris
Klingelhöfer, Werner Maier, Lars
Schwettmann, Daniel J. Weiss & David
A. Groneberg
Intensive Care Medicine

ISSN 0342-4642

Intensive Care Med
DOI 10.1007/s00134-020-06229-6

                                 1 23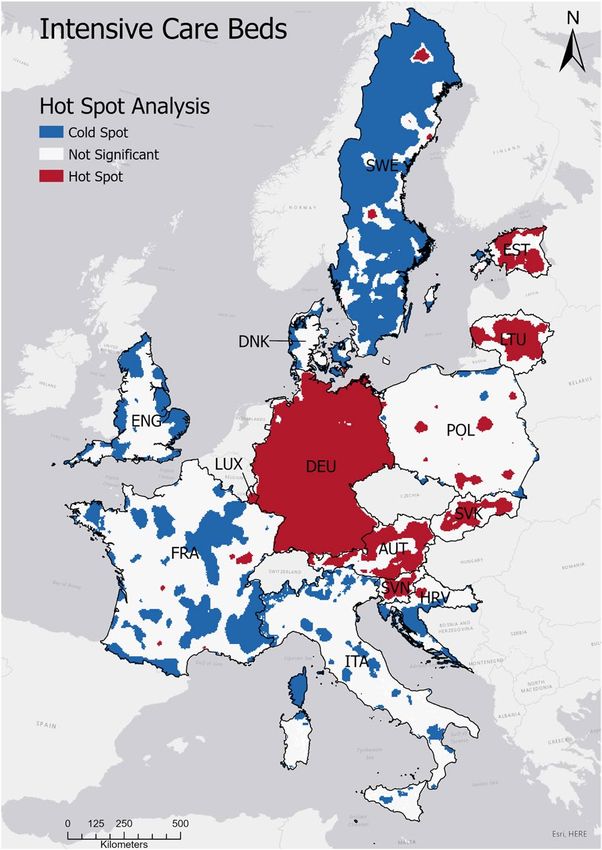
Your article is published under the Creative
Commons Attribution Non-Commercial
license which allows users to read, copy,
distribute and make derivative works for
noncommercial purposes from the material,
as long as the author of the original work is
cited. All commercial rights are exclusively
held by Springer Science + Business Media.
You may self-archive this article on your own
website, an institutional repository or funder’s
repository and make it publicly available
immediately.

1 23
Intensive Care Med
https://doi.org/10.1007/s00134-020-06229-6

 ORIGINAL

Access to intensive care in 14 European
countries: a spatial analysis of intensive care
need and capacity in the light of COVID‑19
Jan Bauer1* , Dörthe Brüggmann1, Doris Klingelhöfer1, Werner Maier2, Lars Schwettmann2,3, Daniel J. Weiss4
and David A. Groneberg1

© 2020 The Author(s)

  Abstract
  Purpose: The coronavirus disease 2019 (COVID-19) poses major challenges to health-care systems worldwide. This
  pandemic demonstrates the importance of timely access to intensive care and, therefore, this study aims to explore
  the accessibility of intensive care beds in 14 European countries and its impact on the COVID-19 case fatality ratio
  (CFR).
  Methods: We examined access to intensive care beds by deriving (1) a regional ratio of intensive care beds to
  100,000 population capita (accessibility index, AI) and (2) the distance to the closest intensive care unit. The cross-
  sectional analysis was performed at a 5-by-5 km spatial resolution and results were summarized nationally for 14
  European countries. The relationship between AI and CFR was analyzed at the regional level.
  Results: We found national-level differences in the levels of access to intensive care beds. The AI was highest in
  Germany (AI = 35.3), followed by Estonia (AI = 33.5) and Austria (AI = 26.4), and lowest in Sweden (AI = 5) and Den-
  mark (AI = 6.4). The average travel distance to the closest hospital was highest in Croatia (25.3 min by car) and lowest
  in Luxembourg (9.1 min). Subnational results illustrate that capacity was associated with population density and
  national-level inventories. The correlation analysis revealed a negative correlation of ICU accessibility and COVID-19
  CFR (r = − 0.57; p < 0.001).
  Conclusion: Geographical access to intensive care beds varies significantly across European countries and low ICU
  accessibility was associated with a higher proportion of COVID-19 deaths to cases (CFR). Important differences in
  access are due to the sizes of national resource inventories and the distribution of health-care facilities relative to the
  human population. Our findings provide a resource for officials planning public health responses beyond the current
  COVID-19 pandemic, such as identifying potential locations suitable for temporary facilities or establishing logistical
  plans for moving severely ill patients to facilities with available beds.
  Keywords: Access, Intensive care, Europe, COVID-19

*Correspondence: j.bauer@med.uni‑frankfurt.de
1
  Division of Health Services Research, Institute of Occupational Medicine,
Social Medicine and Environmental Medicine, Goethe University
Frankfurt, Theodor Stern Kai 7, 60590 Frankfurt, Germany
Full author information is available at the end of the article
Introduction
The coronavirus disease 2019 (COVID-19) poses a major            Take‑home message
global challenge to health-care systems despite the warn-
                                                                 Our results suggest substantial pre-existing subnational- and
ings vocalized following the severe acute respiratory syn-       national-level differences for spatial accessibility to intensive care
drome (SARS) pandemic in 2003 [1, 2]. This pandemic              units. Furthermore, lower accessibility of intensive care is associ-
demonstrates the consequences of situations where the            ated with higher COVID-19 case fatality ratios. In conclusion, some
                                                                 countries (e.g., Germany) are particularly well positioned to manage
need for health care is greater than the health-care capa-       a swiftly increased need for intensive care, whereas others (e.g.,
bility. However, other situations can also confront the          Denmark, Italy or Sweden) have lower numbers of intensive care
health-care system with similar problems such as mass            beds that are also spatially more concentrated, and thus localized
                                                                 shortages are possible during a locally increased need for intensive
casualties after terrorist attacks, as was the case in Paris     care.
in 2015 [3]. With regard to COVID-19, several European
countries have been at the center of the pandemic since
the beginning of 2020 [4], with Italy, Spain, and the UK       are required to adequately manage an increased need of
having among the highest numbers of reported cases and         intensive care. Such regional patterns of spatial acces-
deaths worldwide as of May 2020. Ensuring universal            sibility cannot be reliably derived from simple provider-
access to diagnostics and treatment during such situa-         to-population ratios justifying the necessity of more
tions is crucial [5]. The current pandemic demonstrates        sophisticated measures [10]. This is clearly in line with
the scale of the possible increase of need for intensive       the ‘COVID-19 strategic preparedness and response plan’
care units (ICU) if national case counts are translated        of the WHO (World Health Organization), which states
into health-care demand. The European Centre for Dis-          that one of the first public health measures is to ‘map
ease Prevention and Control (ECDC) estimated that 32%          existing preparedness and response capacity’ [7]. Within
of COVID-19 cases in the European Union (EU) require           this context, this study assessed the spatial accessibility
inpatient care and 2.4% require intensive care as of April     of intensive care beds in Europe. However, in the light of
2020 [6].                                                      the COVID-19 pandemic, a focus is put on the impact on
  The need for health care is met by different health-care     the COVID-19 case fatality ratio (CFR). We start from
systems across Europe. Some countries seem to be well          the hypothesis that accessibility varies between European
placed to implement the necessary actions to cope with         countries and that a low accessibility is related to higher
increased health-care needs, but others are struggling [7].    COVID-19 CFR.
One important aspect affecting the efficacy of national
responses is the capacity to endow the health-care system
with necessary resources in a timely manner. Previous          Materials and methods
research identified substantial differences in the num-        This study included 14 European countries, for which the
ber of ICU beds among European countries, which range          required health-care inventory and location data were
from 4.2 ICU beds per 100,000 people in Portugal to 29.2       available. To assess the accessibility of ICU beds, the need
in Germany (EU mean: 11.5) [8]. The proportion of the          for intensive care as well as the capacity of intensive care
population aged 65 years and over also differs among           must be modeled. Regarding the capacity of intensive
European countries, as this age group accounted for a          care, we collected the following data at hospital level for
low of 14.1% and a high of 22.8% of the national popula-       each country: (1) address of the hospital, (2) number of
tion, respectively, in Ireland and Italy in 2019 (EU mean:     ICU beds, and (3) total number of inpatient beds. Since
20.3%) [9]. It is important to take demographic differ-        the definition of ‘hospital’ was not consistent in the Euro-
ences into account, as the need for health care increases      pean countries, we applied the definition based on the
with patient age due to the increased morbidity among          classification of health-care providers of the System of
the elderly population.                                        Health Accounts (SHA) provided by the WHO. As such,
  To ensure universal access to health-care resources,         hospitals are defined as health-care facilities providing
adequate health-care resources must be available (in           acute (curative) inpatient care beds for internal medicine,
terms of number and capacity of hospitals) and acces-          and excluding hospitals providing solely psychiatric beds,
sible (in terms of travel distance) [5]. Availability and      long-term care beds, or rehabilitative care beds. Further-
accessibility are commonly merged under the term ‘spa-         more, it was not possible to apply a common definition
tial accessibility’ [10], and relevant national and regional   of ICU as the definitions differ slightly in the European
differences in spatial accessibility to health care were       countries. The data were mainly obtained from national
known long before the COVID-19 pandemic [11, 12].              government health departments and cover the most
It is important to assess the heterogeneous patterns of        recent reference periods between 2017 and 2019. For
spatial accessibility to specific health-care resources that
detailed information regarding the definitions and data on NUTS-1 level (‘Nomenclature of Territorial Units for sources for each country, see Online Appendix 1. Statistics’ defined by the European Union) until 28 July Regarding the need for intensive care, we used the 2020 to assess the relationship of accessibility to an ICU adjusted total population counts of the countries to and the mortality of COVID-19 across all included coun- model the need for care as provided by the ‘gridded tries. The relationship was analyzed using spearman’s population of the world’ raster (GPWv4) as of 2020 at Rho (non-parametric data) using the statistical analysis the resolution of approximately 5 km (2.5 arc-min) [13]. software SPSS version 23 (IBM, Armonk, USA). We fur- We excluded all locations with a population of zero. For ther included the positivity rate (proportion of cumula- a sub-analysis, we excluded patients aged 80 years and tive COVID-19 cases to cumulative number of tested over, since this age group has been shown to have poor people until 28 July 2020) as the measure of the countries outcomes from acute admissions to an ICU [14]. This dif- testing strategy, since differing strategies are reported to ferent dataset was based on the GPWv4 as of 2010, since be an important source of bias regarding the CFR [16]. more recent data were not yet available. This sub-analy- sis was performed to model intensive care provision for Results the section of the population with higher outcomes from For 14 countries, necessary data could be retrieved, with ICU care. the other European countries excluded due to either (1) Using the modeled need for intensive care as well as the missing regional data on national level (e.g., in Spain, capacity of intensive care, we calculated two accessibility data are managed locally by autonomous regions) or (2) measures: (1) a regional ratio of hospital beds to 100,000 data protection policies (e.g., Portugal). Among the 14 population capita (accessibility index, AI), and (2) the dis- European countries included, the analysis revealed dis- tance to the closest hospital providing intensive care. The tinct national and regional differences in the provision of AI is a measure of both availability and accessibility of intensive care resources. hospital beds that accounts for population sizes, whereas the distance to the closest hospital is a simple and easier Intensive care on national level to interpret measure of accessibility. We included both On national level, the crude number of ICU beds varied measures to provide a more comprehensive assessment between 28,031 in Germany and 130 in Luxembourg (see of access to intensive care across European countries. Table 1). The average accessibility index as the measure For both measures, we calculated the distance from each of availability and accessibility of ICU beds was highest centroid of the gridded population raster to hospitals in Germany (AI = 35.3), followed by Estonia (AI = 33.5) providing ICU beds. The distance calculation is based on and Austria (AI = 26.4), and lowest in Sweden (AI = 5.0) TomTom Multinet data (TomTom N.V., Amsterdam, The and Denmark (AI = 6.4). These first findings were further Netherlands) as of 2016 using ArcGIS Pro 2.5 (ESRI Inc., analyzed with the average distance to the closest hospital Redlands, USA). The closest hospital approach only con- providing ICU beds. Among all 14 countries, the average siders one hospital (i.e., the closest one), whereas the AI travel distance was 13.1 min by car. Croatia had the high- considers all hospitals within a certain catchment area. est average travel time with 25.3 min, while Luxembourg For the calculation of the regional ratio (AI) we applied (9.1 min) and Germany (9.3 min) had the lowest travel the ‘enhanced two step floating catchment area’ meth- times to the nearest facility with ICU beds. odology (E2SFCA) [15]. This well-established method is Regarding the sub-analysis excluding patients aged based on a gravity model, which considers the declining 80 years and over, the analysis revealed overall higher AI probability to see a health-care provider with increas- with an average absolute increase of 1.4 (SD: 1.6), which ing travel distance. By using this approach, it was possi- was due to the smaller population size compared to the ble to disaggregate the national ratio of hospital beds to total population. In Estonia and Luxembourg, the AI match the 5-by-5 km spatial resolution of the popula- showed the highest absolute increase (+ 4.6), followed tion raster. Population weighting was used when deriv- by Slovenia (+ 2.8). On the other hand, in Croatia, the AI ing the national mean of the AI and the distance to the did not change substantially (+ 0.1) and in Lithuania AI closest hospital. For a detailed description of the E2SFCA decreased (− 1.4). method, see Online Appendix 2. To quantify any regional clustering of the AI, we applied a hot spot analysis (based Intensive care on regional level on the Getis-Ord Gi* statistic) using ArcGIS Pro. This Subnational variations of health-care provision were fur- metric was used to identify areas of significant high or ther analyzed using high-resolution maps of AI (Fig. 1). low AI. In Germany, with one of the highest national AI levels, Finally, we used the crude CFR (proportion of cumu- access to ICU beds was high throughout the country. lative COVID-19 deaths to cumulative COVID-19 cases) Likewise, AI for ICU was high across Luxembourg and
Table 1 Overview intensive care beds
Country Hospitals (n) ICU bedsa (n) ICU beds/total beds Average travel time Average acces‑ Area of signifi‑
at the hospital (%) to closest hospital (min) sibility indexb cant AIc (%)
High Low
Austria 118 2,369 5.9 12.7 26.4 54 1.1
Croatia 25 396 3 25.3 9 2.6 43.4
Denmark 29 382 3.5 15.4 6.4 0.5 36.3
England 194 3999 4.1 12.5 7 0 40.7
Estonia 15 483 9.4 16.9 33.5 47.5 4.6
France 343 5,671 4 16.6 8.2 0.8 31.6
Germany 1161 28,031 5.9 9.3 35.3 95.2 0.3
Italy 428 5184 3.7 12 8.1 0 18
Lithuania 57 644 3.7 16.2 22.7 54 0.3
Luxembourg 9 130 6.3 9.1 21.1 63.6 0
Poland 534 4391 2.7 12.7 11.1 4.4 3.5
Slovakia 52 814 4.4 16.7 14.4 40.5 0.2
Slovenia 15 539 8.6 15.7 24.2 47.2 2.6
Sweden 55 522 3 22 5 1 82.9
All countries (n = 14) 3035 53,555 4.9 13.1 16.6 29.4 18.9
ICU intensive care unit, AI accessibility index
a
Different definitions of ICU were applied (Online Appendix 1)
b
AI was calculated per 100,000 people
c
Area of significant AI was calculated by the hot spot analysis using a 99% confidence interval. ‘High’ represents hot spots, whereas ‘low’ represents cold spots
also, but to a lesser degree, in Estonia, Lithuania, Slove- 5.3) with the lowest CFR in the NUTS1 Region Slovakia
nia, and Austria. (1.2%), followed by Luxemburg (1.8%) and ‘Południowy’
In Italy, England, France, and especially Sweden, the in Poland (2.3%). All the three highest NUTS1 Regions
patterns were more clustered, indicating that spatial were located in England with ‘London’ having the high-
accessibility to ICU beds was high near some population est one (19.4%), followed by ‘West Midlands’ (19.1%). The
centers, but lower across rural areas of these countries. In correlation analysis on NUTS1 level revealed a significant
Sweden, for example, there were vast areas of low spatial negative correlation of ICU accessibility and CFR with
accessibility, especially in the northwest. Looking at clus- r = − 0.57 (p < 0.001). Therefore, in NUTS1 regions with
ters of high accessibility (see Table 1; Fig. 2), the hot spot low ICU accessibility, the CFR was higher.
analysis revealed that 95.2% of all populated locations in For England and France, the positivity rate was not
Germany had high spatial accessibility (confidence inter- available on NUTS-1 level. Therefore, we used the rate
val: 99%) in contrast to Italy (no significant high accessi- on country level for both countries. The positivity rate
bility) or Sweden (1%). varied across the included countries from 0.4% in Lithu-
Regarding the sub-analysis excluding patients aged ania to 15.8% in ‘Östra Sverige’ in Sweden with a mean
80 years and over, the findings of the regional analysis across all included countries of 3.3% (standard deviation:
did not substantially vary substantially from the patterns 3.0). Regarding the relationship of the cumulative positiv-
shown in Figs. 1 or 2. Therefore, the spatial distribution ity rate and the CFR, the analysis revealed no significant
shown in these figures can be transferred to the results of correlation.
the sub-analysis.
Discussion
Accessibility of ICU and case fatality ratio (CFR) We mapped spatial accessibility for intensive care beds
of COVID‑19 in 14 European countries. A heterogeneous geographi-
Except for France, the CFR could be calculated on cal distribution was present both within and between the
NUTS-1 level for all countries included. For France, we analyzed countries. At the national level, Germany and
used the national numbers to calculate the CFR, since Estonia had the highest accessibility indices for inten-
regional data were only available for the inpatient sector. sive care beds. Subnationally, the geographical pattern
The average CFR across all 14 countries was 7.4% (SD: of accessibility indices was more clustered, especiallyFig. 1 Regional analysis of accessibility indices (AI) for intensive care Fig. 2 Hot spot analysis of accessibility indices (AI) for intensive care beds in 14 European countries. The AI was calculated per 100,000 beds in 14 European countries. CI confidence interval, AUT Austria, people. AUT Austria, DEU Germany, DNK Denmark, ENG England, EST DEU Germany, DNK Denmark, ENG England, EST Estonia, FRA France, Estonia, FRA France, HRV Croatia, ITA Italy, LTU Lithuania, LUX Luxem- HRV Croatia, ITA Italy, LTU Lithuania, LUX Luxembourg, POL Poland, SVK bourg, POL Poland, SVK Slovakia, SVN Slovenia, SWE Sweden. Data Slovakia, SVN Slovenia, SWE Sweden. Data source of administrative source of administrative boundaries: ©EuroGeographics boundaries: ©EuroGeographics in Sweden, Italy and France, whereas in Germany and countries included (from 9.1 up to 25.3 min), it may be Luxembourg, high accessibility indices were present questioned whether a difference of about 15 min in travel throughout the country. At the regional level, we further time really makes a difference regarding the outcome of a found that in regions with low ICU accessibility, the CFR disease like COVID-19. However, there are multiple fac- of COVID-19 was higher. tors possibly influencing the CFR besides spatial factors The findings suggest that low accessibility of ICU beds that have not been accounted for in this study (e.g., mor- is associated with a higher proportion of COVID-19-re- bidity of the population or COVID-19 testing strategies) lated deaths to the number of cases (higher CFR). In gen- [22]. For example, at the peak of the first wave, people in eral, a lack of adequate access to health care is known to the UK were specifically told not to come in for a test, be associated with negative health outcomes [17–19], but rather self-isolate if they were ill but not in an at-risk which stem from various spatial and non-spatial dimen- group. Such testing strategies affect the documented case sions of access [20]. In this study, we only included the count, leading to an increased apparent CFR. If differ- spatial dimension of access, which ignored other aspects ent countries followed alternative testing strategies, this that influence health-related outcomes such as the socio- could be a confounding factor, especially since testing economic status or the affordability of health services strategies has been changed over time [16]. The positiv- [21]. To further evaluate the impact of variable accessi- ity rate as reported in our study varied greatly among the bility indices on health outcomes, morbidity data should included countries which further strengthens the differ- be included in future studies as the need for health care ent testing strategies followed in the included countries. is best modeled using the treatable morbidity. Looking at The highest positivity rate was present in ‘Östra Sver- the average travel time to the closest hospital among the ige’ in Sweden (15.8%) which suggests rather restrictive
testing (i.e., only testing high risk patients with high pre-    beds and not the time it takes patients to reach them. In
test probabilities). However, the positivity rate showed no      this regard, it has to be noted that geographically isolated
significant association with the CFR on NUTS-1 level.            locations such as rural parts in Sweden are at higher risk
Therefore, on this aggregated regional level, an influ-          of longer travel times to an ICU, but are probably also at
ence of the testing strategy on the CFR was not present.         lower risk of being exposed to diseases like COVID-19.
This may be due to the geographical level of the analysis        However, for other diseases (such as major trauma and
(NUTS-1 level) and an influence may be present on more           cardiovascular or neurologic diseases), the probability of
detailed analysis levels (i.e., NUTS-2 or NUTS-3). Even          requiring intensive care in such isolated regions due to
though our results did not reveal an association, the test-      a medical emergency may be as high as in more popu-
ing strategy is still likely a relevant source of bias regard-   lated areas. Since the results represent the overall access
ing the potential influence of the accessibility on the CFR      to intensive care regardless of the etiology of the disease,
[16].                                                            the consequences drawn from low accessibility may differ
   The crude CFR also does not account for changes in            depending on the medical focus. However, even though
the demography of positive cases and deaths during the           studies analyzing in-hospital delays from the general
different stages of an epidemic. However, as reported by         ward to intensive care units have shown that ICU trans-
the European Commission, demographic factors alone               fer delays are associated with higher mortality, necessary
cannot explain the high number of fatalities reported            to that end were delays of at least 1 or 2 h [24, 25]. This
for example in Italy [16]. Furthermore, the incidence of         being said, the average difference of 15 min travel time
COVID-19 follows infection clusters and is therefore not         reported in our study may not be relevant for the major-
equally distributed within countries. In the 21 counties         ity of medical emergencies.
of Sweden, for example, the highest incidence as of 18             In general, both AI and travel time measures have
August 2020 was in the county Jönköping with 1336, and           advantages and disadvantages [10, 26]. The major advan-
the lowest in Skåne with 307 cases per 100,000 residents         tage of the travel distance is that it is simple and easy to
[23]. These differing incidences represent a bias regarding      communicate. In contrast, AI is more complex, but pro-
the analysis of the CFR. Also, the AI accounts for availa-       vides more informative results by accounting bypassing
bility of ICU beds and not only the travel distance. This is     the closest provider, population size, resources avail-
especially important since it also accounts for in-hospital      able, and distance decay [10, 27]. Alternative measures
transfers to an ICU where the travel time to the hospital        and thresholds have also been applied when assess-
is not the major issue. Therefore, the AI represents more        ing spatial accessibility, such as in a study in Scotland,
than just the travel distance and the negative correla-          which revealed that 94% of the population could access
tion found with CFR should prompt a critical discussion          an intensive care unit within a 45-min drive time by car
regarding the current intensive care provision in cer-           [28]. The method applied in our study (E2SFCA) has
tain countries. However, due to the numerous potential           limitations despite being a widely used measure of spatial
sources of bias, we are not able to fully explain the differ-    accessibility [26]. The limitations include the user-defined
ing CFR reported in this study, especially since we per-         catchment size and distance decay function. For these
formed a correlation analysis, and therefore, are not able       elements of E2SFCA, we relied on parameters established
to draw conclusions regarding causality. This requires           in previous studies [15, 21].
further research which should include individual level             Looking at the analysis excluding very old patients, the
data on the location and the morbidity of the patients           findings do not alter the conclusions stated above. There-
admitted to the ICU to support the findings. However,            fore, looking at the population with a higher probability
the reported findings may provide additional insights            of a better outcome from an acute ICU admissions (i.e.,
into spatial factors that influence the CFR.                     patients aged 79 years and younger), altering of policy
   In this study, both AI and travel time to the closest         planning based on the reported findings may help to pro-
facility were calculated, and in some case these results         vide better treatments for the population with better out-
led to outcomes that appear contradictory. These differ-         comes [14]. However, the ethics of admission to an ICU
ences emerge because AI incorporates the number of               have to be acknowledged [29]. Therefore, policy plan-
beds relative to the population potentially needing them,        ning based on the probable outcome of intensive care
in addition to travel distance. For example, Italy and Aus-      should be accompanied by a social debate on end-of-life
tria had similar travel time to the nearest facility with        decisions.
intensive care beds (12.0 vs. 12.7 min), but dissimilar AI         The numbers of hospital beds used in this study were
for the same health-care service (AI = 8.1 vs. AI = 26.4).       comparable to the numbers reported in earlier stud-
These results suggest that the key difference between            ies [8, 30]. However, different definitions for hospital or
these countries is the local demand for intensive care           intensive care were used among the European countries,
making direct comparisons challenging. For example, modify them to address health-care demands. While in Estonia intensive care is classified into levels I–III, many European countries have made a tremendous with level I and II being comparable with high depend- effort to increase the number of intensive care beds in ency units or intermediate care units in other countries. response to COVID-19, our results suggest substantial However, due to data restrictions, it was not possible to pre-existing national- and subnational-level differences include only the highest level of intensive care (e.g., level for spatial accessibility to needed services. Accessibil- III units in Estonia) for most European countries. This ity to intensive care beds, in particular, is of concern may explain the exceptionally high spatial accessibility as their availability was more limited at the start of the in Estonia compared to previous studies [8]. In addition, pandemic and rapid expansion in capacity will be chal- the criteria for an ICU transfer may differ in the analyzed lenging. For example, the expansion of hospital capacity countries. For example, in many Scandinavian countries, is simplest when built upon existing infrastructure and a patient may be of an FiO2 (fraction of inspired oxygen) workforces, but such health-care system assets varied of up to 60% on a general ward before being transferred greatly among European countries. Therefore, besides to an ICU to get mechanical ventilation, whereas in Ger- the number of ICU beds, the major issues regard- many the criteria for an ICU transfer are often less strict, ing intensive care provision are the adequately trained which may be due to the high availability of ICU beds in workforce and the number of mechanical ventilators. Germany as shown in our study. Although the authors Among both, the workforce represents the more dif- tried to harmonize the retrieved data, the lack of a com- ficult asset to be rapidly increased. Therefore, in many mon definition should be noted, and conclusions should countries the number of ICU beds must be differenti- be drawn with caution (Online Appendix 1: detailed ated by physical and staffed ICU beds. In our analysis, information for each country). the data did not allow for this differentiation. Another It should be noticed that low accessibility indices are aspect of the expansion of intensive care capacity is the not equivalent to a low quality of care or the result of temporal aspect. The increased capacity will likely be inadequate planning. They rather display the distribution reduced once the issue leading to the increased demand of care provision at subnational levels that results from has been resolved. Therefore, many countries use tem- the interplay of national public health strategies and the porary infrastructures (such as operating rooms or spatial distribution of the underlying population. As such, other hospital spaces) to increase the number of hos- if health polices prioritized centralization of health-care pital beds in such situations. Our results may also help services, AI will tend to cluster spatially, as was the case optimize locating such temporary facilities in case of in Sweden [31]. Additionally, centralizing certain health- an increased need for intensive care. In this regard, the care services may improve the quality of specialized care. findings suggest that Germany is particularly well posi- For example, centralizing neonatal care in fewer facilities tioned to manage an increased need for intensive care has been shown to reduce mortality in very-low-birth- due to a large number of intensive care beds that are weight infants [32]. Furthermore, in some countries the distributed throughout the country. In contrast, Italy focus of the health-care system has been put on primary and France have more lower numbers of intensive care health care (e.g., in Nordic countries), whereas in other beds that are also more spatially concentrated, and thus countries like Germany attention has been turned toward localized shortages are possible, for example, during a specialized care, which may explain the findings reported local COVID-19 outbreak [36]. However, provision of in this study. a large number of ICU beds that may not be needed for During pandemic outbreaks such as COVID-19, scar- routine care (i.e., aside from situations like the current cities of health-care resources are a primary concern pandemic) increases health-care expenditures. There- due to the increased mortality that can occur when fore, aspects of health economics should also be con- health-care systems are overwhelmed. The planning sidered. Simply increasing the number of ICU beds may of hospital beds for intensive care as well as for other not always be the best approach to achieve better out- specialties is usually based on planning models that comes for the severely ill. include relevant information such as demographic In conclusion, our results provide novel insights into data, average length of stay, admission rates, and bed the distribution of intensive care resources in Europe occupancy rates [33]. In many situations (e.g., terror- and also suggest that low accessibility of intensive care ist attacks or the COVID-19 pandemic), intensive care is related with higher CFR of COVID-19. The results resources may be needed beyond existing capacity, may help to contextualize the spatial dynamics in situ- and therefore capacity of these critical services has to ations where demand for care exceeds capacity, as was be expanded to meet the increased demand [3, 34, 35]. the case in northern Italy in early 2020 [36]. Finally, our Hospitals are urged to utilize existing response plans or findings may provide a resource to public health officials
by helping to define areas where increased health-care 2. Graham RL, Donaldson EF, Baric RS (2013) A decade after SARS: strategies
for controlling emerging coronaviruses. Nat Rev Microbiol 11:836–848.
capacity is most needed in case of an increased need for https://doi.org/10.1038/nrmicro3143
intensive care. 3. Raux M, Carli P, Lapostolle F et al (2019) Analysis of the medical response
to November 2015 Paris terrorist attacks: resource utilization according
Electronic supplementary material to the cause of injury. Intensive Care Med 45:1231–1240. https://doi.
The online version of this article (https://doi.org/10.1007/s00134-020-06229-6) org/10.1007/s00134-019-05724-9
contains supplementary material, which is available to authorized users. 4. Dong E, Du H, Gardner L (2020) An interactive web-based dashboard
to track COVID-19 in real time. Lancet Infect Dis 20:533–534. https://doi.
org/10.1016/S1473-3099(20)30120-1
Author details 5. Bassi LL, Hwenda L (2020) COVID-19: time to plan for prompt universal
1
Division of Health Services Research, Institute of Occupational Medicine, access to diagnostics and treatments. Lancet Glob Health 8:e756–757.
Social Medicine and Environmental Medicine, Goethe University Frankfurt, https://doi.org/10.1016/S2214-109X(20)30137-6
Theodor Stern Kai 7, 60590 Frankfurt, Germany. 2 Institute of Health Econom- 6. European Centre for Disease Prevention and Control (2020) Risk assess-
ics and Health Care Management, Helmholtz Zentrum München, German ment on COVID-19, 8 April 2020. https://www.ecdc.europa.eu/en/curre
Research Center for Environmental Health (GmbH), Ingolstädter Landstr. 1, nt-risk-assessment-novel-coronavirus-situation. Accessed 24 Apr 2020
85764 Neuherberg, Germany. 3 Department of Economics, Martin Luther 7. World Health Organization (2020) COVID-19 strategic preparedness and
University Halle-Wittenberg, 06099 Halle an der Saale, Germany. 4 Nuffield response plan—operational planning guidelines to support country
Department of Medicine, Malaria Atlas Project, Big Data Institute, University preparedness and response. Geneva
of Oxford, Roosevelt Drive, Oxford OX3 7FY, UK. 8. Rhodes A, Ferdinande P, Flaatten H et al (2012) The variability of critical
care bed numbers in Europe. Intensive Care Med 38:1647–1653. https://
Author contributions doi.org/10.1007/s00134-012-2627-8
JB designed the study, monitored the data collection, cleaned and analyzed 9. Eurostat (2020) Proportion of population aged 65 and over. https://
the data, prepared cartographic material and drafted the paper. DB, DK, ec.europa.eu/eurostat/databrowser/view/tps00028/default/table
WM, LS, DW and DG revised the paper. DW, LS and WM contributed to the ?lang=en. Accessed 24 Apr 2020
methodological aspects of the study. All authors discussed the results and 10. Guagliardo MF (2004) Spatial accessibility of primary care: con-
contributed to the final manuscript. cepts, methods and challenges. Int J Health Geogr 3:3. https://doi.
org/10.1186/1476-072X-3-3
Funding 11. Barber RM, Fullman N, Sorensen RJD et al (2017) Healthcare Access and
Open Access funding provided by Projekt DEAl. Quality Index based on mortality from causes amenable to personal
health care in 195 countries and territories, 1990–2015: a novel analysis
Compliance with ethical standards from the Global Burden of Disease Study 2015. Lancet 390:231–266. https
://doi.org/10.1016/S0140-6736(17)30818-8
Conflicts of interest 12. Weiss D, Nelson A, Gibson H et al (2018) A global map of travel time to
The authors state that there are no conflicts of interest. cities to assess inequalities in accessibility in 2015. Nature 553:333–336
13. Center for International Earth Science Information Network-CIESIN-
Ethical approval Columbia University (2018) gridded population of the world, version 4
Ethics approval was not required. (GPWv4): basic demographic characteristics, revision 11
14. Guidet B, de Lange DW, Boumendil A et al (2020) The contribution of
Availability of data and material frailty, cognition, activity of daily life and comorbidities on outcome in
Data will be shared by the authors on reasonable request. acutely admitted patients over 80 years in European ICUs: the VIP2 study.
Intensive Care Med 46:57–69. https://doi.org/10.1007/s00134-019-05853
Open Access -1
This article is licensed under a Creative Commons Attribution-NonCommercial 15. Luo W, Qi Y (2009) An enhanced two-step floating catchment area
4.0 International License, which permits any non-commercial use, sharing, (E2SFCA) method for measuring spatial accessibility to primary care phy-
adaptation, distribution and reproduction in any medium or format, as long as sicians. Health Place 15:1100–1107. https://doi.org/10.1016/j.healthplac
you give appropriate credit to the original author(s) and the source, provide a e.2009.06.002
link to the Creative Commons licence, and indicate if changes were made. The 16. Natale F, Ghio D, Tarchi D, et al (2020) COVID-19 cases and case fatality
images or other third party material in this article are included in the article’s rate by age. https://ec.europa.eu/knowledge4policy/publication/covid
Creative Commons licence, unless indicated otherwise in a credit line to the -19-cases-case-fatality-rate-age_en. Accessed 17 Aug 2020
material. If material is not included in the article’s Creative Commons licence 17. Campbell O, Graham W (2006) Strategies for reducing maternal mortality:
and your intended use is not permitted by statutory regulation or exceeds the getting on with what works. Lancet 368:1284–1299
permitted use, you will need to obtain permission directly from the copyright 18. Tonelli M, Wiebe N, Culleton B (2006) Chronic kidney disease and mortal-
holder. To view a copy of this licence, visit http://creativecommons.org/licen ity risk: a systematic review. Soc Nephrol 17:2034–2047
ses/by-nc/4.0/. 19. Nolte E, Bain C, McKee M (2006) Diabetes as a tracer condition in interna-
tional benchmarking of health systems. Diabetes Care 29:1007–1011
20. Penchansky R, Thomas J (1981) The concept of access: definition and
Publisher’s Note relationship to consumer satisfaction. Med Care 19:127–140
Springer Nature remains neutral with regard to jurisdictional claims in pub-
21. Bauer J, Groneberg DA, Maier W et al (2017) Accessibility of general and
lished maps and institutional affiliations.
specialized obstetric care providers in Germany and England: an analysis
of location and neonatal outcome. Int J Health Geogr 16:44. https://doi.
Received: 3 July 2020 Accepted: 21 August 2020
org/10.1186/s12942-017-0116-6
22. Rajgor DD, Lee MH, Archuleta S et al (2020) The many estimates of the
COVID-19 case fatality rate. Lancet Infect Dis 20:776–777. https://doi.
org/10.1016/S1473-3099(20)30244-9
23. Public Health Agency of Sweden (2020) Table for number of patients,
References number of patients per 100,000, number of intensive care units and num-
1. Groneberg DA, Poutanen SM, Low DE et al (2005) Treatment and vaccines ber of deaths reported per region. https://experience.arcgis.com/exper
for severe acute respiratory syndrome. Lancet Infect Dis 5:147–155. https ience/2dc63e26f509468f896ec69476b0dab3. Accessed 19 Aug 2020
://doi.org/10.1016/S1473-3099(05)01307-124. Ofoma UR, Montoya J, Saha D et al (2020) Associations between hospital 31. Svederud I, Virhage M, Medin E et al (2015) Patient perspectives
occupancy, intensive care unit transfer delay and hospital mortality. J Crit on centralisation of low volume, highly specialised procedures in
Care 58:48–55. https://doi.org/10.1016/j.jcrc.2020.04.009 Sweden. Health Policy 119:1068–1075. https://doi.org/10.1016/j.healt
25. Harris S, Singer M, Rowan K, Sanderson C (2015) Delay to admission hpol.2015.01.016
to critical care and mortality among deteriorating ward patients in 32. Phibbs CS, Baker LC, Caughey AB et al (2007) Level and volume of neona-
UK hospitals: a multicentre, prospective, observational cohort study. tal intensive care and mortality in very-low-birth-weight infants. N Engl J
Lancet (London, England) 385(Suppl):S40. https://doi.org/10.1016/S0140 Med 356:2165–2175. https://doi.org/10.1056/NEJMsa065029
-6736(15)60355-5 33. Ravaghi H, Alidoost S, Mannion R, Bélorgeot VD (2020) Models and
26. Bauer J, Groneberg DA (2016) Measuring spatial accessibility of health methods for determining the optimal number of beds in hospitals and
care providers—introduction of a variable distance decay function within regions: a systematic scoping review. BMC Health Serv Res 20:186. https
the floating catchment area (FCA) method. PLoS ONE 11:e0159148. https ://doi.org/10.1186/s12913-020-5023-z
://doi.org/10.1371/journal.pone.0159148 34. Rathnayake D, Clarke M, Jayasooriya L (2019) Hospital surge capacity: The
27. Wang F (2012) Measurement, optimization, and impact of health care importance of better hospital pre-planning to cope with patient surge
accessibility: a methodological review. Ann Assoc Am Geogr 102:1104– during dengue epidemics—a systematic review. Int J Healthc Manag
1112. https://doi.org/10.1080/00045608.2012.657146 1–8. https://doi.org/10.1080/20479700.2019.1692517
28. Emerson P, Dodds N, Green DR, Jansen JO (2018) Geographical access to 35. World Health Organization (2014) Hospital preparedness for epidemics.
critical care services in Scotland. J Intensive Care Soc 19:6–14. https://doi. Geneva
org/10.1177/1751143717714948 36. Remuzzi A, Remuzzi G (2020) COVID-19 and Italy: what next? Lancet
29. Einav S, Benoit DD (2019) Focus on ethics of admission and discharge 395:1225–1228. https://doi.org/10.1016/S0140-6736(20)30627-9
policies and conflicts of interest. Intensive Care Med 45:1130–1132. https
://doi.org/10.1007/s00134-019-05673-3
30. Eurostat (2020) Hospital beds by type of care. https://appsso.eurostat.
ec.europa.eu/nui/show.do?dataset=hlth_rs_bds&lang=en. Accessed 28
Apr 2020You can also read