Ad hoc request Country fiches on skills governance in the Member States - European Employment Policy Observatory (EEPO) - Europa EU
←
→
Page content transcription
If your browser does not render page correctly, please read the page content below
European Employment Policy Observatory (EEPO)

                    Ad hoc request
Country fiches on skills governance
      in the Member States

                         Ireland

Seamus McGuinness
Adele Whelan
ESRI
June 2015
EUROPEAN COMMISSION Directorate DG Employment, Social Affairs and Inclusion Unit C.1 – Europe 2020: Employment Policies: European Employment Strategy and Governance E-mail: empl-c1-unit@ec.europa.eu European Commission B-1049 Brussels
EUROPEAN COMMISSION

       European Employment Policy Observatory (EEPO)

                        Ad hoc request
Country fiches on skills governance
      in the Member States

                                         Ireland

             Seamus McGuinness and Adele Whelan1

   1The authors would like to thank Jasmina Behan in SOLAS, Alan McGrath from the Higher
   Education Authority, Jennifer McKenzie and Ursula Kearney in the National Centre for
   Guidance in Education for assisting us by interview and providing us with access to a range
   of key information resources, and to those other individuals within these organisations who
   assisted with follow-up queries.

             Directorate-General for Employment, Social Affairs and Inclusion
                    European Employment Policy Observatory (EEPO)

June, 2015
European Employment Policy Observatory
Europe Direct is a service to help you find answers
to your questions about the European Union.
Freephone number (*):
00 800 6 7 8 9 10 11
(*) The information given is free, as are most calls (though some operators, phone boxes or hotels
may charge you).
LEGAL NOTICE
This document has been prepared for the European Commission however it reflects the views only of the
authors, and the Commission cannot be held responsible for any use which may be made of the information
contained therein.
More information on the European Union is available on the Internet (http://www.europa.eu).
Luxembourg: Publications Office of the European Union, 2015
ISBN ABC 12345678
DOI 987654321
© European Union, 2015
Reproduction is authorised provided the source is acknowledged.Skills Governance in Ireland
1 Imbalances in the labour market
The Irish labour market continues to recover with the unemployment rate declining
steadily from a peak of 14.7 per cent in Q3 2012 to 9.9 per cent in Q1 2015 (Table 1).
However, despite the fact that unemployment in Ireland remains relatively high, the
evidence relating to the extent of labour market imbalances in the labour is quite
mixed. On one hand we have a series of publications based on occupational
forecasting models and vacancy data that suggests the existence of skill shortages,
while other studies indicate that Ireland has one of the highest incidences of
overeducation in Europe. Probably the most reliable indicator of skill shortages in the
labour market comes from the bi-annual recruitment survey index published by
Solas2. Data on difficult-to-fill vacancies collected in April 2014 produced the following
findings with respect to labour market imbalances (National Skills Bulletin, 2014):
Approximately 90 per cent of difficult-to-fill (DTF) vacancies attributed the
problem to a lack of suitable candidates as opposed to problems with the
attractiveness of the post;
Three-quarters of DTF vacancies were for professional posts;
Two-thirds of DTF vacancies were in ICT and industry (e.g. high-tech
manufacturing);
Almost 40 per cent of DFTs were for posts requiring five or more years
experience;
Almost half of DFT vacancies were filled with non-Irish nationals.
It is clear that skill-shortages do exist in some professional occupations, particularly in
ICT, nevertheless, surveys of recruitment agencies cannot be used to provide any
reliable estimate of the scale of the problem. A study examining the total demand for
ICT skills published by the Expert Group on Future Skills Needs (EGFSN) estimated
that the annual demand for ICT skills will grow from 65,350 in 2011 to 91,180 in
2018. In total the report estimates that there will be potentially 44,500 ICT job
openings between 2013 and 2018 (EGFSN, 2013). It is not clear from the report
exactly how demand was estimated, so it is not possible to comment on the
plausibility of the figures. Furthermore, while detailed figures were provided for levels
of demand at various education levels across both computing and electronic
engineering, the report did not contain any estimates of the potential imbalance
between supply and demand. Nevertheless, the EGFSN report leaves the reader with a
clear impression that there exists a strong potential for skill shortages in the ICT
sector.
The evidence of skill shortages in some areas is counterbalanced by evidence of the
under-utilisation of workers in the Irish labour market. A forthcoming study by
McGuinness, Bergin and Whelan (2015) demonstrates that the rate of overeducation
in Ireland is among the highest in Europe. Table 2 compares estimates of the
overeducation rate from the McGuinness et al. study based on EU LFS data (column 1)
and a study by Flisi et al. (2014), who apply a similar estimation strategy to PIAAC
data (column 2). McGuinness et al. (2015) generally observe the estimated incidence
of overeducation to be lowest in new European countries, highest in peripheral states
and with old European countries lying somewhere in the middle. There are, some
exceptions to this general pattern, for instance, overeducation rates were relatively
2 All recruitment agencies that are members of the National Recruitment Federation of Ireland
were contacted and 36 agencies reported the level of difficulty in sourcing suitable candidates
for their clients.
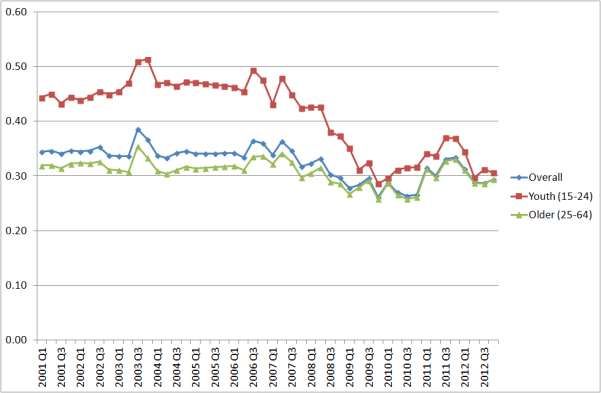
June, 2015 1Skills Governance in Ireland high in Lithuania and Estonia, while overeducation in Portugal was well below the level observed in other peripheral countries. Flisi et al. (2014) applied a comparable approach to OECD Programme for the International Assessment of Adult Competencies (PIAAC) data. The estimates from both studies are highly correlated and indicate that overeducation appears to be a significant problem in Ireland. In addition to providing point estimates of the overeducation rate, McGuinness et al. (2015) also plot the evolution of overeducation over time for separate age groups. Figure 1 shows that overeducation in Ireland remained relatively stable over the period 2001 to 2012 and, in common with most other countries, does not exhibit a strong cyclical pattern. However, overeducation rates, particularly among young people were observed to have fallen somewhat during the recession, presumably due to higher numbers emigrating or remaining in education. With respect to skill gaps, i.e. the extent to which existing employees lack the requisite skills to meet the performance requirements of the job, the evidence is rather thin. A recent study by McGuinness & Ortiz (2014) use linked employee- employer data to examine the incidence of skill gaps from the perspective of both workers and employers. The areas where skill gaps are more highly reported under both indicators (employee and employer) were IT and communication and, to a lesser extent, technology and management. Approximately one-third of employers reported that workers had insufficient competencies in IT and communication, similarly, approximately 50 per cent of workers believed that they required additional training in these areas in order to be competent in their current job. More recently, Solas published a National Employer Survey (2015) which collected some information on the extent of skill gaps among new labour market entrants from Further and High Education Establishments. Around 40 per cent of employers reported that the skills that they currently required (or would require over the next five years) were not available in sufficient quantities. The most frequently occurring skills listed as in deficit by employers were engineering, specific languages, data analysis and software/IT/programming-related skills (EGFSN, 2015). Thus, in summary, the evidence on imbalances points to the existence of skill shortages and skill gaps concentrated in a number of professional areas, such as ICT, within a labour market where the level of general under-utilisation of educated labour appears particularly high by international standards. 2 Production of labour market and skills intelligence The bulk of Ireland’s labour market intelligence is produced by Skills and Labour Market Research Unit (SLMRU) based in Solas. The SLMRU are responsible for the development and publication of a range of labour market indicators such as vacancy statistics and intelligence, employer’s surveys, sectoral studies and occupational forecasts. The SLMRU produces a National Skills Bulletin (see Solas, EGFSN 2014) providing an annual overview of the health of the Irish labour market and typically contains chapters on changes on sectoral and occupational employment patterns, unemployment, labour market transitions, hard-to-fill vacancies and work permits issued to non-nationals. Nevertheless, the SLMRU occupational forecasts represent the most prominent and heavily used labour market intelligence tool in Ireland. The SLMRU is entered as a separate funding item in the exchequer listings and is funded directly from the Irish government separately from Solas. 2.1 Forecasting capabilities Occupational forecasting in Ireland was initially carried out by the Economic and Social Research Institute (ESRI) as an extension to their Medium Term Forecasts, which were June, 2015 2
Skills Governance in Ireland
generated using the macroeconomic model HERMES approximately every three years.
In 2009, the ESRI signalled their intention to cease the publication of the occupational
forecasts. The 2009 forecasts were produced jointly by the ESRI and the Skills and
Labour Market Research Unit (SLMRU), then based in FÁS, with the SLMRU taking sole
responsibility for the generation of the forecasts since 2010. The SLMRU occupational
forecasts figure heavily in the publications by the EGFSN which provide most of the
analysis on future skills needs for central government, educational institutions and
representative bodies.
The occupational forecasts are built around extensions to the Economic and Social
Research Institutes (ESRI) macroeconomic and demographic models. The ESRI models
are generally published at three year intervals and generate employment forecasts,
based in principal economic status (PES), over a medium term time horizon for eleven
sectors of the Irish economy. As there is usually some discrepancy between the
current ESRI sectoral employment series and the most recent census estimates
published by the CSO, the SLMRU generate the forecast series by applying the ESRI
sectoral growth rates to the most recent estimates of sectoral employment published
by the CSO. The SLMRU then further disaggregate to generate a further four sectors
using historical subsector shares for example Other Market Services is separated into
(i) accommodation and food (ii) financial, insurance and real estate (iii) professional
scientific and technical, and (iv) other market services; the Health and Education
sector is subdivided into (i) education and (ii) health and social work. The historical
occupational distribution of employment for each sector is derived from the Quarterly
National Household Survey (QNHS) which provides historical data for 133 occupations
within each of the 15 designated sectors. The sector specific occupational shares are
extrapolated forward over the forecast horizon using a linear trend for established
occupations within sectors and a log-linear trend for occupational patterns requiring a
more conservative approach. The extrapolated occupational shares are applied to the
sectoral employment forecasts to generate occupational employment projections. The
occupational employment projections are finally used to generate estimates of the
expansion demand for skills by extrapolating forward the trend in the educational
share within occupations and applying these to the occupational employment
forecasts. As an additional integrity check the SLMRU consult key agencies and
employer bodies such as the Industrial Development Board (IDA), Irish Business and
Employer’s Confederation (IBEC) and the ESRI on the reasonableness of the forecasts
prior to publication3.
In terms of the technology underpinning the forecasts, the Irish approach is in line
with international best practise in the area. The key strengths of the Irish approach
lies in the dissemination policy undertaken by the SLMRU in order to ensure that the
impact of the forecasts on public policy is as wide ranging as possible. As is the case
with all forms of occupational forecasting, the projections produced by the SLMRU
have a number of limitations such as:
The models operate independently of labour supply and cannot account for the
capacity of education and training providers to adjust supply in response to
changing labour market demands4.
The methodology is based around extrapolating forward historical occupational
and sectoral shares and, as such, cannot explicitly incorporate the major impact
of technological change on the demand for labour.
3 IBEC is Ireland’s main employer representative body.
4 In the Irish case, the capacity of the post-compulsory education and training system has been
effectively audited by the SLMRU. See Monitoring Irelands Skills Supply (SLMRU, 2014).
June, 2015 3Skills Governance in Ireland
The reliability of the occupational forecasts are completely dependent on the
accuracy of the macroeconomic model on which they were based. As has been
the case in many other countries badly affected by the great recession, the
reliability of Irish macroeconomic forecasting models has been called into
serious question in recent years.
While occupational forecasts are a useful guide to the general direction of
labour demand in an economy, they are not generally used to provide reliable
estimates of the demand for newly qualified labour at various educational levels
and fields of study. Even if the models could be modified to generate such
estimates to inform the scale of required changes in educational planning, the
methodology cannot inform decisions around the changes necessary to the
structure of course provision necessary to meet the needs of employers. The
benefits of occupational forecasting from a human capital development
perspective, with respect to planning for skills and education provision, are
likely to be maximised only if considered in conjunction with systematic
evidence collected from employer’s surveys outlining the specific course
requirements and competencies in various fields of study.
2.2 Transmission and use of information
The occupational forecasts are widely disseminated and are sent by the SLMRU
directly to all government departments, universities and Education and Training
Boards (ETBs). The occupational forecasts are a central element in the activities of
the EGFSN which exerts a substantial influence on government policy, the EGFSN’s
publications and associated press releases also enjoy substantial media attention in
Ireland. It is reasonable to conclude that, on the basis of the SLMRU dissemination
strategy, that most relevant bodies and organisations are adequately informed with
respect to the occupational forecasts at a senior management level.
As a consequence mainly of the major impact of the great recession on the Irish
labour market, the forecasts were developed into an online tool that was designed to
assist Public Employment Office desk officers in advising unemployment claimants,
however, the tool has unrestricted access and is publically available to all potential
users (see http://lmi.fas.ie/search.aspx). There is a link to the labour market
intelligence tool on the front page of the EGFSN webpage. The tool allows users to
click on any of 133 occupations in order to receive a summary of labour market
prospects for that occupation including changes in employment rates over recent
years, the educational and age break down of the occupation and future employment
prospects (based on the SLMRU occupational forecasts). The tool basically summarises
occupational prospects based on current information contained in the Solas Labour
Market Bulletin and the SLMRU occupational forecasts. Therefore, in terms of
dissemination it would appear that the Irish forecast data is effectively communicated
at a senior government and agency level by both direct mailing and the activities of
the EGFSN. At a more decentralised level, the occupational forecast data and other
occupational information, is available via the online tool. Nevertheless, the extent to
which the available labour market intelligence actually influences government policy
on skill formation or are heavily used by career teachers / PES case workers is much
less clear.
3 Steering the education and training provision
3.1 Policies and programmes
With respect to the Further Education and Training sector, the Post Leaving Certificate
(PLC) represents the cornerstone of Further Education and Training (FET) in Ireland,
accounting for 50 per cent of total FET enrolments and over 80 per cent of full-time
June, 2015 4Skills Governance in Ireland
enrolments (McGuinness et al. 2014). During 2014 there were 32,544 PLC places
available at an estimated direct5 cost of €169m6 (SOLAS, 2014). Direct costs per PLC
student have been estimated at €4,775 per annum (Sweeney, 2014). Approximately
95 per cent of PLC places were located within the Education and Training Boards
(ETBs) approved sector during 2014, with the remaining 5 per cent of places offered
by Voluntary Secondary and Community Schools. According to the “Conditions of
Approval” that must be met before a PLC course is approved, PLC providers must
provide a labour market justification for all new courses before they can be approved
(National Development Plan 2007-2013). Among other things, providers must
demonstrate how the course aligns with Government policy and addresses skills gaps
at either the local or national level. These conditions of approval suggest very strongly
that labour market intelligence tools, including occupational forecasts, should be given
consideration for both the development of new PLC programmes and in assessing the
relevance of existing provision. The research to date suggests that this has not been
the case. McGuinness et al. (2014a) conclude that FET provision in Ireland is only
weakly correlated with labour market demand.
“The study assessed, at a broad level, the extent to which the pattern of the
outputs of the FET sector matched the structure of labour market demand for
sub-degree vocational labour. Accepting that there should be only limited
weight attached to methodologies centred on occupational forecasting, overall,
it was found that the distribution of major awards across field of study did not
appear to strongly reflect the structure of the vocational labour market.
Crucially, there appears to be little or no provision in areas of labour demand
such as Manufacturing or Transport/Logistics.” (McGuinness et al., 2014a).
Solas highlighted the lack of linkages between provision and labour market demand in
the five year strategy document and have undertaken to address the issue (Solas,
2014). Solas have just commissioned an evaluation of the PLC programme, which will,
among other things, assess the extent to which labour market intelligence tools are
used to inform the planning of provision. However, there is evidence of some usage of
labour market intelligence in FET planning. The Momentum programme, formally run
by FÁS appears to be more closely related to labour market demand. The programme
is supported through the Labour Market Training and Education Fund (LMETF) and is
now administered by Solas. The initiative is funded by European Social Fund/European
Structural Funds Programme 2014-2020. Momentum offers 6,500 training places to
long-term unemployed claimants in areas that have been identified as having growth
potential. It is clear that labour market intelligence and occupational forecasts are
likely to have represented important inputs in the identification of growth sectors.
However, this has not been specifically documented. Current growth areas for
Momentum are ICT, digital media, healthcare and social services, the green economy,
food processing and sales and marketing.
Furthermore, The Apprenticeship Implementation Plan (2014) which sets out the
approach to developing new apprenticeships recommends that proposal should be
industry led and that employer consortia should identify the occupations, which were
considered by them to be suitable for apprenticeships. A certain proportion of FAS
5Excludes any capital cost allocation.
6This consists of €150m for PLC teacher costs, €4m PLC standard student caption and €15m in
grant support to PLC students.
June, 2015 5Skills Governance in Ireland training programmes7 have also been shown to have close links with the labour market (McGuinness, O’Connell & Kelly, 2014). With respect to the Higher Education (HE) sector, the Springboard programme is specifically orientated towards areas of perceived high labour demand based on existing labour market intelligence. The objective of Springboard is to re-skill or upskill unemployed people into sustainable employment i.e. areas of the labour market that have been highlighted as requiring skilled graduates. The courses offer certification up to Masters level and there are up to 6,000 places available annually. The designated Springboard areas are established on the basis of advice from the EGFSN. The occupational forecast data and other labour market intelligence form substantial inputs into the EGFGN’s decision making processes. Current designated Springboard areas include ICT, high-level manufacturing, financial services, cross enterprise skills, niche construction areas and entrepreneurship all designated areas for provision in 2015. It should be noted that Springboard represents a relatively small share of total HE courses and there is little evidence to show that the composition of the vast majority of HE, non-Springboard, provision is heavily influenced by labour market intelligence. 3.2 Financial incentives In its five-year strategy document (Solas, 2014), Solas has outlined plans to link funding with programme performance, which would suggest that providers will be required to give more attention to the labour market relevance of programmes in future. In terms of the momentum programme, the training courses are free and trainees can retain their social welfare entitlements while undergoing training. With respect to HE, Springboard courses are free, thus participants do not have to pay a registration fee8, furthermore, unemployed claimants can also retain their full benefits entitlements while undertaking Springboard courses9. The Springboard initiative has been funded from the National Training Fund to date, however, it is to be included in the 2014 to 2020 ESF round. 4 Career and vocational guidance In terms of career guidance, the EGFSN engages with stakeholders to ensure that key labour market information is disseminated to all relevant parties. The EGFSN’s output is disseminated to students, jobseekers and guidance counsellors through websites and newsletters to which they provide regular input, such as Careers Portal 10, and the Institute of Guidance Counsellors, in order to inform their target audiences. The Careers Portal is also publically available making it a resource which can also be used by PES, employers and/or the wider public. The site was officially launched by the Minister for Education and Science in 2008 and was developed as a direct response to a report generated by the Expert Group on Future Skills Needs (EGFSN) in 2006, which recommended that a single careers portal website be developed to provide information to a range of different user groups each with different guidance requirements. This web portal provides a wide range of labour market information across all sectors and occupations. For example, when viewing information on the Social and Caring Professions, the EGFSN’s output on employment trends, sample occupations and occupations in demand are embedded as information tabs in the 7 The ETBs now have responsibility for the former FAS training centres. 8 Currently in excess of €3000. 9 The majority of Springboard courses are part-time. 10 http://www.careersportal.ie/ June, 2015 6
Skills Governance in Ireland

portal. It is supported by both public and private organisations and reports that its
user base is now receiving over 2.3 million page impressions a month. Springboard
offers telephone guidance from fully qualified guidance counsellors. Momentum has no
specific telephone career guidance but individuals are likely to be directed by Intreo
case officers. Specific measures aimed at steering students towards specific subjects
or campaigns to raise awareness/interest in subjects in demand are not used.
Students are free to choose with the information as provided.

5      Stakeholders in steering education and training provisions
The EGFSN was established in 1997 and constitutes a social partnership forum that
provides direct advice to the Government on the future skills needs of the Irish
economy. The expert skills group is made up of representatives from trade unions,
employer’s bodies, civil servants, semi-state bodies, voluntary organisations,
representatives from HE, FET and careers guidance services. The EGFSN reports to the
Minister for Jobs, Enterprise and Innovation and the Minister for Education and Skills.
In delivering its advice to Government, the EGFSN draws heavily on the work of the
SLMRU, which provides the group with data and analysis from both the occupation
forecasters and the National Skills Database.
The main strength of the EGFSN is that it is a fully representative body that provides
detailed advice to governments based on the most up-to-date labour market
intelligence and occupational forecasting data available. The principal drawback of the
approach, as discussed above, is the existing labour market intelligence infrastructure,
while sufficient to give broad indicators of the general direction of future labour
market demand, it does not appear to have the support infrastructure that would
enable it to ensure that specific courses and their content meet the demand of
industry.
At a local regional level, the DES is in the process of developing a ‘Skills Forum’
through which all local education and training representatives can engage with
employers to access the degree to which existing provision is aligned to their needs.
The SLMRU will provide labour market intelligence support to this process which will
help to inform education and training providers about the skills requirements of firms
at a more detailed level. Nevertheless, it is unclear the extent to which the findings of
this skills forum will have implications for the nature of course provision at a national
level.
The level of employer engagement in informing course provision is extremely limited
in Ireland. Much more needs to be done to ensure that there exists structures through
which employers can provide direct, ongoing and systematic inputs into the course
planning process at both the HE and FE levels. The development of such structures, in
conjunction with the existing labour market intelligence produced by the SLMRU and
EGFSN, would provide a more complete picture of the nature of current and future
labour market demands that would enable FE and HE providers to plan course
provision more closely aligned to labour market needs.

June, 2015                                                                             7
Skills Governance in Ireland
6 Bibliography
Department of Education and Skills (2015). National Employer Survey:
Employers' Views on Irish Further and HE and Training Outcomes. Dublin:
Higher Education Authority, SOLAS and Quality and Qualifications Ireland
(QQI).
Expert Group on Future Skills Needs. EGFSN. (2013). Addressing Future
Demand for High-Level ICT Skills. Dublin: Expert Group on Further Skill Needs.
Flisi, S., Goglio, V., Meroni, E., Rodrigues, M. and Vera-Toscano, E. (2014).
Occupational mismatch in Europe: Understanding Overeducation and
Overskilling for Policy Making. JRC Science and Policy reports, European
Commission, Luxemburg, ISSN 1831-9424.
McGuinness, S., Bergin, A., Whelan, A. (2015). A Comparative Time Series
Analysis of Overeducation in Europe: Is there a common policy approach?
STYLE Working Papers, STYLE-WP 02/2015. CROME, University of Brighton,
Brighton. http://www.style-research.eu/publications
McGuinness, S., Bergin, A., Kelly, E., McCoy, S., Smyth, E., Whelan, A. and
Banks, J., (2014). Further Education and Training: Past, Present and Future,
Research Series (35). Dublin: ESRI/SOLAS.
McGuinness, S., O’Connell, P. & Kelly, E. (2014) “The Impact of Training
Programme Type and Duration on the Employment Chances of the
Unemployed in Ireland”, Economic and Social Review, Vol. 45(3), pp.425-450.
McGuinness, S. and Ortiz, L. (2014). Who Should we Ask: Employer and
Employee Perceptions of Skill Gaps within Firms, ESRI Working Paper 48 (under
review).
Skills and Labour Market Research Unit. SLMRU. (2014). Monitoring Ireland’s
Skills Supply: Trends in Education and Training Outputs 2014. Dublin: SOLAS
Further Education and Training Authority and Expert Group on Further Skill
Needs.
SOLAS, EGFSN (2014). National Skills Bulletin 2014, Dublin: SOLAS Further
Education and Training Authority and Expert Group on Future Skill Needs.
SOLAS. (2014). Further Education and Training Strategy 2014-2019. Dublin:
SOLAS.
Sweeney, John. NESC. (2013) “A Strategic Review of Further Education and
Training and the unemployed – A Review for the Department of Education and
Skills”. Available at: https://www.education.ie/en/Publications/Education-
Reports/A-Strategic-Review-of-Further-Education-and-Training-and-the-
Unemployed.pdf
June, 2015 8Skills Governance in Ireland
7 Appendix
Table 1. Labour Force Aggregates Q409 to Q115, Seasonally Adjusted
Quarter Labour Employment Unemployed U LF PR
Force Rate
(000’s) %
Q110 2,191.5 1,905.9 286.1 13.0 61.0
Q210 2,195.4 1,889.8 301.1 13.8 60.8
Q310 2,179.9 1,875.4 302.9 13.9 60.6
Q410 2,173.5 1,857.4 319.8 14.7 60.4
Q111 2,164.1 1,855.6 311.9 14.4 60.3
Q211 2,175.3 1,858.3 312.2 14.4 60.3
Q311 2,157.5 1,836.4 320.1 14.8 60.0
Q411 2,166.6 1,845.2 323.3 14.9 60.3
Q112 2,161.5 1,838.5 326.6 15.1 60.2
Q212 2,155.8 1,835.5 316.6 14.7 59.9
Q312 2,149.6 1,832.7 316.0 14.7 59.8
Q412 2,148.6 1,843.3 306.0 14.2 59.8
Q113 2,152.3 1,859.0 295.6 13.7 59.9
Q213 2,167.8 1,872.4 293.2 13.5 60.3
Q313 2,164.2 1,890.1 275.6 12.7 60.3
Q413 2,168.7 1,901.5 265.1 12.2 60.3
Q114 2,161.4 1,901.4 260.7 12.1 60.1
Q214 2,153.5 1,905.5 246.9 11.5 59.9
Q314 2,154.0 1,917.5 239.0 11.1 60.0
Q414 2,158.4 1,930.5 224.9 10.4 59.9
Q115 2,157.7 1943.0 214.9 9.9 59.8
Source: CSO (2015)
June, 2015 9Skills Governance in Ireland
Table 2: Comparison of ESRI and PIAAC Based estimates
ESRI Estimate Estimates based on PIAAC
(2001-2011 average) from EC (2014)
Austria 0.19 0.23
Belgium 0.26 0.24
Bulgaria 0.11
Cyprus 0.31 0.31
Czech Republic 0.08 0.12
Germany 0.18 0.22
Denmark 0.18 0.31
Estonia 0.24 0.26
Spain 0.30 0.34
Finland 0.14 0.17
France 0.17 0.17
Greece 0.28
Hungary 0.13
Ireland 0.33 0.33
Italy 0.24 0.24
Lithuania 0.25
Luxembourg 0.17
Latvia 0.19
Netherlands 0.22 0.22
Poland 0.11 0.11
Portugal 0.18
Romania 0.10
Sweden 0.14 0.19
Slovenia 0.09
Slovak Republic 0.08 0.10
UK 0.21 0.20
Source: McGuinness, Bergin & Whelan (2015); Flisi et al (2014)
June, 2015 10Skills Governance in Ireland Figure 1. Estimated Overeducation Rates in Ireland 2001 to 2012 Source: McGuinness, Whelan & Bergin (2015) June, 2015 11
HOW TO OBTAIN EU PUBLICATIONS
Free publications:
one copy:
via EU Bookshop (http://bookshop.europa.eu);
more than one copy or posters/maps:
from the European Union’s representations
(http://ec.europa.eu/represent_en.htm);
from the delegations in non-EU countries
(http://eeas.europa.eu/delegations/index_en.htm);
by contacting the Europe Direct service
(http://europa.eu/europedirect/index_en.htm) or calling 00 800 6 7 8 9 10 11
(freephone number from anywhere in the EU) (*).
(*) The information given is free, as are most calls (though some operators, phone boxes or hotels
may charge you).
Priced publications:
via EU Bookshop (http://bookshop.europa.eu).
Priced subscriptions:
via one of the sales agents of the Publications Office of the European Union
(http://publications.europa.eu/others/agents/index_en.htm).You can also read