Competitive Composite Highlights - CONSUMER HEALTH May 2020 CHLT
←
→
Page content transcription
If your browser does not render page correctly, please read the page content below

Competitive
Composite
Highlights
May 2020 CHLT

CONSUMER HEALTH
Executive Summary: Q1 Competitive Composite Performance
Overall:
• Competitive Composite is driven primarily by top 3 players (P&G, Unilever, and L'Oréal) accounting for 80% of the composite sales.
• Historically, Competitors have focused on operating profit improvement and have pivoted to focus on growth.
• Each competitor has a unique portfolio with large segments in which Consumer Health does not play; therefore category weighted composite creates a better
benchmark for performance.
Q1:
• Q1-2020 showcased clear winners and losers based on strength of diversified portfolio and ability to respond to COVID crisis. J&J outperformed 5 out 6 competitors
(only RB Q1 +12% outplaced J&J at +11%)
• Players with strong self care, vitamins/supplements portfolios, and hygiene focused home care offerings faired well; however, those with strong premium beauty, travel
retail, perishable food portfolios experienced declines given lockdown restrictions.
o P&G (+6%), Reckitt (+12%), Colgate (+8%) have benefitted from pantry loading with health and hygiene focused segments
o L'Oréal (-4.8%) saw steep declines driven by Luxe business (-9%) impacted greatly by Travel Retail but maintained strength in our most direct competitor,
the Active Segment (+13%) with brands like Kiehls, Cerave
o Despite a heavy Homecare portfolio Unilever remained flat driven by declines in Food, primarily ice cream sales impacted by global lockdowns
o Outside of CC, other Self Care players like GSK (+11%) and Bayer (+6%) grew double digits driven by cough/cold, pain, and vitamins/supplements
solutions
• Consistent with prior quarters, grew e-commerce sales between 35-50% in response to changes in consumer behavior
Outlook:
• Looking at FY guidance, there are varied outlooks - RB signaled an increase in guidance. P&G* and GSK have held 2020 guidance, while L'Oréal, Unilever, &
Colgate have withdrawn FY2020 guidance
• While uncertainty remains for Q2 and 2H2020, we anticipate increased focus/investment behind health & hygiene platforms, more distortion towards e-commerce, and a
more balanced approach to pricing to meet economic downturn ahead.
• Based on FBP, we expect to meet Ops Profit** and exceed IBT & NI vs. composite setting the foundation to grow faster than market while holding competitive margins
2
in 2021 and over the long term.
CONSUMER HEALTH
*Note P&G fiscal year ends June 30, 2020. ** vs. Category Weighted Composite
A complex competitive set with no true like-for-like competitor
Varied portfolios with segments comparable to our CH franchises but large proportions of their business in non-comparable segments; thus
category weighted composite provides more relevant comparison. Competitors focused on op margin improvement starting to drive growth

  Composite                        2020                2020 Ops 2020 Ops CAGR         Comps to J&J Franchises(3)                                                            Non-Comp(3)                       Commentary
  Competitors(1)                   Sales (2)           Growth % Profit % 2019-2024(2) (% of Total Competitor Business)                                                      Home, Food, Pet, Lux
                                                                                                                                                                            (% of Total Business)
                                   (USD B)

                                    $14B                2.2%              20.1%                 2.7%                     32%               29%               38%
                                                                                                                                                                                              P&G’s Essential Health “comparable”
                                    $72B                3.3%              23.1%                  3.7%                    12%               19%                26%               42%           portfolio include Baby Diaper, Toilet Paper;
                                                                                                                                                                                              therefore, not Like-for-like. Non-com
                                                                                                                                                                                              includes Homecare and Grooming
                                                                                                                                                                                              Skin Health and Personal Care
                                    $64B                2.8%              20.1%                  4.8%                        -                   --- 42%---                     58%
                                                                                                                                                                                              reported together. Non-comp
                                                                                                                                                                                              includes Home Care and Food.

                                                                                                                                                                                              Non-comp include Luxe and
                                    $36B                3.5%              19.0%                  5.6%                        -             52%                  -               48%           Professional segments

                                                                                                                                                                                              Non-comp includes Home Hygiene,
                                    $17B                1.6%              22.7%                  3.0%                     15%                -                   -              85%
                                                                                                                                                                                              infant formula, and Other (foot and
                                                                                                                                                                                              sexual health).
                                                                                                                                                                                              Colgate’s “Essential Health” comparable
                                    $16B                3.9%              24.0%                  2.0%
                                                                                                                                                                                              includes Personal Care and Oral Care
                                                                                                                             -              -                 66%               34%           combined, including some non-for-like
                                                                                                                                                                                              categories soaps, toothpaste & toothbrushes

                                      $9B               4.0%              14.5%                  4.5%                                                                                         Non-comp include Tesa tape
                                                                                                                             -             82%                  -               18%           business
   CH Composite                                         3.1%                21.2%                4.2%                                                                                          Note: Click on Competitor Logos
   CH Composite - Category Weighted                                         20.0%                                                                                                              for Overview of Portfolio and
                                                                                                                                                                                               FY2019 Performance
                                                                                                                                                                                                                    CONSUMER HEALTH
     Notes: (1) Top 3 players account for 80% of competitive Composite; (2) Sales, Growth, Ops Profit, and CAGR outlook from 2020 Competitive Composite BP; (3) Comparable and Non-Comparable segment proportions
     based on FY2019 actuals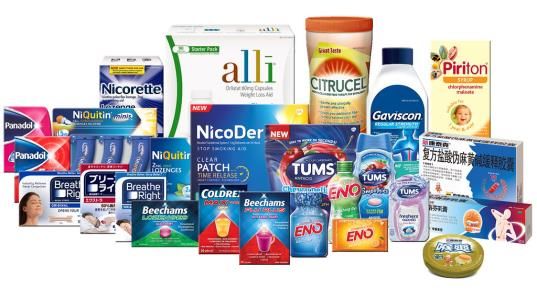
CH to hit Operating Profit* and exceed IBT & NI vs. Composite based on
BP2020; Models to be updated with JU and Q1-20 Comp performance
*CH to meet Ops Profit (20.1%) vs. Category
Weighted benchmark (20.0 %) & exceed IBT & NI
P&L Margin Performance
Margins Summary – BP 2020 CH expecting to fall below Composite
P&L Margin - CONSUMER Competitors
2020 BP
J&J Composite*
P&G* UNLV* L'OREAL* RECKITT COLGATE BEIERSDORF* in Ops Growth (2.2% vs. 3.1%) setting
NTS 13,951 240,900 71,747 63,532 36,985 16,939 16,418 9,042 foundation for growth in 2021
GP%* 58.3% 57.9% 54.9% 48.5% 76.5% 60.9% 59.8% 61.4% Ops Sales Performance
Growth Summary – BP 2020
SG&A %* 34.1% 34.2% 29.0% 26.6% 54.1% 36.5% 34.0% 43.9%
Company Ops. Sales Growth
R&D % 3.4% 2.5% 2.9% 1.8% 3.4% 1.8% 1.8% 3.1% 2020 NTS 2015 2016 2017 2018 2019 2020 BP
OP PROFIT %
* 20.1% 21.2% 23.1% 20.1% 19.0% 22.7% 24.0% 14.5% Beiersdorf
Colgate Palmolive
9,042
16,418
3.0%
4.7%
3.2%
4.0%
5.7%
1.0%
5.4%
0.5%
4.1%
4.0%
4.0%
3.9%
IBT % 21.8% 20.5% 23.3% 18.3% 19.9% 20.7% 21.0% 13.5%
L'Oreal 36,985 3.9% 4.7% 4.8% 7.1% 8.0% 3.5%
NI % 17.2% 15.8% 19.2% 13.4% 14.9% 16.0% 15.7% 9.6%
Procter & Gamble 71,747 0.5% 2.0% 1.5% 2.5% 6.0% 3.3%
TAX rate 20.9% 22.7% 17.8% 26.9% 25.1% 22.6% 25.0% 29.0% Unilever 63,532 4.0% 3.8% 3.1% 2.9% 2.9% 2.8%
Reckitt Benckiser 16,939 6.0% 3.0% 0.0% 3.0% 0.8% 1.6%
Note : (1) J&J color coding (green & red) reflects performance vs. Composite
Consumer Composite 2.9% 3.2% 2.5% 3.4% 4.8% 3.1%
(2) Competitors color coding (blue) reflects Best-In-Class
13,951 4.1% 3.2% -0.5% 3.2% 1.4% 2.2%
* Shifts distribution expense from COGS to SG&A for PG, UNLV, L'Oréal and Beiersdorf J&J Consumer
**
*Consumer Composite Category-Weighted Op Profit Analysis
currently benchmarking 20.0% for Competitor Composite.
**CH Ops Growth excluding SKU rat: 2.8%
CONSUMER HEALTH
Note: Competitive Composite performance to be recast with JU.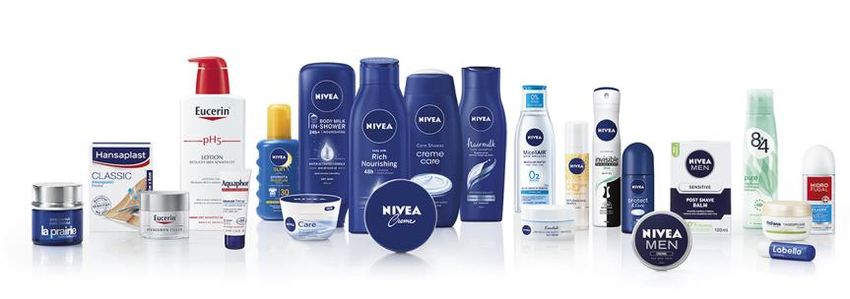
Q1 2020 Performance
Q1 Winners and Losers, Broader Trends and Implications

                              Key Q1 Trends                                    Implications for J&J Consumer Health

    Increased focus on health & personal hygiene solutions                     Greater competitive battleground across self and
    - High growth in Pain, VMS, Other OTC, Oral Care, Cleansing                personal care categories

    Steep declines in Prestige Beauty                                          Competitors may shift media/support models from travel
    - SKII, L'Oréal Luxe, premium brands challenged by dips in Travel Retail   retail to in-country support in Asia. In US, may create opt to
                                                                               downstream consumers from premium to Neutrogena.
    Strong performance by steadfast heritage brands
                                                                               Increased competitive messaging behind efficacy & trust
    - As consumers look for quality, efficacy that still delivers value
                                                                               with a balanced pricing approach mindful of new economics
    Continued eCommerce Acceleration
    - Growth of 35-50% in response to changes in consumer behavior
                                                                               More aggressive e-commerce focus and spend as
                                                                               consumer shift buying behavior
    Targeted Geographical Wins                                                 Competitors will take varied approaches to compensate
    - Pockets of geographical growth including NA, LATAM, and East Europe      for AP declines. Preparedness to meet pent up
    while AP drove steep declines after quarters of consistent growth          demands as restrictions lift in key categories (beauty/sun)
    Variability on outlook and levels of investment                            is critical
    - Varied outlook on market uncertainty for 2020 with some increasing        Flexible spend models required to adapt to changing
    investment and some retracting (Colgate, P&G, Reckitt, GSK, Bayer to        competitive pressures
    invest; while Unilever & L’Oreal may retract)
                                                                                                                         CONSUMER HEALTH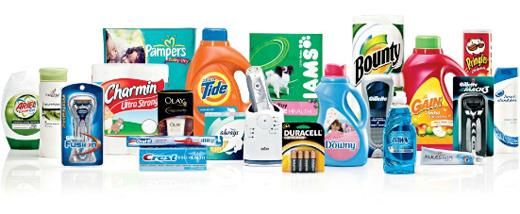
P&G sees uptick, while Unilever and L'Oréal sink in Q1
Top 3 players in Composite had varied performance: P&G strength in Health and Homecare while Unilever
and L’Oreal declined
13.2%
9.0% 10.0%
7.0% 2.4%
6.0%
1.0% 0.3%
Sales -1.0% 0.0%
Total Professional Consumer L'Oréal Active
Total Beauty Health Care Baby Grooming Home Care Total Beauty & PC Home Care Foods & R Products Products Luxe Cosmetics
Performance Fem Below analyst
-1.7%
-4.8%
-3.6%
Family consensus -10.5% -9.3%
14.0% 15.0%
Q1 2020 vs PY 10.0% 11.0% 4.8% 4.9%
J&J Q1 Performance 6.0% 6.0% 0.8%
1.4%
Self Care +25% 0.0% Total Western North Asia Latin Eastern Africa
-3.7% Europe America Pacific America Europe Middle East
Total US Canada Greater Europe Europe LATAM
Skin health +3.5% China Focused Enterprise
Total Asia North America LATAM Europe -4.8% -4.8%
AMET -3.7% -1.4% -5.6%
Essentials (ex Baby) ~10% -8.0% RUB -7.7%
+52.6% | ~20% of company sales
eCommerce +35% | Remained 10% of company sales
+36% | Driven by US, doubled sales vs Q4
+37% | Growth in China +67% | Growth in China
Q1 2020 vs PY
Signaled continued brand investment while • Advertisement production stopped Advertising expenses will be cut while markets are
BME scaling back on trade/pricing promotion • Relocate investment to areas of highest ROI locked down; But investment could follow
Pantry loading has shifted about 2 points of sales Despite growth in homecare (Cif, Domestos bleach, Luxe declines driven by low travel retail. Strength in
Highlights growth on a global basis from Q2 into Q1. Botanical Hygiene and 7th Gen), Food Segment active cosmetics mainly in pharmacies and drug stores
representing 37% of portfolio dragged driven by low ice (Kiehls and Cerave)
& Outlook GP increased 130 bps by productivity and 2% price cream consumption.
increase in Beauty, partially offset by product mix No changes to full year guidance, but expects a ‘more
difficult market’ in Q2 vs Q1. Also anticipates less
Q2 estimate is close to 0% to 4%. No changes to Withdrew Initial guidance of 3-5% and operating Margin
competition from cash-strapped smaller players.
guidance as Q2 will be final Fiscal quarter for P&G outlook of 20%.
SK-II consumption started to rebound late Q1 in China Expected Q2 to be a difficult quarter China expected to grow double digits in Q2. Mainland
showing signs of recovery in March
Implication P&G likely to focus spend behind healthcare L’Oreal bullish on year ahead, likely to increase 7
Unilever likely to pull back investment and recalibrate
segment, particularly OTC (Vicks) and turning around investment, doubling down on e-comm and efforts to
portfolio and focus on high growth regions NA, CONSUMER HEALTH to
growth on SKII . Anticipate shifts towards e-comm bounce back in Lux, Consumer and continue
LATAM
and dialing up comms in efficacy and brand trust. invest behind Active segment.
RB, Colgate up driven by health & hygiene; Beiersdorf down
Growth driven by pantry loading of health essentials; Beiersdorf skin portfolio drive declines; Mixed views
on 2020 outlook

                                                                                                                                                                          22%
                                                                     32%

                                                                                   17%                         8%
                                    12%            11%                                                                                  7%
 Sales                                                                                                                       4%                   2%                                         -4%             -3%                  -5%

 Performance                        Total         Hygiene            OTC        Other Health       IFCN
                                                                                                    -2%        Total         NA        Latam     Europe      AP           Africa          Total            Consumer               Tesa
                                                                                                                                                            -15%
 Q1 2020 vs PY                   Total Health
                                                                                                                                                                                                              19%
J&J Q1 Performance                                       40%                                                                                                                         Consumer
Self Care +25%                        13%                                    14%
                                                                                                                                                                                       -3%         1%
                                                                                                  1%
Skin health +3.5%                                                                                                                                                                    Consumer      NA         Latam      Europe    Africa, Asia, Aus
                                   Total Health      North America         Europe/ANZ          Developing                                                                                                                                -5%
Essentials (ex Baby) ~10% Note weak 2019 Comparator across                                                                                                                                                                -7%

                               +50% | Driven by growth in both health and hygiene                             +55% | Driven by North America                                        +23% | Driven by Consumer
 eCommerce
 Q1 2020 vs PY

                                       Anticipate greater BME investment and higher                                    Q1 Advertising up +13%. Increased investment in                  Q1 Digital advertising spend up +43%
   BME                                 operating costs.                                                                NA, Europe and Africa as well as Hills division.

                                2020 Performance now expected to be better than                             The Company is withdrawing its 2020 financial guidance                 The Company is withdrawing its 2020 financial guidance.
                                original guidance, although the outlook for the balance of                  due to the uncertainty surrounding the business impacts
  Highlights &                  2020 remains uncertain. Expect to incur higher operating                    from COVID-19 and related macroeconomic volatility.
                                costs, particularly in supply chain.
                                                                                                            Expect additional volume in Q1 to impact future quarters.
  Outlook                       2B£ Investment behind Multi-year Productivity program to                    Expect government actions and economic uncertainty to
                                rebuild earnings model, drive organic revenue growth, mid-                  reduce category growth in many markets.
                                20s margin and 7-9% EPS growth.

                                                                                                             Based on guidance withdrawal, anticipate a more
   Implication                  Anticipate more aggressive investment behind OTC
                                                                                                             cautious Colgate, as they may have to evaluate their
                                                                                                                                                                                    Anticipate a cautious Beiersdorf to approach balance
                                – Mucinex, VMS and e-commerce particularly in                                                                                                       of 2020 with moderate intensity behind struggling 8
                                                                                                             pricing strategy and approach recent M&A plans with                    Nivea and LaPraire.
                                                                                                                                                                                                                CONSUMER HEALTH
                                developed markets to capitalize on trial/growth.
                                                                                                             more vigilance
GSK, Bayer and KC showing growth & profit improvement
Growth across categories with higher levels of consumer spend in health & wellness

                                                                                                                                                 14%

                                                                                                25%
                                                                                                                                                                                                                                   13%
                                                                                19%                                                                                                                 8%
                                                                14%                                                            6%                                                  6%                              6%
                                 11%             11%                                                                                                            4%                                                                                   4%
Sales                                                                                                           0%
Performance                    Total CHC         Oral            Pain           VMS          Respiratory     Digestive         Total             CHC           Pharma          Crop Science        Total         Personal        C. Tissue         KC Prof.
                                                                                                                                                                                                                  Care
Q1 2020 vs PY
                                Total CHC (Proforma growth)                                                                 Total CHC                                               22.3%        Total PC
                                                            23%                                                                                                                                                    10%
J&J Q1 Performance                                                                                                          13.5%        14.3%         13.7%
                                     11%                                                                                                                                6.1%                        6%                                                5%
Self Care +25%                                                                      6%                      8%                                                                                                                      3%
Skin health +3.5%
                                  Total CHC                 US**                  Europe**             International**     Total CHC     EMEA          NAM              APAC        LATAM
                                                                                                                                                                                                  Total PC         NAM        Emerging Markets   Australia, SK,
Essentials (ex Baby) ~10%   **Proforma growth assumption based on CER growth contribution by country                                                                                                                                              WC Europe

                            US, UK, Australia among other markets, benefited from
 eCommerce                  pantry loading in retail and e-commerce.                                                           Bayer didn’t disclose e-commerce results.                            KC didn’t disclose e-commerce results.
 Q1 2020 vs PY              GSK didn’t disclose e-commerce results.

                                      Savings are intended to be re-invested in R&D and                                          Higher marketing expenses during Q1 2020, no                        Continue to invest in brands, however some activities
  BME                                 commercial support of new products.                                                        guidance for 2020.                                                  will be temporarily pushed back.

                            Maintained guidance and outlook for 2020 and EPS                                             No revised guidance was provided on outlook. Impact of               KC is withdrawing its previous 2020 guidance of Organic
                            guidance of -1% to -4%                                                                       COVID-19 on cannot be reliably assessed at this time and will        sales +2% and temporarily suspending forward-looking
  Highlights &              Attributes 2/3 of Q1 growth to increased COVID-19 buying                                     update guidance throughout the year                                  guidance due to lack of visibility and uncertainty.
                            patterns and demand primarily for OTC & wellbeing products
  Outlook
                            Operating profit increased in CHC 26.8%, strong                                              Operating profit increased in CHC by 10.3%                            Operating Profit up by 24%, driven by organic sales
                            operating leverage partially offset by increased promotional                                                                                                       growth and cost savings from the company's FORCE
                            investment                                                                                    Note: All figures above are Fx & portfolio adjusted .                program (Focused On Reducing Costs)

  Implication               GSK likely to increase spend behind new Pain                                                 Bayer to continue to invest heavily behind Nutritionals              KC likely to continue focus on profitability and
                            launches, Allergy, Oral Care, VMS to capitalize on                                           (Berocca, One-a-day), Pain (Aleve, Aspirin) and                      lowering trade promotion.
                                                                                                                                                                                                                             CONSUMER HEALTH                  9
                            momentum, particularly behind Advil, Panadol, Voltaren                                       Allergy (Claritin).
                            and EmergeC. Comms to drive up efficacy/trust
Home Care & OTC categories driving nearly all growth for key
competitors, aside from L'Oréal where Cosmetics grew.
   Drivers
                       • Home Care (+51%)           •   Americas (+83%)        •   US (+52%)               •   Cosmetics (+27%)        • Oral, Personal, Home                     •   US (82%)
                       • Baby, Feminine, & Family   •   Home Care (+80%)       •   Pain Relief (+33%)      •   Latin America (+1%)       Care (+56%)                              •   OTC (+75%)
Overall                  Care (+29%)                •   eCommerce (+36%)*      •   International (+31%)    •   Luxe (-69%)             • Pet Nutrition (+44%)                     •   International (+18%)
(share of growth)      • eCommerce (+35%)*          •   LATAM (+3.1% price)    •   Vitamin, Mineral &      •   Western Europe (-46%)   • Latin America (+30%)**                   •   Skin Health (+10%)
                       • US (+10%)*                                                Supplements (+24%)                                  • eCommerce (+55%)*
                                                                                                                                       **Only Oral, Personal, Home Care growth
                       *% Growth YOY
                       • Home Care (+51%)           • Home Care (+80%)         • Pain Relief (+33%)        • Cosmetics (+27%)         • Oral, Personal, Home                      • OTC (+75%)
Category               • Baby, Feminine, & Family   • Beauty (+20%)            • Vitamin, Mineral &        • Luxe (-69%)                Care (+56%)                               • Beauty (+10%)
(share of growth)        Care (+29%)                                             Supplement (+24%)         • Consumer Product      (- • Pet Nutrition (+44%)                      • Oral Care (+10%)
                       • Health Care (+18%)                                    • Respiratory Health +20%     32%)
                       • US (+10%)*                 • Americas (+83%)          • US (+52%)                 • Latin America (+1%)      • Latin America (+30%)**                    • US (82%)
                       • China (-8%)*               • Europe (+17%)            • International (+31%)      • Western Europe (-46%)    • North America (+24%)**                    • International (18%)
Region                                              • Asia/AMET/RUB            • Europe (+17%)             • North America (-26%)     • Asia Pacific (-18%)**
                         *% Growth YOY
(share of growth)                                     contributed negatively                               • Asia Pacific (-25%)
                                                                                                                                        **Only Oral, Personal, Home Care growth

                       • Price (+1%) Overall    • Overall Price (-0.2%)        • N/A                       • Premium/Luxe drove - • Overall Price (+2%)           • N/A
Price/Mix              • Beauty & Grooming each • LATAM (+3.1% price)                                        69% of the growth, after • LATAM price (+6.5%)
(% growth)               took (+2%) price                                                                    +60% of the growth in Q4 • Pet Nutrition price (+4%)
                       • Health Care & Family &                                                                                       • APAC price (+1.0%)
                         Home Care (+1%) Mix

                       • eCommerce (+35%)           • eCommerce (+36%)         • N/A                       • eCommerce (+52.6%)        • Overall eCommerce                        • N/A
Channel                  (~10% of total sales)                                                                 (~20% of total sales)     (+55%)
(% growth)                                                                                                 • Travel Retail (-12%)      • Pet Nutrition eCom
                                                                                                                                         (+57%)
                    *% FY Growth YOY                                                                                                                                                  CONSUMER HEALTH        10
P&G, Reckitt, GSK have held 2020 guidance, while L'Oréal, Unilever,
& Colgate have withdrawn FY2020 guidance
• Colgate (5/1): Colgate reported Q1 organic sales increased 7.5% (+5% growth in Q4), but withdrew its 2020 financial
guidance due to uncertainty surrounding the business impacts from COVID-19 and macroeconomic volatility. Colgate
expects some of the strong Q1 volume growth to come out of future quarters, as consumers work through pantry
inventory in certain categories
• GSK (4/29): Based on their current assessment of the impact of COVID-19, GSK is maintaining their full year 2020
guidance at this time. They will update guidance as more information becomes available to inform financial
performance for the full year, if needed. GSK sales on a pro-forma basis increased +11% compared to last year.
• Unilever (4/23): Unilever withdrew prior FY 2020 guidance of 3-5%, and also withdrew their Operating Margin
outlook of 20% due to COVID-19 uncertainties, & expects Q2 to also be difficult. Unilever Q1 sales were flat compared
to last year.
• P&G (4/17): Grew +6% in Q1 (up from +5% in Q4), & has maintained its guidance for organic sales growth in the
range of 4-5% for fiscal 2020 (ending Q2). For Q2, they expect sales to fall in the minus 2% to plus 2% range as pantry
loading has shifted about 2 points of sales growth on a global basis from Q2 into Q1.
• L'Oréal (4/16): “The lack of visibility on the timing of an end to this health crisis leads L'Oréal to suspend its guidance.”
The Group reports Q1 sales declined -4.8% compared to last year. The company expects the global market to be
more difficult in Q2 compared to Q1. Goldman Sachs estimates -3.1% growth FY 2020.
• Reckitt (4/30): “2020 Performance now expected to be better than original guidance, although the outlook for the
balance of 2020 remains uncertain”
• Beiersdorf (5/5): “The Company is withdrawing its 2020 financial guidance.”
Source: Company Press Releases CONSUMER HEALTH 11Competitive Composite Central: New TEAMS site available
housing competitor performance, profiles and new news!
Includes:
✓ Summary of Quarterly
Performance
✓ One-pager Competitive
Profiles
✓ Recent news across top
competitors
For team access please contact: Laura Bueno de Greco (lbuenod@its.jnj.com)
CONSUMER HEALTH 12Appendix: Competitor Profiles
L'Oréal Overview
Strongest growth driven by Luxury, Asia Pacific, Travel Retail and e-Commerce

             2019 Summary of Performance                                         Financial Performance                                    2019 Portfolio Overview
 o L'Oréal has delivered steady growth with 2019 delivering       2015-2019 CAGR: 5.7%
                                                                                                                                J&J Comparable segments account for 52% of the
   a strong +8%;                                                                                                                    business and grew 5.4% vs total at 8.0%
                                                                                      Financial Metrics
 o Since 2016, L'Oréal has made several bolt on acquisitions,                       2016    2017     2018   2019    2020        +15.5%
   while divesting The Body Shop.                                 Net Trade Sales ($
                                                                        MM)          $28,601 $29,388 $31,825 $35,295 $36,985
                                                                   Organic Growth     4.7%    4.8%    7.1%    8.0%    3.5% +3.2%                                   +3.3%
1o Premiumizing the Portfolio: Luxe, (Lancome, Kiehls,                  GP %          75.4%   75.7%   76.6%   76.8% 76.5%
   Armani) accounting for ~40% of the portfolio, grew +14%            SG&A %        54.2%   53.9%   54.7%   54.6%   54.1%
   and drove 60% of Loreal’s growth with a high GP portfolio.        Op Prof %      17.9%   18.5%   18.5%   18.8%   19.0%
   This a segment where J&J does not have strong presence.                                                                                                                  +2.0%             +2.6%
                                                                                                                                                                                               EMEA
 o When comparing like for like segments, our share is flat vs.                                                             +13.8%                                                              total

   Loreal Consumer -.1 pts.

2o Emerging Markets: Asia, specifically China Luxe and the                             P&L Trends
   Travel Retail Channel, has delivered explosive growth,
   +25.5% in 2019. Highlighting the importance of China as a                                                                                           +25.5%
   growth platform for our Skin Health Stronghold                                                                                                                                             -0.8%

                                                                                                                              Comparable                Top Categories/Brands
3o Channel Expansion: Ecommerce grew 52% and represents                                                                       Segments
   16% of total sales – this was also heavily weighted to China
   with ecommerce accounting for 50% of the China                                                                             Consumer                  Skincare – L'Oréal Paris, Garnier,
                                                                                                                                                        Maybelline
   Business.
                                                                                                                              Active Products           Vichy, La Roche-Posay,
                                                                                                                                                                CONSUMER HEALTHCeraVe

                                                                                                                              Source: Global Finance 2020 BP Competitive Composite Analysis
P&G Overview
Pricing, Beauty expansion, and recent acquisitions step-changing growth across portfolio
2019 Summary of Performance Financial Performance 2019 Portfolio Overview
o P&Gs step-change growth in 2019 of 6% driven by pricing, 2015-2019 CAGR: 2.5%
J&J Comparable segments account for 58% of the
beauty expansion (SKII), core Fabric/Home Care growth and business and grew 6.1% vs. total 6%
recent acquisitions.
Financial Metrics +3.3%
o From 2014-16, P&G pruned portfolio to focus on brands 2016 2017 2018 2019 2020
+8.8%
that are structurally attractive and play to P&G’s strengths. Net Trade Sales ($
Significant productivity program implemented and extended MM) $65,231 $65,732 $66,912 $69,594 $71,747
Organic Growth 2.0% 1.5% 2.5% 6.0% 3.3% +2.0%
to 2022. Gains are expected to be reinvested to grow
GP % 55.0% 54.5% 53.0% 54.3% 54.9%
brands.
SG&A % 29.9% 29.1% 28.8% 28.8% 29.0%
1o Premiumizing the Portfolio: SKII continues to thrive as Op Prof % 22.2% 22.5% 21.3% 22.7% 23.1% +7.8%
prestige expansion grows, particularly in AP. SKII is estimated +7.5%
to have contributed 19% of total P&G growth. Health Care
growth driven by premiumization in Oral Care (e.g.,
Toothpastes and Devices in Crest and Oral B)
P&L Trends
2o Pricing and Mix: Price action (+1%) was taken across the
portfolio; No further price action anticipated in 2020. Regional sales not disclosed
Channel Expansion: Global e-commerce up 30%, representing
3 Relevant Top Categories/Brands
now 10% of total sales Segments
4
o Acquisitions Strategy: Assets acquired over the past 2 years Beauty & Hair – Pantene, Head & Shoulders, Skin –
Groom Olay, SKII; Grooming – Braun, Gillette, Bilie
(This is L, Walker & Co, First Aid Beauty, Native, Snowberry,
and most recently Billie ) starting to pay off. Leveraging new Health Oral Care – Crest, Oral B, Personal health –
care Prilosec, Vicks, vitamins
audiences, new technologies, new business models, new
Baby, Fem Fem Care – Always, Tampax
channels to elevate base (e.g., naturals in antiperspirants).
CONSUMER HEALTH
Source: Global Finance 2020 BP Competitive Composite AnalysisUnilever Overview
Emerging markets supporting growth; Portfolio recalibration and sustainability positioning
2019 Summary of Performance Financial Performance 2019 Portfolio Overview
o Unilever’s moderate growth within composite, driven by J&J Comparable segments account for 42% of the
2015-2019 CAGR: 3.3% business and grew 2.6% vs total at 2.9%
Home Care division and Pricing particularly across Emerging
Financial Metrics
Markets
2016 2017 2018 2019 2020
Net Trade Sales
+1.5%
($ MM) $58,352 $60,660 $60,234 $61,413 $63,532
1o Portfolio: Home care accounting for 21% of the portfolio Organic Growth 3.8% 3.1% 2.9% 2.9% 2.8% +2.6%
drove 52% of total growth. GP % 46.7% 47.2% 47.9% 48.1% 48.5%
SG&A % 28.0% 27.2% 27.1% 26.5% 26.6%
Op Prof % 16.9% 18.1% 19.1% 19.8% 20.1%
2o Emerging Markets: EM representing 60% of total sales
delivered 100% of growth in 2019, with the largest +6.1%
proportion coming from Asia Pacific.
-0.6% +5.0%
3o Pricing: LATAM saw price increases of +5% and AP saw P&L Trends
increases between 2-3%. This was offset by price decreases
in Developed markets. +2.7%
NA +0.3%
LATAM +5.1%
4o Channel Expansion: Ecommerce grew 30% and represents
6% of total sales. Digital hubs for content creation and digital
Relevant Top Categories/Brands
engagement expanded to 38 locations. Segment
Beauty/ Skin Care – Dove, Lux, Sunsilk, Simple,
Personal Vaseline, Demalogica, Living Proof, Murad
CONSUMER HEALTH
Source: Global Finance 2020 BP Competitive Composite AnalysisColgate Overview
Pricing action, Emerging Market focus and Acquisitive mode pushing into premium skincare and naturals
2019 Summary of Performance Financial Performance 2019 Portfolio Overview
o Colgate’s 4% growth demonstrates an improvement from 2015-2019 CAGR: 2.8%
J&J Comparable segments account for 66% of the
historical trajectory and was driven primarily by pricing business and grew 3.5% vs total at 4.0%
action (with Total line upgrade) as well as growth in Emerging Financial Metrics
Markets. 2016 2017 2018 2019 2020
+7.5%
Net Trade Sales
($ MM) $15,195 $15,454 $15,544 $15,693 $16,418
Organic Growth 4.0% 1.0% 0.5% 4.0% 3.9%
1o Acquisition Strategy: Recent acquisitions with Filorga, GP % 60.3% 60.5% 59.6% 59.5% 59.8%
Prestige Skin Care, and Hello, premium natural oral care, SG&A % 32.5% 33.1% 32.7% 33.4% 34.0%
illustrate that Colgate is looking to diversify its portfolio into Op Prof % 26.3% 25.5% 25.1% 24.3% 24.0% +2.3%
high growth, premium categories and expand consumer base
into naturals
+3.5%
Across Oral, Personal, Home Care
2o Pricing: Overall pricing was up +1.5% across portfolio with
10% price increase on Total Line since relaunch.
P&L Trends -1.0%
-0.03%
3o Emerging Markets: Emerging Markets accounting for 46% of
-1.1%
sales, drove 50% of the total growth. Relevant Top Categories/Brands
Segments
Oral Care Toothpaste, manual and automatic
4o Channel Expansion: e-Commerce up +30% and with Filorga
toothbrushes, Mouthwash. Colgate/ Hello.
acquisition expanding opportunities in pharmacy and Personal Liquid handsoap/ Deodorants; Professional
specialty channels. Care Skincare products. Palmolive, Softsoap, Irish
spring, Speed stick.
CONSUMER HEALTH
Source: Global Finance 2020 BP Competitive Composite AnalysisBeiersdorf Overview
Strong European presence; acquisition to broaden geographic footprint in NA
2019 Summary of Performance Financial Performance 2019 Portfolio Overview
o Beiersdorf delivered 4.1% growth with all growth 2015-2019 CAGR: 4.3%
J&J Comparable segments account for 82% of the
delivered by Consumer segment, focused primarily business and grew 4.8% vs total at 4.1%
on Skin Health. Financial Metrics
2016 2017 2018 2019 2020
o Q3-2019 Coppertone acquisition to round out Skin Net Trade Sales +0.8%
health portfolio and create opportunities to expand ($ MM) $7,474 $7,968 $8,546 $9,104 $9,104
footprint in the America Organic Growth 3.2% 5.7% 5.4% 4.1% 4.0%
GP % 62.4% 62.3% 61.1% 61.5% 61.4% +4.8%
SG&A % 44.5% 44.1% 42.8% 43.9% 43.9%
Op Prof % 15.1% 15.4% 15.4% 14.4% 14.5%
P&L Trends
Relevant Top Categories/Brands
Segments
Consumer Body Care - Nivea, Eucerin, La
Prairie, Hansaplast, Acquaphor,
Florena, Coopertone
CONSUMER HEALTH
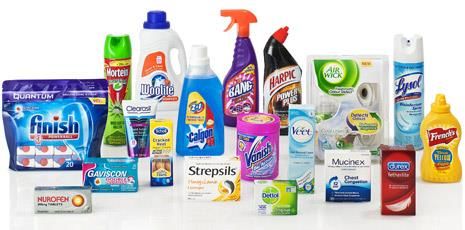
Source: Global Finance 2020 BP Competitive Composite AnalysisReckitt Benckiser
Mild growth due to dragging OTC and Vitamin business. Restructuring ahead to yield
productivity savings by 2023 but short term losses to P&L.
Summary of Performance Financial Performance Portfolio Overview
o Reckitt’s low growth of 0.8% driven by declines J&J Comparable segments account for 15% of the
in OTC (-4.4%) and Other/Multivitamins (-2.2%) 2015-2019 CAGR: 2.6% business declined -3.1% vs total at 0.8%
offset by Home and Hygiene (up +3.6%) and Financial Metrics
Infant nutrition (+2.6%). 2016 2017 2018 2019 2020
Net Trade Sales -2.2%
($ MM) $13,416 $14,830 $16,827 $17,160 $16,939
+3.6%
o Restructuring: Reckitt to invest ~ £ 2BN over the Organic Growth 3.0% 0.0% 3.0% 0.8% 1.6%
next 3 years, funded in part by a 3 year ~ £ 1.3BN GP % 61.3% 61.1% 60.6% 60.5% 60.9%
productivity savings program, to achieve ~3% LFL SG&A % 31.3% 32.3% 32.2% 32.6% 36.5%
Op Prof % 28.4% 27.1% 26.7% 26.2% 22.7%
sales growth and 7-9% EPS growth by 2023. The
remaining investment will be a direct hit to the -4.4%
P&L resulting in a loss of 350 bps in 2020
operating profit margin. +2.6%
P&L Trends
Relevant Top Categories/Brands
Segments
OTC Nurofen, Gaviscon, Mucinex
Notes: Excludes IFCN (infant formula and child nutrition,
and Other (Multivitamins and other)
Source: Global Finance 2020 BP Competitive Composite AnalysisGSK Overview
Consistent historical growth driven by Oral Care; New Pfizer JV positioning for incremental growth
in wellness and expansion in Emerging Markets
2019 Summary of Performance Financial Performance 2019 Portfolio Overview
o GSK has historically delivered consistent organic growth J&J Comparable segments account for 87% of the
2015-2019 CAGR: 3.4% on an adjusted basis
GSK business and grew 2.0% vs total at 2.0%
of 2% driven primarily by Oral Health with brands like
Financial Metrics
Sensodyne, Paradontax, Pro-namel.
2016 2017 2018 2019 -5%**
o However growth trajectory likely to change given GSK Net Trade Sales ($ MM) 9,756 9,984 10,229 12,015 0%
Pfizer Merger Joint Venture on August 1, 2019. Organic Growth 5.0% 2.0% 2.0% 2.0%
R&D % 3.4% 3.0% 3.1% 3.0%
1o Restructuring: GSK announced start of a new 2-year Op Prof % 15.5% 17.7% 19.8% 20.8%
0%
program called “Future Ready” to prepare GSK for the
separation into 2 new leading company – one in
biopharma and one in consumer healthcare. Intention
remains to separate company in 3 years.
+7.0% +15% +36%
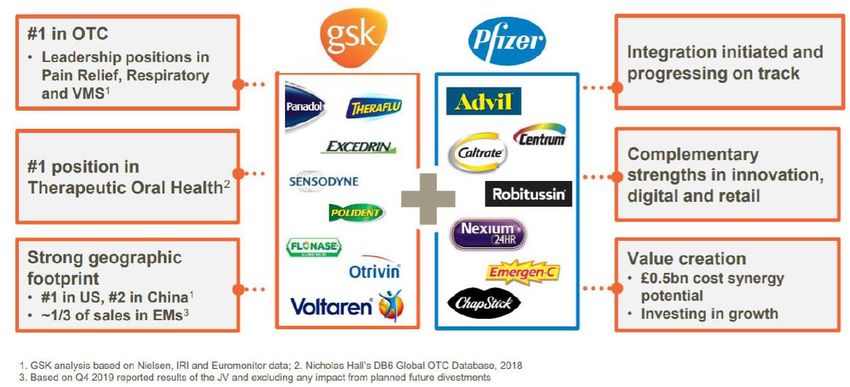
2o Net proceeds: GSK/Pfizer targeting 500MM GBP in Brands & Assets APAC & LATAM
grouped
synergies and will reinvest up to 25% in capabilities and
portfolios. JV is expected to generate about $1B in net
proceeds from disposal of tail brands. **Pro-Forma growth rates given GSK Pfizer
Merger Joint Venture on August 1,
3o Portfolio: Newly acquired brands through JV could better 2019. CER growth rates: Wellness (14%),
Oral Health (7%), Nutrition (81%), Skin
position GSK to pursue opportunities vs. our Self Care health (7%). Skin health up due to addition
of Chapstick but pro-forma declines due to
business: Advil, Robitussin, Centrum, Emergenc-C divesture of small tail brands in US/UK.
CAGR (on an adjusted basis) 3.4% +6.0%
4
o Geography: North America was key driver of pro-forma Relevant
Top Categories/Brands
growth (36% of growth); followed by LATAM/AP (14% Segments
growth). New operating structure will give them greater Oral Health Parodontax, Sensodyne, Pro-namel
latitude for growth in EM. Self Care Panadol, Excedrin, Advil, Flonase, Advil,
Centrum, Robitussin, Emergen-C
Source: Global Finance 2020 BP Competitive Composite AnalysisYou can also read