ENVIRONMENTS GROWING UP IN? - WHAT KIND OF ARE QUÉBEC'S YOUNGEST CHILDREN - Observatoire des tout-petits
←
→
Page content transcription
If your browser does not render page correctly, please read the page content below
WHAT KIND OF

ENVIRONMENTS
ARE QUÉBEC’S YOUNGEST CHILDREN

GROWING UP IN?
        2019 Portrait • Estrie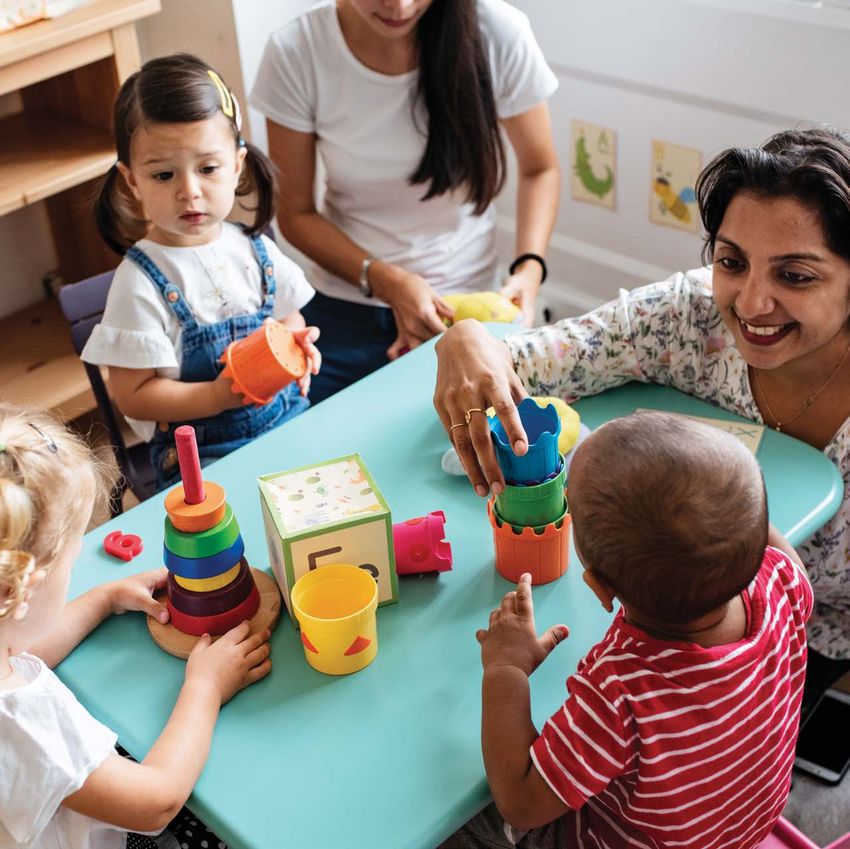
The contents of this publication were prepared and edited by the Early Childhood Observatory
(Observatoire des tout-petits), a project of the Lucie and André Chagnon Foundation.

This document is available online in the Publications section of the website of the Observatory
at tout-petits.org/Portrait2019.

Project team
DIRECTION
Fannie Dagenais
PRODUCTION COORDINATOR
Mathieu Bégin
RESEARCH
Kathleen Couillard and Catherine Dea
WRITING
Kathleen Couillard, Mathieu Bégin and Marilou Denaul

LINGUISTIC REVISION
Jonathan Aubin
ENGLISH TRANSLATION
Cynthia Gates
GRAPHIC DESIGN AND LAYOUT
gbdesign-studio.com
ADAPTATION – ONLINE CONTENT
Alexandre Gosselin
DISTRIBUTION
Marilou Denault and Elise Tardif-Turcotte

WE WISH TO THANK EVERYONE WHO PARTICIPATED IN THE REVISION OF THIS DOCUMENT:
Caroline Bouchard                                 Alexandre Morin
Université Laval                                  Ministère de la Santé et des Services sociaux
Julie Brousseau                                   du Québec
CHU Sainte-Justine                                Virginie Nanhou
Lucie Champagne                                   Institut de la statistique du Québec
Association Québécoise des CPE (AQCPE)            Roseline Olivier-Pilon
Hélène Desrosiers                                 Institut national de santé publique
Institut de la statistique du Québec              du Québec
Amélie Lavoie                                     Julie Poissant
Institut de la statistique du Québec              UQAM
Isabelle Lizée                                    Kevin Rousseau
Carrefour municipal action                        Ministère de la Famille du Québec
Andréane Melançon                                 Ana Claudia Silva
Institut national de santé publique               Ministère de la Famille du Québec
du Québec                                         Julie Soucy
                                                  Ministère de la Santé et des Services sociaux
                                                  du Québec

FOR THE ESTRIE REGION:
Natalie Stronach                                  Mélissa Généreux
CIUSSS de l'Estrie – CHUS                         CIUSSS de l’Estrie – CHUS
Sophie Gagnon
CIUSSS de l’Estrie – CHUS
The opinions expressed in this document are those of the authors and do not necessarily
represent those of the organizations that participated in the revision.
Reproduction of excerpts from this document is authorized for non-commercial purposes
provided the source is acknowledged. Any partial reproduction must be faithful to the original.

To cite this document:
Early Childhood Observatory (2019). What kind of environments are Québec’s youngest children
growing up in? 2019 Portrait. Estrie. Montréal, Québec, Lucie and André Chagnon Foundation

Distribution
Observatoire des tout-petits
Lucie and André Chagnon Foundation
2001 McGill College Avenue, Suite 1000
Montréal QC H3A 1G1
Telephone: 514-380-2001
info@toutpetits.org © Lucie and André Chagnon Foundation

Legal deposit (PDF) – 1st quarter 2020
Bibliothèque et Archives nationales du Québec
Library and Archives Canada
ISBN: 978-2-924875-59-9 (PDF)
TABLE OF
        CONTENTS

 5 6 7
  MESSAGE FROM
  THE DIRECTOR
                          A PORTRAIT
                      OF THE VERY YOUNG
                          IN QUÉBEC
                                            THE ESTRIE REGION

 8 10 24
 WHO ARE THESE
 0-5 YEAR-OLDS?
                        WHAT DO THEIR
                      FAMILIES LOOK LIKE?
                                               WHAT KIND OF
                                              ENVIRONMENTS
                                            ARE THEY LIVING IN?

   30                   WHAT KIND OF
                    EDUCATIONAL CHILDCARE
                      FACILITIES ARE THEY
                         ATTENDING?

36 41 43
    HOW THE
  ESTRIE REGION
 COMPARES WITH
QUÉBEC AS A WHOLE
                         CONCLUSION            REFERENCES

MESSAGE FROM
             THE DIRECTOR

In 2018, there were a little over 530,000 children between the ages of 0 and 5 living in
Québec. There was Léo, who’s going to be a firefighter when he grows up, Charlie, who
wants to be a magician, Alice, who’s dreaming of being an explorer, Jacob, who can’t
decide whether he wants to be an inventor or a veterinarian…. and hundreds of thousands
of others. These children are the future of Québec.

Unfortunately, not all young children in the province are beginning at the same starting
line. Some are living in difficult economic conditions—even to the point of food insecurity.
Others are growing up in homes that are too small or too expensive for their parents to
afford, in neighbourhoods where they don’t always feel safe. Some are unable to obtain a
space in an early childcare facility, while others are attending educational daycares of less
than acceptable quality.

The conditions that young children grow up in have a deciding influence on their
development. For example, at age 3, children in disadvantaged neighbourhoods know 600
fewer words than their counterparts in more privileged communities. Such developmental
gaps can have an influence on their academic results in primary school and high school—
even in studies at an adult age.

As a society, it is essential that we concern ourselves with the environments in which
young children are growing up. For this 2019 portrait of the youngest Quebecers, we
have compiled the most rigorous data available to us on the subject, including potential
solutions drawn from the scientific literature and experience on the ground. We hope this
document will help to inform the debate and spark discussions on what we as a community
can do in Québec to make sure every child gets the best possible start in life.

Fannie Dagenais                                           Fannie Dagenais at 5 years old

                                             5
A PORTRAIT OF
     THE VERY YOUNG
       IN QUÉBEC
Created in April 2016, the Early Childhood Observatory is a project of the Lucie and
André Chagnon Foundation. Its mission is to help ensure that the development and
well-being of Quebec’s very youngest children remains at the top of Québec society’s
list of social priorities.

To fulfill this mission, the Observatory compiles the most reliable and relevant data
on children between the ages of 0 and 5, produces special reports and encourages
dialogue on possible collective action in the area of early childhood. The Observatory’s
activities revolve around two fundamental questions:

                HOW ARE QUÉBEC’S YOUNGEST CHILDREN FARING?
                                          and
            WHAT KIND OF ENVIRONMENTS ARE THEY GROWING UP IN?

The 2019 portrait returns to the second question in order to assess how children’s
environments have evolved in Estrie since the publication of the Observatory’s first
portrait on the same theme in 2016 and, more broadly, in the past 10 years.

The data presented in this portrait are drawn from administrative, census and population
survey documents. We were unfortunately unable to cover certain characteristics
of children’s environments as they are not all measured in surveys or stored in
administrative data banks.

The 2019 edition of the annual portrait of the youngest Quebecers therefore presents
the most rigorous data available to us on the living conditions of very young children
and their families in Estrie. The information it contains gives us a better understanding
of young children’s current family and physical environments and of the educational
childcare facilities they are attending. We have also included several potential solutions
drawn from the scientific literature and experience on the ground.

                                            6
THE
                       ESTRIE REGION
                                                        Key points*

SUMMARY OF DIFFERENCES AS COMPARED TO THE WHOLE OF QUÉBEC*
  The Estrie has a lower proportion of children born into families in which
u
  at least one parent was born outside of Canada.
  In 2016-2017, the proportion of kindergarteners who spoke French (possibly
u
  in addition to another language) at home was higher in Estrie than in the
  rest of Québec.
  The proportion of children between 0 and 5 living in low-income families
u
  is lower in Estrie than in the rest of Québec.
  The proportion of kindergarteners who were under one year of age when they
u
  entered childcare on a regular basis was higher in Estrie than in the rest of Québec.
  The proportion of kindergarteners who had visited a library less than once a month
u
  with an adult in their household during the year before they started school was
  higher in Estrie than in the rest of Québec.

CERTAIN ASPECTS OF THE PORTRAIT OF THE VERY YOUNG IN ESTRIE
HAVE EVOLVED OVER THE PAST FEW YEARS:
  In recent years, the number of births in the region has been on the decline.
u
  Between 1996 and 2016, the proportion of children living in urban
u
  areas increased.
  Since 2004, the proportion of children between 0 and 5 living
u
  in low-income families has declined.
  Between 2001 and 2016, the employment rate of fathers of children
u
  between 0 and 5 dropped slightly, while that of mothers rose.

*The indicators mentioned in this section were chosen because the region stood out from the rest of the province in these areas.

                                                                      7
WHO ARE THESE
0-5 YEAR-OLDS?

         88
In 2018,
                                                                       there were

                                                                     19,569
                                                                       children between the ages of 0 and 5
                                                                       living in Estrie, accounting for 6.0%
                                                                       of the total regional population.
                      6.0%                                             In 2008, the corresponding figure was
                                                                       18,243, accounting for 6.0% of the total
                                                                       regional population.

                                                                       In 2018,

                                                                       3,042
                                                                       births were recorded.
                                                                       This figure is down 8.2% from 2008, when
                                                                       3,312 children were born in the region.

Sources: Institut de la statistique du Québec and Statistics Canada, Population estimates, adapted by the Institut de la statistique du Québec.
Registre des événements démographiques. Provisional data for 2018.

                                                                         9
WHAT DO THEIR FAMILIES LOOK LIKE?
Since the family constitutes the first and
           primary source of stimulation to which children
          are exposed2, the family environment has a critical
              influence on early childhood development.

ENVIRONMENT AT BIRTH
Use of the Québec Parental
Insurance Plan

    Parental involvement during the first years of a child’s life has a significant
    influence on their development. Taking advantage of parental leave is therefore
    a significant social measure that allows parents to contribute to their child’s
    healthy development and lay the foundation for a positive work-family balance2.

                                In 2018,

                                 4,798        new parents in Estrie benefited from
                                              the Québec Parental Insurance Plan (QPIP)
                                (Régime québécois d'assurance parentale or RQAP).
                                In 2008, that number was 4,892.
                                Source: Ministère du Travail, de l’Emploi et de la Solidarité sociale, Statistiques officielles sur les prestataires
                                du Régime québécois d’assurance parentale, 2008-2018.

Data compiled on the parents of
children born in Canada who were                                             Number of beneficiaries of the Québec
attending kindergarten in 2016-2017                                          Parental Insurance Plan (QPIP) in 2018
allowed researchers to calculate the
proportion of children in the region
whose mother, father or both parents                                                                    24.4%
took advantage of paid parental leave                                               10.3%*
                                               11+2465A
under the QPIP after the birth of their                                                                                             Mother or
                                                                                                                                    father only
child (i.e., in 2010-2011).
                                                                                                                                    Neither parent
* Passable accuracy. Coefficient of variation between
   15% and 25%: interpret with caution.                                                                                             Both parents
Source: Institut de la statistique du Québec, 2017 Québec
Survey on the Preschool Path of Kindergarten Students.
                                                                                                 65.3%

                                                                         11
Time spent at home
after a child’s birth or adoption
Among children in the region who were
attending kindergarten in 2016-2017, 60.6% 66.9%
66.9% had a mother who had stayed
at home for 11 months or more
after their birth, and 60.6% had a father who
stayed at home for 5 weeks or more.
5 weeks or + 11 months or +
Distribution of kindergarteners based on the amount of time their mothers
stayed at home after they were born
50%
40%
30%
20%
10%
5.3* 27.9 35.4 12.9 18.6
0%
Under 6 months** 6–11 months 11 months–1 year 1–3 years 3 years or more
Distribution of kindergarteners based on the amount of time their fathers
stayed at home after they were born
50%
40%
30%
20%
10%
0%
15.2 24.2 29.2 14.3 17.1
No leave 1–4 weeks 5–6 weeks 1.5–6 months 6 months or more
* Coefficient of variation between 15% and 25%: interpret with caution
** The “Under 6 months” category includes children whose mother did not take any parental leave.
Source: Institut de la statistique du Québec, 2017 Québec Survey on the Preschool Path of Kindergarten Students.
12FAMILY CHARACTERISTICS
Siblings
In 2016, the youngest children in Estrie were living in families with:
1 child 2 children 3 or more children
22.7% 46.6% 30.7%
Source: Statistics Canada, 2016 Census, adapted by the Institut de la statistique du Québec.
Separation and family structure
According to data from the 2017 Québec Survey on the Preschool Path
of Kindergarten Students, children in kindergarten who are not living with
both their parents (biological or adoptive) are at greater risk of vulnerability
in at least one area of development than their classmates who are living with
both parents3. Similar results were observed in the Québec Longitudinal Study
of Child Development for children whose parents had separated within the
two years before they started school4.
21.6% of children attending kindergarten in 2016-2017
were not living with both their parents*.
* This percentage includes children living in families where the “separation” was the result of the death of one of their parents.
Source: Institut de la statistique du Québec, 2017 Québec Survey on the Preschool Path of Kindergarten Students.
13In 2016, young children in Estrie were living in…
14+1274y
Intact
family
Family in which
all children are
the biological
and/or adopted
children of both
members of
the couple.
74.5%
11.6%
13.8%
Single-parent
family
Family made up
of a single parent
(father or mother)
living with one or
more biological or
adopted children.
Step-family or blended family
Family in which at least one of the children is not the
biological/adopted child of at least one parent.
Source: Statistics Canada, 2016 Census, adapted by the Institut de la statistique du Québec.
Languages spoken at home
The languages to which children are exposed at a very young age may have
an influence on their development. For example, receiving an education in
a language other than their mother tongue increases children’s probability
of vulnerability in certain areas of development, particularly those related
to communication skills5. Children exposed to several languages may have
more difficulty understanding vocabulary (in French or English) at the
beginning of the school years than their peers6.
It is important to stress, however, that exposure to several languages can
also have positive long-term effects on children’s educational success and
academic perseverance7.
14In 2016-2017,
92.1% of kindergarteners in Estrie spoke French
at home (with or without the addition
of another language), while 4.6%** spoke English but
not French (with or without the addition of another
language). The mother tongue (and sole language
spoken at home) of 3.3% of children was neither
French nor English.
** Poor accuracy: coefficient of variation > 25%. Provided for information purposes only.
Source: Institut de la statistique du Québec, 2017 Québec Survey on the Preschool Path of Kindergarten Students.
PARENTS’ CHARACTERISTICS
Parents living with a physical or
mental disability or chronic health problem
Parents with chronic health problems may have less energy and above-average
stress levels. As a result, they may be less able to participate in certain activities
with their child, which could affect the child’s development. According to the
2017 Québec Survey on the Preschool Path of Kindergarten Students, the proportion
of vulnerable children in kindergarten is higher among those who have at least
one parent living with a disability or chronic health problem that could limit
their ability to provide care and support for their child8.
4.1%* of children attending kindergarten in 2016-2017 in Estrie were
living in a family in which at least one of their parents or their
only parent was living with a physical or mental disability or a chronic
health problem that could somewhat limit their ability to provide certain
types of care for their child.
* Coefficient of variation between 15% and 25%: interpret with caution.
Source: Institut de la statistique du Québec, 2017 Québec Survey on the Preschool Path of Kindergarten Students.
15Mother’s age at birth
The scientific literature tells us that a young parental age (under 20) is
associated with more behaviour problems in young children9. The younger
the mother, the greater her child’s risk of overall developmental vulnerability10.
6.8 out of every 1,000 young women under 20 gave
birth in 2018. In 2008, the corresponding figure
1,000 was 12.1 out of 1,000.
Fertility rate for women under 20 years of age between 2008 and 2018
(for every 1,000 women)
12 12.1 12.6
11.9
10.9 11.4
10.2
8 7.3 8.6 7.8
6.6 6.8
4
0
2008 2009 2010 2011 2012 2013 2014 2015 2016 2017 2018*
* Provisional data
Source: Institut de la statistique du Québec, Registre des événements démographiques.
Immigration
Proportionally speaking, more children born outside of Canada now living
in Québec are vulnerable in at least one area of development than are their
counterparts who were born in Canada. Furthermore, the proportion of
kindergarteners who are vulnerable in at least one area of development is higher
among children whose parents (or sole parent) were born outside of Canada11.
Proportion of babies born between 1998 and 2008
In Estrie in 2017,
15.2%
with at least one parent who was born abroad
15.2% of newborns
had at least one 20%
15.2
parent who was 11.0
10% 8.7
born abroad. This proportion has
been on the rise since 1998. 0%
1998 2008 2017
Source: Institut de la statistique du Québec,
Registre des événements démographiques.
16In 2016, in Estrie,
1.79%
Proportion of young children whose parents
of children
have been living in Canada for under 5 years
between 0 and 5
2,5%
had parents who had been 2.21
living in Canada for under 2,0% 1.79
5 years. After increasing 1,5% 1.37
between 1996 and 2006, 1,0% 0.92
this figure declined in 2016. 0,5%
0%
In 2016, 320 children between 0 and 5
1996 2001 2006 2016
living in Estrie were born outside of
Canada, accounting for 1.59% of all
children in that age group in the region.
Sources: Statistics Canada, 1996, 2001, 2006 and 2016 Censuses, adapted by the Institut de la statistique du Québec,
and the Institut de la statistique du Québec, Registre des événements démographiques.
Education
According to the 2017 Québec Survey on the Preschool Path of Kindergarten
Students, the proportion of children who are vulnerable in at least one area
of development decreases as their parents’ level of education rises12.
In 2018,
6.2% of all babies born in Estrie were born to
mothers who had not finished high school.
Source: Institut de la statistique du Québec, Registre des événements démographiques.
Proportion of babies born in 2008, 2013 and 2018 to mothers
who had not finished high school
15%
10.0 11.5
10%
6.2
5%
0%
2008 2013 2018
17The majority of
children attending
kindergarten in
Estrie in 2016-2017
had at least
one parent with a college or
university diploma.
44+52823y 5.1%*
Highest diploma obtained
by at least one parent
27.5% No diploma
High school
diploma
* Passable accuracy. Coefficient of variation
College
between 15% and 25%: interpret with caution. 22.9% diploma
Source: Institut de la statistique du Québec, 44.5%
2017 Québec Survey on the Preschool Path
University
of Kindergarten Students.
diploma
Employment
In 2016,
71.3% of families in Estrie with at least one child 5 years of age
or under included two parents (or a sole parent, in the case
of single-parent families) who were/was employed, while 10.4% had
no parent with paid employment.
Development in the rate of employment between 2001 and 2006 for fathers
and mothers of children between 0 and 5 is shown below.
Rate of employment of fathers and mothers with at least
one child 5 or under in 2001, 2006 and 2016
2005
Father employed Mother employed
100%
80%
60%
40%
20%
90.1 89.4 88.5 69.2 69.6 75.5
0%
2001 2006 2016 2001 2006 2016
Source: Statistics Canada, 2001, 2006 2016 Censuses, adapted by the Institut de la statistique du Québec.
18Income and poverty
Studies show that children growing up in low-income households are
considered to be more vulnerable by their kindergarten teachers when they
start school and that they obtain below-average academic results in grade one13.
Under
$69,820 The 2015 household income of half of families in Estrie
with at least one child under 5 was under $69,820 after taxes.
In 2005, that amount was $55,876 (adjusted for inflation).
Source: Statistics Canada, 2006 and 2016 Censuses, adapted by the Institut de la statistique du Québec.
of children between 0 and 5 in Estrie were living
12.4% in a low-income (before tax) family in 2016*, accounting
for about 2,470 young children. Over the past few years,
however, this figure has been on the decline.
Proportion of Québec children between 0 and 5 living
in low-income families between 2004 and 2016
20%
10%
18.6 15.3 12.4
0%
2004 2011 2016*
* Low income rate based on the low-income measure
Source: Statistics Canada, T1 Family File (T1FF), adapted by the Institut de la statistique du Québec.
19Difficulty with daily activities
and social support
Parents with good social networks find it easier to balance their daily
obligations. Kindergarteners living in families with poor social support are
more likely to be developmentally vulnerable14.
Among parents of children attending kindergarten in 2016-2017…
21.7% said they had difficulty
accompanying their
children to their activities.
11.4% found it difficult to
prepare their children
for the day (i.e., making sure they
had enough to eat and were
appropriately dressed).
25.2% found it difficult to find time
to play with them.
For comparative purposes,
the corresponding figure for
the whole of Québec is 26.1%.
Source: Institut de la statistique du Québec,
2017 Québec Survey on the Preschool Path
of Kindergarten Students.
These data are worrying, as playing with their children helps parents create
and maintain a bond with them and stimulate their development.
20A large number of parents of kindergarteners have good social
support networks, however.
Among parents of children attending kindergarten in 2016-2017…
94.1% had someone
they trusted whom
they could turn to for advice if they
96.5% said they had people
they could count on
in an emergency.
had problems.
89.9% said that their family
and friends helped them
feel safe, secure and happy.
Source: Institut de la statistique du Québec, 2017 Québec Survey on the Preschool Path of Kindergarten Students.
21PARENTING PRACTICES
Parenting practices that encourage
literacy and numeracy
Several studies have shown that parents have an important role to play
in sparking their child’s interest in reading and writing15. Talking to children
while reading out loud or looking at pictures with them helps reduce the
probability they will be seen as vulnerable in kindergarten, particularly
in the area of “Communication skills and general knowledge16.
During the year before children in kindergarten in 2016-2017 started school…
44.0% had been read to or told
stories every day by an adult
in the household.
16.5% had
practised
saying or recognizing the
18.5% had
practised
saying or recognizing
letters of the alphabet their numbers every
every day with an adult day with an adult in
in the household. the household.
27.3% had been
encouraged to use
numbers in their daily activities
44.0% had visited
the library at least
once a month with an adult
every day. in the household.
Source: Institut de la statistique du Québec, 2017 Québec Survey on the Preschool Path of Kindergarten Students.
22SOMETHING CAN BE DONE
There are many possibilities for collective action that could improve the family
environments of young children—solutions that have been shown to be effective
in practice on the ground and in the scientific literature both in Québec and around
the world. Here are a few examples:
Offering parents of young children, including those who work atypical
hours17, work-life balance measures is one way to help reduce parental
stress. New measures could also be explored, such as allowing parents
more flexible conditions when returning to work after a parental leave
(working part-time, more paid days off for family responsibilities, flexible
hours, working from home, etc.).
Adopting strategies that integrate fathers into all policies, services and
programs designed to benefit families with young children can increase
fathers’ involvement in their children’s education18. That is exactly what
Québec’s Regroupement pour la Valorisation de la Paternité19 promotes.
Developing parental support programs and services aimed specifically
at fathers helps them play a more active parental role, starting with their
partner’s pregnancy. Recognizing the importance of extended paternity
leave and encouraging fathers to take advantage of it also helps fathers
play a more active parental role. As things currently stand in Québec,
certain professional milieus are still reticent about the idea of men taking
parental leave20. Such a measure would promote a more equitable sharing
of parents’ work at home, however, while strengthening fathers’ feeling
of parenting competence21.
Action can be taken to improve the unfavourable economic conditions
of some young children’s families by providing financial support for
financially disadvantaged families, focusing on regions or neighbourhoods
with large numbers of low-income households. This type of assistance
would also help to fight food insecurity.
Promoting the Alcochoix + program among fathers could help those
whose alcohol consumption prevents them from playing their role as
a parent (low energy, poor concentration, aggressivity)22. The efficiency
of similar programs has already been proven23. Restricting the privatization
of retail alcohol sales as much as possible reduces parents’ at-risk alcohol
use, especially that of fathers, as it limits easy access to various types of
alcohol at convenience and grocery stores24.
Some of these measures have already been implemented in Québec.
They need to be maintained and consolidated to safeguard the progress
that has been made in this area.
How could these measures be more effectively applied? What else can be done?
We hope this portrait of the situation will spark public reflection on
these questions.
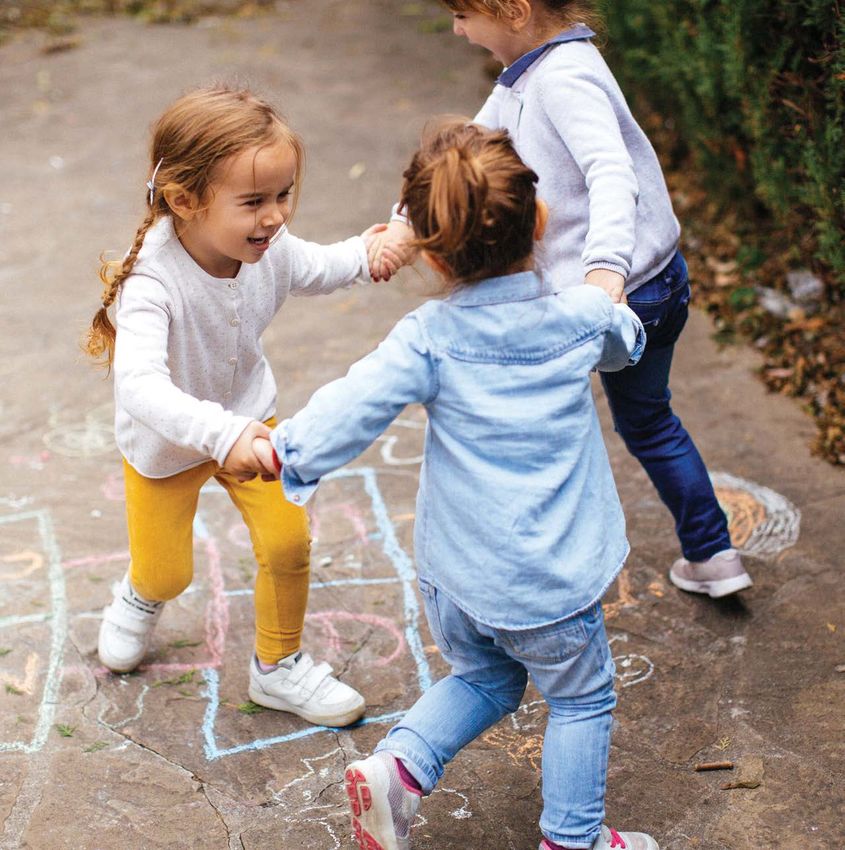
23WHAT KIND OF ENVIRONMENTS ARE THEY LIVING IN?
The environment children grow up has
             an impact on their development. Having access
               to high-quality physical spaces gives them
                  the opportunity to explore and learn.

CHARACTERISTICS OF
THE RESIDENTIAL ENVIRONMENT
Urban or rural?
In 2016,

68.8%         of very young children in
              Estrie lived in urban areas
and 31.2% in rural areas in 2016. The
proportion of children living in urban
areas increased between 1996 and 2016.

                Proportion of very young children in Estrie living in urban areas
     100%
      90%
      80%
      70%
      60%
      50%
      40%
      30%
      20%
      10%
                            60.7                           63.3                          68.8
       0%
                            1996                            2006                         2016

Source: Statistics Canada, 1996, 2006 and 2016 Censuses.

    URBAN AREA                                                     RURAL AREA
    Area consisting of one or more                                 Cities and municipalities
    neighbouring municipalities situated                           located outside of major
    around a major urban centre. A census                          urban centres.
    metropolitan area must have a total
    population of at least 10,000.

                                                           25
                                                           25
Deprivation
Children living in higher-income neighbourhoods have better verbal skills and
fewer behaviour problems25. According to the QLSCD, those children are less
likely to have trouble handling the demands of an academic environment than
their counterparts in less privileged neighbourhoods26.
Children who live in disadvantaged neighbourhoods are at greater risk of being
exposed to various pollutants, excessive noise, overcrowded housing and
sub-standard housing27. Studies done in 1975 and 2005 even show a connection
between neighbourhood socio-economic levels and child maltreatment28.
In 2016,
22.4% of very young children in Estrie were living in
neighbourhoods considered to have the greatest
material deprivation. The corresponding figure for the whole
of Québec was 20.4%
Proportion of children living in neighbourhoods considered
to be the most materially disadvantaged in 2016
50%
40%
30%
20%
10%
0%
22.4 20.4
Region of Estrie All of Québec
Source: Statistics Canada, 2016 Census, adapted by the Institut de la statistique du Québec.
The Material Deprivation Index is a is a geographical index based on the proportion of
individuals without a high school diploma, the employment/population ratio, and the
average income of individuals over age 15 in a given residential area29.
Neighbourhood safety
Living in a safe neighbourhood with strong social cohesion—little conflict and
a strong culture of mutual assistance—can be beneficial for the development
and well-being of very young children30.
26In 2016, according to their parents,
88.7% of kindergarteners in Estrie
were living in a neighbourhood
where it was safe to walk alone after dark.
95.5% of kindergarteners
in Estrie were living
in a neighbourhood where it was
87.5% of kindergarteners
in Estrie were
living in a neighbourhood where
safe to play outside during the day. there were safe parks, playgrounds
and other places to play.
However,
13.1% of kindergarteners in Estrie were living in a
neighbourhood that their parents considered to be less
than safe. This figure is comparable to that for the rest of Québec.
Source: Institut de la statistique du Québec, 2017 Québec Survey on the Preschool Path of Kindergarten Students.
RESIDENTIAL CHARACTERISTICS
Housing
The type of housing young children live in can influence their development.
For example, high housing costs increase the risk of experiencing food
insecurity and stress, both of which have a negative impact on development.
Living in inadequate housing makes young children more vulnerable to
developing cognitive, language or socio-affective disorders31.
There is also a connection between housing characteristics and the risk
of child maltreatment. Studies have revealed a link between housing
characteristics (such as noise, overcrowding, numerous comings and goings)
and the quality of parent-child verbal interaction, parental sensitivity and
feelings of parental competence32.
27In 2016, among families in the region with at least one child between 0 and 5:
10.0% were
living
in unaffordable housing.
6.1% were
living
in a dwelling of
7.8% were
living
in housing that needed
unsuitable size. major repairs.
Housing is considered to
be unaffordable if it costs A dwelling is considered This category includes
more than 30% of the to be of suitable size if housing with defective
total household income it has enough rooms to plumbing or wiring, or that
(before taxes). accommodate the needs requires structural repairs to
of the household based the walls, floors or ceilings.
on size and composition*.
* Based on National Occupancy Standard (NOS) requirements.
Proportion of families based on type of housing
20%
15% 17.0
13.4
10% 9.9
10.0
9.1
9.2 7.8
5% 8.3
6.1
0%
2001 2006 2016
Housing requiring major repairs Housing of insufficient size Unaffordable housing
Source: Statistics Canada, 2001, 2006 and 2016 Censuses, adapted by the Institut de la statistique du Québec.
Moving house
Frequent moves during early childhood are associated with emotional and
social difficulties33. The proportion of children considered to be vulnerable in
at least one area of development was higher among children whose parents
had moved house twice or more during the five years preceding the study
than those who had moved once or less.
It is important to clarify that moving can also be associated with another
potentially stressful event for a child, such as parents separating, family
reorganization or the arrival of a new baby34.
2 X or + In 2016-2017, the parents of 19.6% of children attending 5-year-old
kindergarten had moved at least twice in the previous 5 years.
Source: Institut de la statistique du Québec, 2017 Québec Survey on the Preschool Path of Kindergarten Students.
28SOMETHING CAN BE DONE
There are many possibilities for collective action that could improve the physical
environments of young children—solutions that have been shown to be effective
in practice on the ground and in the scientific literature both in Québec and
around the world. Here are a few examples:
Providing financial support for economically disadvantaged families
would help to improve young children’s living conditions, particularly when
support is focused on regions or neighbourhoods with large numbers of
low-income households35. Investing in programs that provide affordable
housing for families offers young children safe, supportive communities
to live in while improving families’ financial situations and reducing food
insecurity. Increased rent supplements and more housing cooperatives
would be equally beneficial 36. Stricter penalties for landlords who fail
to respect housing sanitation regulations would improve young children’s
living environments. It would also help economically vulnerable families37
that are often forced to move frequently, which can affect the stability that
is necessary for healthy development in childhood38.
Creating safe, accessible playgrounds in municipalities of all sizes
would effectively improve the physical environments that young
children are growing up in, particularly if the characteristics of different
neighbourhoods are taken into account (rural, suburban, urban) and the
general public is informed of the type and location of the playgrounds39.
Municipals programs like Prendre soin de notre monde promote the
development of healthy environments that improve families’ quality of
life in Québec municipalities40. The city of Belœil’s Dans ma rue, on joue
initiative is another concrete measure that encourages children to get
outside and play, especially in urban neighbourhoods.
Some of these measures have already been implemented in Québec.
They need to be maintained and consolidated to safeguard the progress
that has been made in this area.
How could these measures be more effectively applied? What else can be done?
We hope this portrait of the situation will spark public reflection on
these questions.
2929WHAT KIND OF
EDUCATIONAL
CHILDCARE FACILITIES
ARE THEY ATTENDING?
30Several studies have shown that attending
a high-quality educational childcare facility
during early childhood can have positive
effects on young children’s development41.
USE OF EDUCATIONAL
CHILDCARE SERVICES
Attendance of recognized
childcare services
56.2% of children under 5 living in the Estrie
region in 2105 attended a childcare facility
recognized by the Ministère de la Famille, either a CPE
(publicly funded childcare centre), daycare (subsidized
or not) or family daycare. This figure was 55.9% in 2006.
In 2015, children attending a recognized childcare facility
were distributed as shown in the table below.
41+6+548y
Proportion of children under 5 who were attending
a recognized childcare facility in 2015
CPE
Subsidized daycare
48.0% 42.0%
Unsubsidized daycare
Family daycare
5.2% 4.7%
Sources: Ministère de la Famille, Rapport d’activités annuel des services de garde 2005-2006 à 2014-2015, and the Institut de la statistique du Québec,
Estimation de la population québécoise des moins de 5 ans au 1er juillet de l’année mentionnée, dérivée au 1er avril par le ministère de la Famille.
31Studies have shown that children in disadvantaged neighbourhoods have
much to gain from attending high-quality educational childcare facilities42.
In the Estrie region,
92.0% of children in kindergarten
in 2016-2017 had been in
some kind of regular childcare for at least
three months before starting school.
For 57.8% of children in the region who were not in some kind
of regular childcare before the age of 5, one of the reasons was one
parent choosing to stay home.
Source: Institut de la statistique du Québec, 2017 Québec Survey on the Preschool Path of Kindergarten Students..
Age when children start attending
a childcare facility
According to the results of the 2017 Québec Survey on the Preschool Path of
Kindergarten Students, children who began attending a childcare facility after
age 3 were more likely to be vulnerable in the areas of “Physical health and
well-being” and “Communication skills and general knowledge” than were their
peers who entered daycare on a regular basis before they were 12 months old43.
The age at which
kindergarteners in
Distribution of kindergarteners based
Estrie in 2016-2017
26y 53 9 + 12
on their age when they entered daycare
had started regularly
attending daycare
varied from one child
12.4%
to another. 9.2%
0 –11 months
Source: Institut de la statistique du 25.8%
Québec, 2017 Québec Survey on the
12–17 months
Preschool Path of Kindergarten Students.
18–35 months
36 months or older
52.5%
32Time spent in childcare
before starting school
When the childcare service is of inferior quality and children are part of a large
group, the number of hours spent in daycare is associated with behaviour
problems44. For example, when compared with children who spent less than
25 hours a week in daycare, children who were in care for more than 35 hours
were more likely to be vulnerable in at least one area of development, as well
as in the areas of “Social skills” and “Emotional maturity”45.
In the Estrie region,
53.9% of children
attending
kindergarten in 2016-2017
had spent an average
of 35 hours or more in
45 Distribution of kindergarteners based on
the number of hours/week spent in childcare
8.5%
13.6%
childcare during their
early childhood.
Source: Institut de la statistique du Québec,
2017 Québec Survey on the Preschool Path
of Kindergarten Students.
+81433y
45.4%
32.4%
Under 25 hours
25 – under 35 hours
35 – under 45 hours
45 hours or more
CHARACTERISTICS
OF CHILDCARE SERVICES
In order to have a positive effect on children’s development, the childcare
facility must be of high quality, staffed by educators with suitable training,
such as a DEC (college diploma) in early childhood education.
Studies have proven the importance of having trained educators in early
childcare facilities.
• S
uitably trained educators are able to provide children with better personal
care, are more sensitive to their needs and interact more with them.
• S
pecialized training in early childhood education enables personnel to offer
an environment that is stimulating and appropriate for children. It also helps
educators to better plan activities and create an environment that fosters
children’s social, language and cognitive development.
• P
articipating in ongoing training activities based on best practices is also
associated with the ability to offer higher-quality educational services46.
33In 2015,
92.0% of the
educational
personnel in CPEs in the region
and 74.6% of educational
personnel in
subsidized daycares
were considered to be qualified. In 2005, the corresponding figures
were 82.3% and 60.5%.
In order to be considered a qualified member
of childcare personnel, an educator must hold
a DEC (college diploma) in early childhood
education or the equivalent recognized by
the Ministère de la Famille.
Since September 2012, at least two out of three members
of the educational personnel of CPEs and private daycares
have been required to be qualified. In 2015, 100% of CPEs
in Estrie were in compliance with this regulation. Private
subsidized daycares were also 100% in compliance.
Source: Ministère de la Famille, Rapport d'activités annuel des services de garde 2005 à 2015.
34SOMETHING CAN BE DONE
There are many possibilities for collective action that could improve educational
childcare services—solutions that have been shown to be effective in practice on
the ground and in the scientific literature both in Québec and around the world.
Here are a few examples:
Creating additional spaces in high-quality educational childcare facilities
(4-year-old kindergarten and educational daycare) specifically for children
from disadvantaged neighbourhoods with fewer services47 would be an
excellent step to take. A program like Interventions éducatives précoces
(IÉP) can help ensure that vulnerable children have access to educational
childcare services of superior quality. The purpose of this program is
to improve young children’s cognitive, language, socio‑affective and
psychomotor development and to facilitate their transition to school48.
Supporting the efforts and quality of supplementary services for
neighbourhood organizations, like drop-in childcare and Organismes
communautaires Famille (OCF), is an effective way to help parents
of young children who have difficulty accessing daycare services–
newcomers, for example49.
Continuing efforts to ensure that all educational childcare facilities reach
the objective of two qualified educators out of every three could help
to improve the quality of educational childcare overall 50. Recognizing and
facilitating educators’ access to training would also improve the quality
of services offered51, as would providing educators with support and the
tools they need in their everyday work environment. The latter measure
is particularly effective when educators are given access to a pedagogical
consultant or information on best practices52.
Since young children spend an average of 35 hours/week in daycare,
educational childcare facilities offer the perfect environment to encourage
healthy lifestyle habits. Initiatives like Attention ! Enfants en mouvement make
the most of that opportunity53. This training program, was developed in Laval
to support childcare services intent on giving their young charges more
opportunities for physical activity. Encouraging childcare services to apply
a framework like Gazelle et Potiron—by offering incentive subsidies, for
example—is a concrete action that has been shown to be effective54.
Gazelle et Potiron focuses on creating environments that promote
healthy eating, active play and motor development.
Some of these measures have already been implemented in Québec.
They need to be maintained and consolidated to safeguard the progress
that has been made in this area.
How could these measures be more effectively applied? What else can be done?
We hope this portrait of the situation will spark public reflection
on these questions.
35HOW THE ESTRIE REGION
COMPARES WITH
QUÉBEC AS A WHOLE
Caution must be used when interpreting this data.
Certain differences between the region and the whole
of Québec could be due to random fluctuations. In the
case of survey data, particularly from the 2017 Québec
All of Québec
Survey on the Preschool Path of Kindergarten Students
(QSPPKS), the “+” and “-” signs indicate that the proportion
observed in the region is either higher or lower that that
Estrie
observed in the rest of the province.
INDICATORS 05
Number of children between the ages
19,569 530,091
0-5 YEAR-OLDS?
WHO ARE THESE
of 0 and 5 (2018)
Proportion of children between
6.0% 6.3%
0 and 5 in the total population (2018)
Number of births (2018) 3,042 83,800
Number of new beneficiaries of the Québec
4,798 125,639
Parental Insurance Plan (QPIP) (2018)
Proportion of kindergarteners whose
mother stayed at home for 6 months 94.7% 95.0%
or longer after they were born
Proportion of kindergarteners whose
father stayed at home for 1 week 84.8% 82.4%
or longer after they were born
FAMILY ENVIRONMENT
Distribution of kindergarteners born
Mother or father only: Mother or father only:
in Canada (whose mother or father
24.4% 28.4%
are their biological or adoptive parents)
based on whether their mother or father Both: 65.3% Both: 61.3%
took paid parental leave under the
Neither: 10.3%* Neither: 10.3%
Québec Parental Insurance Plan (2017)
1 child: 22.7% 1 child: 26.3%
Number of children per family (2016) 2 children: 46.6% 2 children: 46.2%
3 or more children: 30.7% 3 or more children: 27.6%
Proportion of kindergartners whose
21.6% 17.5%
parents are not living together (2017)
Intact: 74.5% Intact: 76.3%
Family structure of children
Single-parent: 13.8% Single-parent: 13.9%
between 0 and 5 (2016)
Step/blended family: 11.6% Step/blended family: 9.8%
36French (with/without French (with/without
Distribution of kindergarteners based other language): 92.1% (+) other language): 85.4%
on the language most often spoken
at home (2017) English and/or other English and/or other
languages: 7.9%* (-) languages: 14.6%
Proportion of women under 20
6.8/1,000 women 5.4/1,000 women
who gave birth (2018)
Proportion of kindergarteners who have
at least one parent living with a physical or
mental disability or a chronic health problem 4.1%* 4.5%
that could limit their ability to provide care
and support for their child (2017)
Proportion of babies born to mothers
6.2% 4.8%
who had not finished high school (2018)
No diploma: 5.1%* No diploma: 3.8%
High school diploma: High school diploma:
Distribution of kindergarteners based 27.5% (+) 20.0%
on the highest diploma obtained
by one or other of their parents College diploma: College diploma:
(or sole parent) (2017) 22.9% 22.2%
University diploma: University diploma:
44.5% (-) 54.0%
Proportion of children between
0 and 5 whose two parents (or sole
1.79% 2.69%
parent) have been living in Canada
FAMILY ENVIRONMENT
for at least 5 years (2016)
Proportion of newborns with at least
15.2% 31.8%
one parent who was born abroad (2017)
Proportion of children between
0 and 5 who are immigrants 1.59% 2.29%
(born outside of Canada) (2016)
Neither parent (or sole Neither parent (or sole
parent) employed: 10.4% parent) employed: 10.3%
Distribution of families with at least
One of two parents One of two parents
one child between 0 and 5 based
employed: 18.4% employed: 20.0%
on their parents’ employment (2016)
Both parents (or sole Both parents (or sole
parent) employed: 71.3% parent) employed: 69.7%
Employment rate of parents with at Father employed: 88.5% Father employed: 88.8%
least one child between 0 and 5 (2016) Mother employed: 75.5% Mother employed: 73.8%
Median after-tax income of families with
$69,820 $72,077
at least one child between 0 and 5 (2015)
Proportion of children between 0 and 5
living in a low-income family (based on 12.4% 13.9%
the low-income measure) (2016)
37Proportion of kindergarteners whose
parents say they have difficulty getting 11.4% 11.2%
their child ready for their day (2017)
Proportion of kindergarteners whose
parents say they find it difficult to
21.7% 17.9%
accompany their child to their
activities (2017)
Proportion of kindergarteners whose
parents say it is hard for them to find 25.2% 26.1%
time to play with their child (2017)
Proportion of kindergarteners whose
parents say they have family and friends
89.9% 90.5%
that help them feel them feel safe,
secure and happy (2017)
Proportion of kindergarteners whose
parents say they have someone they
94.1% 91.9%
trust whom they could turn to for advice
if they had problems. (2017)
FAMILY ENVIRONMENT
Proportion of kindergarteners whose
parents say they have people they 96.5% 95.4%
could count on in an emergency (2017)
Proportion of kindergarteners who
were read to or told stories every day
44.0% 41.0%
during the year before they started
kindergarten (2017)
Proportion of kindergarteners who were
taught to say or recognize the letters of
16.5% 19.1%
the alphabet every day during the year
before they started kindergarten (2017)
Proportion of kindergarteners who were
taught to say or recognize their numbers
18.5% 21.4%
every day during the year before they
started kindergarten (2017)
Proportion of kindergarteners who were
encouraged to use numbers in their daily
27.3% 28.3%
activities every day during the year before
they started kindergarten (2017)
Proportion of children who visited the
library with an adult in their household
44.0% (-) 51.1%
at least once a month during the year
before they started kindergarten (2017)
38Proportion of children between 0 and 5 Urban: 68.8% Urban: 82.1%
living in urban centres or rural areas (2016) Rural: 31.2% Rural: 17.9%
Proportion of children between 0 and 5
living in neighbourhoods considered
22.4% 20.4%
to be among the most materially
disadvantaged (2016)
Proportion of kindergarteners living
in a neighbourhood considered less 13.1% 13.1%
than safe by their parents (2017)
Distribution of kindergarteners based on
their parents’ agreement/disagreement
with certain statements about the safety of 88.7% 90.2%
their neighbourhood: It is safe to walk alone
in the neighbourhood after dark. (2017)
Distribution of kindergarteners based on
PHYSICAL ENVIRONMENT
their parents’ agreement/disagreement
with certain statements about the safety of 95.5% (+) 92.4%
their neighbourhood: It is safe for children
to play outside during the day. (2017)
Distribution of kindergarteners based on
their parents’ agreement/ disagreement
with certain statements about the safety
87.5% (-) 90.8%
of their neighbourhood: There are parks,
playgrounds and other safe places to
play in this neighbourhood. (2017)
Proportion of kindergarteners whose
parents had moved twice or more during 19.6% 17.6%
the five years preceding the survey (2017)
Proportion de families with at least one
child between 0 and 5 living in housing 10.0% 13.6%
considered to be unaffordable (2016)
Proportion of families with at least one
child between 0 and 5 living in a dwelling 6.1% 12.0%
of unsuitable size (2016)
Proportion of families with at least one
child between 0 and 5 living in housing 7.8% 7.9%
that needs major repairs (2016)
39Proportion of children under 5 attending
56.2% 57.9%
a recognized childcare facility (2015)
Proportion of kindergarteners who did not
attend any type of childcare facility prior
57.8% 62.8%
to starting school because one of their
parents chose to stay at home (2017)
EDUCATIONAL CHILDCARE SERVICES
Proportion of kindergarteners who
spent an average of 35 hours or more a
53.9% (-) 61.1%
week in childcare before they entered
kindergarten (2017)
0-11 months: 52.5% (+) 0-11 months: 39.8%
Distribution of kindergarteners who 12-17 months: 25.8% 12-17 months: 28.5%
regularly attended childcare during
their early childhood based on the 18-35 months: 12.4% (-) 18-35 months: 19.9%
age they started (2017) 36 months or older: 36 months or older:
9.2% 11.8%
CPEs: 92.0% CPEs: 84.2%
Average proportion of qualified
educational personnel in CPEs Private subsidized Private subsidized
and daycares (2015) daycares: daycares:
74.6% 73.5%
Proportion of establishments that comply CPEs: 100% CPEs: 90.6%
with government requirements regarding
the training of educational personnel Subsidized daycares: Subsidized daycares:
(2015) 100% 74.6%
* Passable accuracy: coefficient of variation between 15% and 25%. Interpret with caution.
** Poor accuracy: coefficient of variation > 25%. Provided for information purposes only.
40CONCLUSION The 2019 edition of our annual portrait provides evidence of a general improvement in young children’s growing-up environments in Québec. Over the past ten years, the proportion of very young children living in low- income families declined, while that of families in which both parents (or the sole parent, in the case of single-parent families) are employed increased. The 2019 portrait also shows that the vast majority of young children live in neighbourhoods where there are safe places to play outside during the day. The proportion of children between the ages of 0 and 5 enrolled in educational childcare services is on the rise, as is the ratio of qualified educators working in those facilities. There are, however, some causes for concern. One out of ten families with at least one very young child is still experiencing food insecurity. Parents’ stress levels, especially that of mothers, are worrying. Certain regions of Québec are more materially disadvantaged than others. We have learned, also, that there is still much to be done to improve the quality of educational childcare services across the province. As a society, we need to be concerned about the environments our children are growing up in: those environments have a deciding influence on early childhood development. Offering better work-life balance measures to all parents of young children and providing more flexible arrangements when they return to work after parental leave are two examples of potential solutions that could help to alleviate parents’ stress. Providing financial support for economically disadvantaged families and investing in affordable housing programs would improve young children’s living conditions. Finally, giving educators the support and the tools they need to work effectively, as well as more opportunities for training, could play an important role in improving the quality of educational childcare services. The scientific literature and practical experience on the ground has shown us that steps can be taken to help ensure that every young child in Québec has the best possible start in life. Every sector of society has to be on board. Our futures depend on it.
REFERENCES
1    Hertzman C. Framework for the Social Determinants of Early Child Development. In: Tremblay RE,
     Boivin M, Peters RDeV, eds. Encyclopedia on Early Childhood Development [online]. http://www.
     child-encyclopedia.com/importance-early-childhood-development/according-experts/framework-
     social-determinants-early-child. Published November 2010. Accessed March 12, 2019.

2    Ruhm CJ. The Effects of Parental Employment and Parental Leave on Child Health and Development.
     In: Tremblay RE, Boivin M, Peters RDeV, eds. Encyclopedia on Early Childhood Development [online].
     http://www.child-encyclopedia.com/parental-leave/according-experts/effects-parental-employment-
     and-parental-leave-child-health-and. Updated March 2007. Accessed March 12, 2019.

3    LAVOIE, Amélie, Lucie GINGRAS and Nathalie AUDET (2019). Enquête québécoise sur le parcours
     préscolaire des enfants de maternelle 2017. Portrait statistique pour le Québec et ses régions
     administratives, [En ligne], Québec, Institut de la statistique du Québec, Volume 1, 154 p.
     [www.stat.gouv.qc.ca/statistiques/education/prescolaire-primaire/eqppem_tome1.pdf]

4    DESROSIERS, H. (2013). “Conditions de la petite enfance et préparation pour l’école : l’importance
     du soutien social aux familles,” Portraits et trajectoires, [online], No. 18, April, Institut de la statistique
     du Québec, p. 1-16. [www.stat.gouv.qc.ca/statistiques/sante/bulletins/portrait-201304.pdf].

5    LAVOIE, Amélie (2019). Enquête québécoise sur le parcours préscolaire des enfants de maternelle
     2017. Examen du lien entre la fréquentation des services de garde et le développement des enfants
     de maternelle, [online], Québec, Institut de la statistique du Québec, Tome 2, 81 p.

6    DESROSIERS, Hélène, et Amélie DUCHARME (2006). “Commencer l’école du bon pied. Facteurs associés
     à l’acquisition du vocabulaire à la fin de la maternelle,” in: Étude longitudinale du développement des
     enfants du Québec (ÉLDEQ 1998-2010), Québec, Institut de la statistique du Québec, vol. 4, fascicule 1.

7    DESROSIERS, Hélène, Virginie NANHOU et Luc BELLEAU (2016). “L’adaptation psychosociale et scolaire
     des jeunes lors du passage au secondaire,” Étude longitudinale du développement des enfants du
     Québec (ELDEQ 1998-2015) – De la naissance à 17 ans, Institut de la statistique du Québec, vol. 8,
     fascicule 2, 32 p.

8    LAVOIE, Amélie, Lucie GINGRAS et Nathalie AUDET (2019). Enquête québécoise sur le parcours
     préscolaire des enfants de maternelle2017. Portrait statistique pour le Québec et ses régions
     administratives, [online], Québec, Institut de la statistique du Québec, Tome 1, 154 p.
     [www.stat.gouv.qc.ca/statistiques/education/prescolaire-primaire/eqppem_tome1.pdf]

9    BIGRAS, N., D. BLANCHARD, C. BOUCHARD, L. LEMAY, M. TREMBLAY, G. CANTIN, L. BRUNSON, et M.-C.
     GUAY (2009). “Stress parental, soutien social, comportements de l’enfant et fréquentation des services
     de garde,” Enfances, Familles, Générations, [online], no 10, printemps, p. 1-30. [www.erudit.org/fr/revues/
     efg/2009-n10-efg3114/037517ar/].

10   Falster K, Hanly M, Banks E, Lynch J, Chambers G, Brownell M, et al. (2018) Maternal age and offspring
     developmental vulnerability at age five: A population-based cohort study of Australian children.
     PLoS Med 15(4): e1002558. https://doi.org/10.1371/journal.pmed.1002558

11   LAVOIE, Amélie, Lucie GINGRAS et Nathalie AUDET (2019). Enquête québécoise sur le parcours
     préscolaire des enfants de maternelle2017. Portrait statistique pour le Québec et ses régions
     administratives, [online], Québec, Institut de la statistique du Québec, Tome 1, 154 p.
     [www.stat.gouv.qc.ca/statistiques/education/prescolaire-primaire/ eqppem_tome1.pdf]

12   LAVOIE, Amélie, Lucie GINGRAS and Nathalie AUDET (2019). Enquête québécoise sur le parcours
     préscolaire des enfants de maternelle2017. Portrait statistique pour le Québec et ses régions
     administratives, [online], Québec, Institut de la statistique du Québec, Tome 1, 154 p.
     [www.stat.gouv.qc.ca/statistiques/education/prescolaire-primaire/eqppem_tome1.pdf]

                                                           42
You can also read