Findings from a pre-election survey in Zimbabwe: June/July 2018

Page created by Jose Francis
 
CONTINUE READING
Findings from a pre-election survey in Zimbabwe: June/July 2018
WWW.AFROBAROMETER.ORG

Findings from a pre-election survey
in Zimbabwe: June/July 2018

                                 1
Findings from a pre-election survey in Zimbabwe: June/July 2018
At a glance
•   Fear of electoral violence declined slightly but remained high: The
    proportion of Zimbabweans who fear becoming a victim of electoral
    violence dropped by 8 percentage points since May 2018 but is still
    above average among African countries.

•   Zimbabweans remained apprehensive about the possibility of
    electoral manipulation: As was the case in May 2018, significant
    minorities were worried about ballot secrecy, counting of votes,
    announcement of incorrect results, post-election violence, and the
    military not accepting election results.

•   Presidential race tightened one month ahead of July 30 voting:
    Among registered likely voters, incumbent Mnangagwa’s lead over
    challenger Chamisa dropped from 11 to just 3 percentage points
    between early May and early July. The voting intentions of 20% were
    unknown.

                                                                          2
Findings from a pre-election survey in Zimbabwe: June/July 2018
Pre-election surveys

• The Institute for Justice and Reconciliation commissioned two
  pre-election surveys. Fieldwork was conducted in all 10
  provinces of Zimbabwe by the Mass Public Opinion Institute
  (MPOI), Afrobarometer’s national partner in Zimbabwe.

• Technical assistance was provided by Afrobarometer, a pan-
  African, non-partisan research network that conducts public
  attitude surveys on democracy, governance, economic
  conditions, and related issues in African countries.

• A baseline survey was conducted 28 April to 13 May 2018.
  Findings are available at www.afrobarometer.org.

• A final pre-election survey was conducted 25 June to 6 July
  2018.

                                                                  3
Findings from a pre-election survey in Zimbabwe: June/July 2018
Methodology
• Nationally representative sample of adult citizens
   ❑ All respondents are randomly selected.
   ❑ Sample is distributed across provinces and urban/rural areas in
     proportion to their share in the national population.
   ❑ Every adult citizen has an equal chance of being selected.
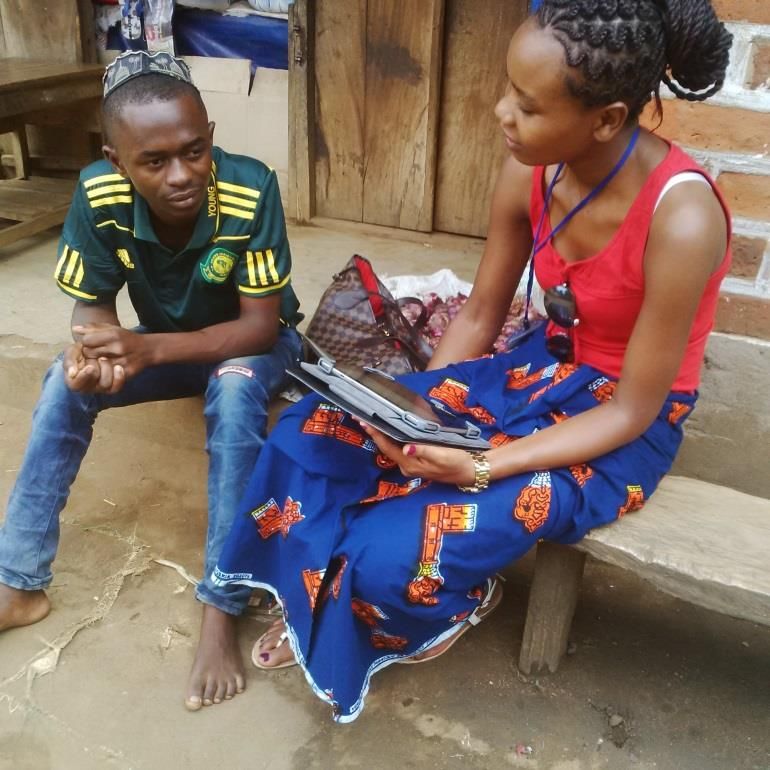
• Face-to-face interviews in the language
  of the respondent’s choice.
• Sample size of 2,400 in both pre-election
  surveys yields results with a margin of
  error of +/-2 percentage points at a 95%
  confidence level.

                                                                       4
Findings from a pre-election survey in Zimbabwe: June/July 2018
Survey demographics

Gender                             %
                           Men     50
                        Women      50
Residence
                         Urban     37
                          Rural    63
Education
            No formal education    4
                         Primary   23
                      Secondary    59
                 Post-secondary    14

                                        5
Nature of the campaign
Key findings
■ More than four in 10 Zimbabweans (43%) said they personally feared
  becoming a victim of electoral intimidation or violence. Though high
  compared to other African countries, this is an 8-percentage-point drop
  from the slim majority (51%) who felt this way in early May.
■ This decline in expressions of political fear is reinforced by a growing
  majority (68%) who said the current government is performing “fairly well”
  or “very well” at preventing electoral violence (up from 63% in May).
■ The proportion of respondents who think that “people must be careful of
  what they say about politics” dipped by 6 percentage points between
  May (82%) and July (76%). But a tendency to self-censorship remained
  strong (e.g. higher than a 24-country average of 70%).
■ There has been a slight improvement in the popular misperception that a
  BVR slip must be produced at the polling station as a requirement to
  vote: 64% in July vs. 72% in May.

                                                                               7
How closely citizens are following preparations
for elections | Zimbabwe | May-July 2018
 100%

  80%
                  65%             67%

  60%

  40%                                                       34%            33%

  20%

   0%
                   Fairly/Very closely                  Not very closely/Not at all
                              Early May 2018     Early July 2018

Respondents were asked: How closely are you following the preparations for the 2018 elections?

                                                                                                 8
Sources of election information | Zimbabwe
| May-July 2018
                 Government radio                                        26%
                                                                                        40%
   Friends, neighbours, co-workers                                        27%
                                                                                32%
             Political party officials                       17%
                                                                          27%
            Government television                         14%
                                                                         25%
                        Private radio                       16%
                                                                         25%
                    Family members                              18%
                                                                   21%
                        Social media                      14%
                                                                 20%
Community development meetings                                  19%
                                                                19%
         Government newspapers                        11%
                                                             17%
                Private newspapers                    11%
                                                            16%
                    Private television               9%
                                                          15%
                              Internet                11%
                                                         14%
                 Traditional leaders                      15%
                                                        13%
    Religious leaders or gatherings              7%
                                                6%
        Election watchdog groups              3%
                                                5%
                                         0%                 20%                       40%     60%
                                 Early May 2018           Early July 2018

Respondents were asked: How much information on the 2018 elections have you received
from the following sources?

                                                                                                    9
Sources of election information | by urban-rural location
| Zimbabwe | July 2018
                  Government radio                                              37%
                                                                                       46%
              Political party officials                                  31%
                                                                21%
    Friends, neighbours, co-workers                                   27%
                                                                                 41%
 Community development meetings                                   23%
                                                       11%
                         Private radio                          21%
                                                                          32%
                  Traditional leaders                          20%
                                               1%
                     Family members                          18%
                                                                    25%
                         Social media                 10%
                                                                             36%
             Government television                    10%
                                                                                         50%
          Government newspapers                     8%
                                                                          32%
                               Internet           6%
                                                                    27%
                 Private newspapers               6%
                                                                          33%
     Religious leaders or gatherings              6%
                                                     7%
                     Private television          4%
                                                                          32%
         Election watchdog groups               3%
                                                    8%
                                          0%                 20%                40%            60%
                                               Rural   Urban

Respondents were asked: How much information on the 2018 elections have you received
from the following sources?

                                                                                                     10
Knowledge of election procedures | Zimbabwe
  | May-July 2018

                                                                                           92%
     Know that ballots will be cast for MPs and
                    president
                                                                                          91%

                                                                                            95%
                          Know voting location
                                                                                             99%

                                                  0%    20%      40%      60%     80%      100%
                                   Early May 2018      Early July 2018

Respondents were asked: As you may know, Zimbabwe will hold elections in 2018. I would like to ask
you a few questions about these elections.
- To your knowledge, will citizens be casting ballots for members of Parliament as well as the president?
(Analysis includes all respondents.)
- Do you know the location of the polling station where you will vote? (Analysis includes only registered
voters.)

                                                                                                     11
Misuse of BVR slips | Zimbabwe | May-July 2018
         100%

          80%

                                  72%
          60%
                                                                         64%

          40%

          20%                     31%
                                                                         25%

           0%
                            Early May 2018                          Early July 2018

                             Believe that voters must show BVR slip to vote

                             Have been asked to show BVR slip number

Respondents were asked: As you may know, Zimbabwe will hold elections in 2018. I would like to
ask you a few questions about these elections.
- To your knowledge, will a citizen have to show a biometric voter registration (BVR) slip in order
to vote? (Analysis includes all respondents.)
- Has anyone demanded to see the serial number of your voter registration slip? (Analysis
includes only registered voters.)

                                                                                                      12
Knowledge of election procedures | by political party
  affiliation | Zimbabwe | July 2018
     100%
                                    100%    98%
                94%     93%
      80%

      60%                                                       71%
                                                         60%
      40%

      20%                                                                    28%    26%

       0%
            Know that ballots       Know voting       Think voters must Have been asked
            will be cast for MPs      location        show BVR slip to    to show voter
               and president                                 vote        registration slip
                                                                             number
                              MDC-T Chamisa/Alliance           ZANU-PF

Respondents were asked:
- To your knowledge, will citizens be casting ballots for members of Parliament as well as the president?
(All respondents)
- To your knowledge, will a citizen have to show a biometric voter registration (BVR) slip in order to vote?
(All respondents)
- Do you know the location of the polling station where you will vote? (Registered voters only)
- Has anyone demanded to see the serial number of your voter registration slip? (Registered voters only)

                                                                                                       13
Knowledge of election procedures | by urban-rural
   location | Zimbabwe | July 2018
   100%        90%     92%           98%     99%

    80%
                                                                   66%
                                                           60%
    60%

    40%                                                                                  29%
                                                                                 18%
    20%

     0%
          Know that ballots will    Know voting         Think voters must Have been asked to
          be cast for MPs and         location        show BVR slip to vote   show voter
              president                                                     registration slip
                                                                                number
                                            Urban     Rural

Respondents were asked:
- To your knowledge, will citizens be casting ballots for members of Parliament as well as the president?
(All respondents)
- To your knowledge, will a citizen have to show a biometric voter registration (BVR) slip in order to vote?
(All respondents)
- Do you know the location of the polling station where you will vote? (Registered voters only)
- Has anyone demanded to see the serial number of your voter registration slip? (Registered voters only)

                                                                                                       14
Think that voters have to show BVR slip | by province
 | Zimbabwe | July 2018

        Mashonaland East                                                       77%
                 Midlands                                                    72%
       Mashonaland West                                                  69%
                 Masvingo                                              64%
      Zimbabwe average                                                 64%
              Manicaland                                               64%
      Matabeleland North                                           60%
                Bulawayo                                          59%
                   Harare                                         58%
    Mashonaland Central                                        54%
      Matabeleland South                                   49%

                            0%         20%         40%           60%           80%      100%

Respondents were asked: To your knowledge, will a citizen have to show a biometric voter registration
(BVR) slip in order to vote? (% of all respondents who say “yes”)

                                                                                                  15
Ever heard of political party alliances | Zimbabwe
| May-July 2018
  80%

                                                                       75%

  60%
                            57%

  40%

                                                                       25%

  20%                    17%                                             22%
                         16%

   0%
                      Early May 2018                              Early July 2018

            Heard of MDC Alliance                   Heard of People’s Rainbow Coalition
            Heard of Coalition of Democrats

Respondents were asked: Have you ever heard of the following political alliances?

                                                                                          16
Attended party meetings or rallies | Zimbabwe
 | May-July 2018
  60%

  40%

                                                                    34%
                            28%
  20%
                                                                    12%
                            9%

                       6%                                             6%
   0%
                     Early May 2018                            Early July 2018

                        ZANU-PF       MDC-T Chamisa         MDC Alliance

Respondents were asked: Have you attended any party meetings or rallies organized by the
following parties or political party alliances during the campaign for the 2018 elections?

                                                                                             17
Attended party meetings or rallies | by urban-rural
  location | Zimbabwe | July 2018
  100%

   80%

   60%

                                                              41%
   40%

                    21%
   20%                              15%
                                                                              10%

     0%
                           Urban                                     Rural
                     ZANU-PF meeting/rally      MDC-T Chamisa meeting/rally

Respondents were asked: Have you attended any party meetings or rallies organized by the
following parties or political party alliances during the campaign for the 2018 elections?

                                                                                             18
Attended party meetings or rallies | by province
  | Zimbabwe | July 2018

  Mashonaland Central                                           48%
                                8%
               Midlands                                         47%
                                  11%
              Masvingo                                    41%
                                     13%
    Matabeleland South                                36%
                                  11%
     Mashonaland West                                 36%
                                     13%
            Manicaland                              32%
                                 10%
      Mashonaland East                              32%
                                 10%
    Matabeleland North                        26%
                                             24%
                 Harare                    21%
                                  11%
              Bulawayo               16%
                                 10%
                          0%          20%            40%              60%    80%       100%
                    ZANU-PF meeting/rally           MDC-T Chamisa meeting/rally

Respondents were asked: Have you attended any party meetings or rallies organized by the
following parties or political party alliances during the campaign for the 2018 elections?

                                                                                              19
Trust in leaders | Zimbabwe | May-July 2018
100%

80%
                                                                                        70%
                                                                                  67%

60%                                                                       53%
                             48%                                    50%
         47% 47%
                       40%
40%                                   35% 33%

20%

                                                     5%
  0%
        President       MDC-T          Former     MDC-T Khupe       Traditional   Religious
       Mnangagwa       Chamisa        President                       leaders      leaders
                                      Mugabe
                                Early May 2018    Early July 2018

Respondents were asked: How much do you trust each of the following, or haven’t you heard
enough about them to say? (% who say “somewhat” or “a lot”

                                                                                              20
Trust in leaders | by urban-rural location | Zimbabwe
 | July 2018
  100%

    80%
                                                                                     72%
                                                                    69%        67%
                             62%
    60%
                  50%
            41%                    40%              39%
    40%

                                             24%              26%
    20%

     0%
            President         Nelson      Former President    Traditional   Religious leaders
           Mnangagwa         Chamisa         Mugabe             leaders
                                          Urban    Rural

Respondents were asked: How much do you trust each of the following, or haven’t you heard
enough about them to say? (% who say “somewhat” or “a lot”)

                                                                                                21
Careful about what one says | Zimbabwe | May-July 2018

      100%

       80%                 82%
                                                                        76%

       60%

       40%

                                                                        23%
       20%
                           17%

        0%
                         Early May 2018                         Early July 2018

                                  Often/Always       Rarely/Never

Respondents were asked: In your opinion, how often, in this country, do people have to be careful
of what they say about politics?

                                                                                                22
Careful about what one says | by political party
  affiliation | Zimbabwe | July 2018
    100%
                    16%
                                        29%                  28%                  23%
      80%

      60%

      40%           84%
                                        71%                  73%                  76%

      20%

       0%
             MDC-T Chamisa/           ZANU-PF            Other parties       Not close to a
                Alliance                                                  party/Refused/Don't
                                                                                 know
                                   Often/Always      Rarely/Never

Respondents were asked: In your opinion, how often, in this country, do people have to be careful
of what they say about politics?

                                                                                                23
Government performance: Prevention of political
  violence during election campaigns | Zimbabwe
  | May-July 2018
 100%

   80%
                                    68%
                   63%
   60%

   40%
                                                              31%             28%

   20%

    0%
                      Fairly/Very well                          Fairly/Very badly
                                 Early May 2018    Early July 2018

Respondents were asked: Now let’s speak about the performance of the present government of
this country, that is, the government in power since November 2017. How well or badly would you
say this new government is handling the following matters, or haven’t you heard enough to say:
Preventing political violence during election campaigns?

                                                                                              24
Fear of electoral intimidation or violence | Zimbabwe
| May-July 2018

   80%

   60%
                                                                            56%
                        51%
                         48%
   40%                                                                      43%

   20%

     0%
                      Early May 2018                             Early July 2018
                            Somewhat/A lot        A little bit/Not at all

Respondents were asked: During election campaigns in this country, how much do you personally
fear becoming a victim of political intimidation or violence?

                                                                                            25
Kenya                             56%
                                        Lesotho                            53%
                                         Guinea                          49%
                                        Uganda                           48%
Fear of electoral                        Zambia                         47%

intimidation or                       Swaziland
                                     Zimbabwe
                                                                       43%
                                                                       43%
violence                                 Gabon                        42%
                                           Togo                       41%
| 24 African countries                   Nigeria                   33%
| 2016/2018                                 Mali
                            24-country average
                                                                  32%
                                                                 30%
                                         Malawi                 27%
                                       Tanzania                 26%
Respondents were asked:
                                         Ghana                 23%
During election campaigns
                                  Côte d'Ivoire               22%
in this country, how much
do you personally fear                     Benin              21%
becoming a victim of                       Niger             18%
political intimidation or               Senegal             16%
violence?                              Namibia             14%
                                  Burkina Faso             14%
(Result for Zimbabwe is                Mauritius          13%
from early July 2018)                 Botswana            12%
                                  Madagascar             11%
                                  Cape Verde            8%
                                                   0%    20%     40%     60%      80%   100%

                                                                                        26
Fear of electoral intimidation or violence | by political
  party affiliation | Zimbabwe | July 2018

                 MDC-T Chamisa/Alliance                             48%

                                  ZANU-PF                     38%

                             Other parties                     40%

  Not close to a party/Refused/Don’t know                         45%

                                             0%    20%      40%         60%    80%      100%
Respondents were asked: During election campaigns in this country, how much do you personally
fear becoming a victim of political intimidation or violence? (% who say “somewhat” or “a lot”)

                                                                                               27
Fear of electoral intimidation or violence | by province
  | Zimbabwe | July 2018

      Mashonaland East                                                 71%

                  Harare                                       50%

   Mashonaland Central                                     47%

                Midlands                                  46%

      Mashonaland West                                    44%

            Manicaland                                   42%

               Bulawayo                          30%

    Matabeleland South                       27%

    Matabeleland North                     24%

               Masvingo                    23%

                           0%        20%           40%           60%      80%        100%

Respondents were asked: During election campaigns in this country, how much do you personally
fear becoming a victim of political intimidation or violence? (% who say “somewhat” or “a lot”)

                                                                                              28
Confidence in elections
Key findings

■ Zimbabweans remained apprehensive about manipulated election
  results. As in early May, significant minorities in early July were worried
  about ballot secrecy, counting of votes, announcement of incorrect
  results, post-election violence, and the military not accepting election
  results.
■ About one-third of respondents still saw the Zimbabwe Electoral
  Commission as a biased rather than neutral body.
■ Even so, a clear majority (60%) remained optimistic that the election
  will be largely free and fair. And three-fourths continued to believe
  that elections are more likely to “improve lives” rather than “change
  nothing.”
■ Six out of 10 Zimbabweans (62%) continued to feel that the presence
  of uniformed police at polling stations will improve the integrity of the
  election, but support for the presence of uniformed military personnel
  at the polls declined from 47% to 41% between May and July.

                                                                                30
Popular expectations about elections | Zimbabwe
| May-July 2018
100%

                           75%                                         77%
  80%

  60%
                           62%                                         60%
  40%

  20%

   0%
                     Early May 2018                               Early July 2018

        Agree/Agree very strongly that voting can improve life
        2018 election will be "completely free and fair" or "free and fair with minor problems"

Respondents were asked:
- Which of the following statements is closest to your view?
Statement 1: No matter whom we vote for, things will not get better in the future.
Statement 2: We can use our power as voters to choose leaders who will help us improve our lives.
- How free and fair do you expect the next elections of 2018 to be?

                                                                                                  31
Assessment of primary elections | Zimbabwe | July 2018
  100%

   80%

   60%
                                                                              48%
                44%
                           40%
   40%                                                  33%

                                                                   19%
   20%                                15%

    0%
                        ZANU-PF                               MDC-T Chamisa
                      Free and fair (completely or with minor problems)
                      Free and fair with major problems/Not free and fair
                      Don't know/Don't understand the question

Respondents were asked: What about the recently concluded political party primaries? How
free and fair would you say they were for each of the following parties?

                                                                                           32
Primary elections free and fair (completely or with minor
 problems) | by province | Zimbabwe | July 2018
                                    ZANU-PF                MDC-T Chamisa
Masvingo                              68%                         41%
Mashonaland East                      56%                         30%
Matabeleland South                    53%                         33%
Midlands                              52%                         34%
Mashonaland Central                   42%                         14%
Manicaland                            40%                         34%
Mashonaland West                      40%                         31%
Harare                                35%                         42%
Bulawayo                              26%                         27%
Matabeleland North                    26%                         25%

Respondents were asked: What about the recently concluded political party primaries?
How free and fair would you say they were for each of the following parties?

                                                                                 33
Is ZEC neutral or biased? | Zimbabwe | May-July 2018

                 May 2018                                        July 2018
                                Agree very                                       Agree very
                                strongly that                                    strongly that
                                ZEC is neutral                                   ZEC is neutral
                                Agree that               13%                     Agree that
         17%                    ZEC is neutral                                   ZEC is neutral
                   30%                                              27%
                                Agree that                                       Agree that
                                ZEC is biased     22%                            ZEC is biased
   21%
                                Agree very                                       Agree very
                 23%            strongly that                     26%            strongly that
         9%                                             12%
                                ZEC is biased                                    ZEC is biased
                                Agree with                                       Agree with
                                neither/Don't                                    neither/Don't
                                know                                             know

Respondents were asked: Which of the following statements is closest to your view?
Statement 1: The Zimbabwe Electoral Commission (ZEC) performs its duties as a neutral body
guided only by law.
Statement 2: The Zimbabwe Electoral Commission (ZEC) makes decisions that favour particular
people, parties or interests.
(% who “agree” or “agree very strongly” with each statement)

                                                                                              34
Feel more secure with police/military personnel at
  polling stations? | Zimbabwe | May-July 2018
   100%

    80%
                            61%                                      62%
    60%

    40%                     48%
                                                                     41%

    20%

     0%
                       Early May 2018                           Early July 2018

                       Uniformed military personnel       Uniformed police

Respondents were asked: Would the presence of the following security agents at polling stations
make you feel more secure, make no difference, or make you feel less secure?
   - Uniformed military personnel
   - Uniformed police
(% who say “more secure” or “much more secure”

                                                                                                  35
Likelihood of election irregularities | Zimbabwe
  | May-July 2018
       60%

                                   44%                                            45%

       40%
                               31%
                                                                                    28%
                                   29%
       20%                                                                        26%

        0%
                             Early May 2018                                 Early July 2018

             Powerful will find out how you voted               Vote won't be counted
             Incorrect results will be announced

Respondents were asked: In your opinion, how likely will the following things happen in the 2018 elections:
A. Even though there is supposed to be a secret ballot in this country, powerful people will find out how you
    have voted?
B. Even though you will cast a ballot, your vote will not actually be counted?
C. Even after all ballots are counted, an incorrect result will be announced?
(% who say “somewhat likely” or “very likely”)

                                                                                                                36
Concerns about post-election period | Zimbabwe
  | May-July 2018
    60%

                             41%                                             44%
    40%
                               40%

    20%

     0%
                         Early May 2018                              Early July 2018

          Post-election violence somewhat/very likely

          Somewhat/Very likely that security agencies won't accept presidential election results

Respondents were asked: In your view, how likely is it that:
  - There will be violence after the announcement of election results?
  - Security agencies will not accept the result of the presidential election?

                                                                                                   37
Concerns about post-election period | by urban-rural
  location | Zimbabwe | July 2018
  100%

   80%

   60%
                     48%                                        48%
                                     41%                                         42%
   40%

   20%

    0%
           Post-election violence somewhat/very         Somewhat/Very likely that security
                             likely                     agencies won't accept presidential
                                                                 election results
                                           Urban     Rural

Respondents were asked: In your view, how likely is it that:
  - There will be violence after the announcement of election results?
  - Security agencies will not accept the result of the presidential election?

                                                                                             38
Voting intentions
Key findings
■ The survey confirms high levels of self-reported voter
  registration: 88%, up by 3 percentage points from early May.
■ Almost nine out of 10 respondents said they will “definitely”
  (77%) or “probably” (9%) vote in the 2018 election.
■ In the presidential race, Chamisa appears to have benefited
  from a slight increase in party identification and a popular
  perception that he would be the candidate better able to
  address Zimbabweans’ top campaign issue – job creation.
■ Between early May and early July, Mnangagwa’s lead over
  Chamisa among registered likely voters dropped from 11 to
  just 3 percentage points: 40% to 37%.
■ The voting intentions of 20% of registered likely voters were
  unknown.

                                                                  40
Registered (self-reported) and likely to vote | Zimbabwe
| May-July 2018
   100%

                                                                    88%
                        86%                                         86%
                        85%
    80%

    60%
                      Early May 2018                        Early July 2018
                    Registered to vote       Will probably/definitely vote

Respondents were asked:
  - Are you registered to vote in the upcoming 2018 elections?
  - How likely are you to vote in the 2018 elections?

                                                                              41
Registered (self-reported) and likely to vote | by
political party affiliation | Zimbabwe | July 2018
 100%       93%     93%          92%     91%
                                                      87%        87%
                                                                           80%
  80%                                                                                76%

  60%

  40%

  20%

   0%
              ZANU-PF             MDC-T               Other parties       Not close to a
                              Chamisa/Alliance                         party/Refused/Don't
                                                                              know
              Registered to vote (self-reported)     Will probably/definitely vote

Respondents were asked:
  - Are you registered to vote in the upcoming 2018 elections?
  - How likely are you to vote in the 2018 elections?

                                                                                             42
Registered to vote (self-reported) | by province
| Zimbabwe | July 2018
             Masvingo                                                                 92%

 Mashonaland Central                                                                  91%

             Midlands                                                                 91%

    Mashonaland West                                                                 90%

    Mashonaland East                                                                 89%

             Bulawayo                                                           85%

          Manicaland                                                            85%

                Harare                                                          85%

  Matabeleland South                                                           84%

  Matabeleland North                                                           83%

                         0%        20%         40%          60%          80%           100%

Respondents were asked: Are you registered to vote in the upcoming 2018 elections?

                                                                                              43
Party identification | Zimbabwe | May-July 2018

 100%

  80%

  60%                                                               68%
                           65%

  40%

  20%

   0%
                     Early May 2018                            Early July 2018

Respondents were asked: Do you feel close to any particular political party?
(% who say “yes”)

                                                                                 44
Party identification | Zimbabwe | May-July 2018

                May 2018                                             July 2018

                                ZANU-PF                                             ZANU-PF

                                MDC-T                                               MDC-T
                   35%          Chamisa/             36%               34%          Chamisa/
 40%
                                Alliance                                            Alliance
                                Other party                                         Other party

                                                      1%
    1%
            24%                 Not close to a                 29%                  Not close to a
                                party/Refused                                       party/Refused
                                /Don't know                                         /Don't know

Respondents were asked: Do you feel close to any particular political party? (If yes:) Which
party is that?

                                                                                                  45
Who would be better at job creation? | Zimbabwe
  | July 2018

    100%

     80%

     60%

                   42%
     40%
                                        32%

     20%                                                                           18%
                                                              8%

      0%
             Nelson Chamisa          Emmerson          Neither of them    Don't know/Refused
                                    Mnangagwa                                  to answer

Respondents were asked: Most people in Zimbabwe think that the present election campaign
is mainly about job creation. Of the following presidential candidates, who do you think will do
a better job in creating jobs for the people?

                                                                                                   46
Who would be better at job creation? | by political party
affiliation and urban-rural location | Zimbabwe | July 2018

      MDC-T Chamisa/Alliance supporters                                                     93%
                                                   3%

                       ZANU-PF supporters           7%
                                                                                   75%

                    Other party supporters                                   59%
                                                   5%

 Not close to a party/Refused/Don't know                             34%
                                                         16%

                                      Rural                          36%
                                                                     37%

                                     Urban                                 53%
                                                               24%

                                              0%         20%         40%   60%     80%      100%
                           Nelson Chamisa           Emmerson Mnangagwa

Respondents were asked: Most people in Zimbabwe think that the present election campaign
is mainly about job creation. Of the following presidential candidates, who do you think will do
a better job in creating jobs for the people?

                                                                                                   47
Voting intentions in the presidential election | Zimbabwe
| July 2018
   100%

    80%

    60%

                  40%
    40%                                37%

                                                           20%
    20%

                                                                                 3%
     0%
                ZANU-PF             MDC-T          Refused/Don't            Other parties
                                Chamisa/Alliance know/Will not vote

 Respondents were asked: If presidential elections were held tomorrow, which party’s
 candidate would you vote for? (Note: Analysis includes registered likely voters only.)

                                                                                            48
Change in voting intentions in the presidential election
 | Zimbabwe | May-July 2018
    60%

                             42%
                                                                      40%
    40%

                                                                      37%
                             31%

    20%

     0%
                       Early May 2018                            Early July 2018

                              ZANU-PF       MDC-T Chamisa/Alliance

Respondents were asked: If presidential elections were held tomorrow, which party’s
candidate would you vote for? (Note: Analysis includes registered likely voters only.)

                                                                                         49
Voting intentions in the presidential election | by
urban-rural location | Zimbabwe | July 2018
100%

 80%

 60%
          49%                               48%
                                                                             40%
 40%                                                                   37%
                                      30%
                26%
                      23%
                                                  19%                              20%
 20%

                             3%                            3%                            3%
  0%
                  Urban                        Rural                         Average
          MDC-T Chamisa/Alliance                       ZANU-PF
          Refused/Don't know/Would not vote            Other parties

Respondents were asked: If presidential elections were held tomorrow, which party’s
candidate would you vote for? (Note: Analysis includes registered likely voters only.)

                                                                                              50
Voting intentions in the presidential election | by
province | Zimbabwe | July 2018

              Bulawayo         18%                  50%
   Matabeleland North            26%                      49%
                 Harare           30%                     45%
   Matabeleland South                35%                   38%
           Manicaland                37%                        44%
     Mashonaland East                    47%                     31%
               Midlands                  47%                     30%
  Mashonaland Central                    47%                    25%
              Masvingo                   47%                    26%
    Mashonaland West                       49%                        36%

                          0%           20%         40%          60%         80%          100%
                               ZANU-PF       MDC-T Chamisa/Alliance

Respondents were asked: If presidential elections were held tomorrow, which party’s
candidate would you vote for? (Note: Analysis includes registered likely voters only.)

                                                                                                51
Voting intentions in the parliamentary election
| Zimbabwe | May-July 2018
100%

  80%

  60%
            43%    41%
  40%                                   36%
                                30%
                                                    25%
                                                            20%
  20%

                                                                         2%      3%
   0%
             ZANU-PF             MDC-T             Refused/Don't        Other parties
                             Chamisa/Alliance     know/Would not
                                                       vote
                              Early May 2018    Early July 2018

Respondents were asked: If elections were held tomorrow, which party’s or alliance’s
candidate would you vote for as member of Parliament? (Note: Analysis includes registered
likely voters only.)

                                                                                            52
Voting intentions in the parliamentary election | by
urban-rural location | Zimbabwe | July 2018
100%

 80%

 60%
                   50%          48%

 40%
                                        29%
           25%                                       23%
                                                             18%
 20%
                                                                           4%      3%
  0%
             ZANU-PF             MDC-T              Refused/Don't         Other parties
                             Chamisa/Alliance      know/Would not
                                                        vote
                                       Urban    Rural

Respondents were asked: If elections were held tomorrow, which party’s or alliance’s
candidate would you vote for as member of Parliament? (Note: Analysis includes registered
likely voters only.)

                                                                                            53
Voting intentions in the parliamentary election
| Zimbabwe | 2018
                                             MDC-T          Refused/
                           ZANU-PF         Chamisa/        Don’t know/       Other parties
                                            Alliance      Would not vote
Mashonaland West              53%             34%               11%                3%
Mashonaland East              51%             27%               22%                1%
Mashonaland Central           50%             24%               17%                9%
Masvingo                      49%             27%               20%                4%
Midlands                      48%             29%               21%                2%
Matabeleland South            37%             34%               20%                8%
Manicaland                    36%             44%               19%                1%
Harare                        29%             44%               26%                1%
Matabeleland North            27%             47%               20%                7%
Bulawayo                      18%             50%               24%                8%

Respondents were asked: If elections were held tomorrow, which party’s or alliance’s
candidate would you vote for as member of Parliament? (Note: Analysis includes registered
likely voters only.)

                                                                                             54
‘Wisdom of the crowd’: Expected winner of presidential
election | Zimbabwe | May-July 2018
      100%

       80%

       60%
                 44%     43%
       40%                                   34%
                                     29%
                                                                              23%
       20%                                                                            17%

                                                           3%     5%
        0%
                   ZANU-PF            MDC-T        Election is too close     Refused/Don't
                                  Chamisa/Alliance        to call                know
                                  Early May 2018      Early July 2018

Respondents were asked: Regardless of whether or not you will vote, or who you will vote for,
which party’s or alliance’s candidate do you expect, ultimately, will win the 2018 presidential
election? (Note: Analysis includes all respondents.)

                                                                                                  55
Prospects for a Government of National Unity | Zimbabwe
| July 2018
                Support for GNU                                    Likelihood of a GNU

                                     Favour GNU if                                         Somewhat/
              5%                                                  12%
                                     there's no                                            very likely
                                     clear victory
                                                                              41%          Not very/Not
    35%                              Oppose GNU
                                                                                           at all likely

                         60%                                                               Refused/
                                     Refused/Don't          47%                            Don't know
                                     know

Respondents were asked:
- If no presidential candidate achieves a clear victory, would you want Zimbabwe to have a
Government of National Unity (GNU)?
- In your view, how likely is it that the main political parties will agree to share power in a second GNU?
(Note: Analysis includes all respondents.)

                                                                                                        56
Thank you

                       Follow our releases
                       on Twitter and
                       Facebook.

  Do your own analysis of Afrobarometer
  data – on any question, for any country
  and survey round. It’s easy and free at
www.afrobarometer.org/online-data-analysis.
                                              57
You can also read