Geospatial distribution and bypassing health facilities among National Health Insurance Scheme enrollees: implications for universal health ...
←
→
Page content transcription
If your browser does not render page correctly, please read the page content below
International Health 2021; 0: 1–11
https://doi.org/10.1093/inthealth/ihab039 Advance Access publication 0 2021

Geospatial distribution and bypassing health facilities among National

                                                                                                                                                  ORIGINAL ARTICLE
 Health Insurance Scheme enrollees: implications for universal health

                                                                                                                                                          Downloaded from https://academic.oup.com/inthealth/advance-article/doi/10.1093/inthealth/ihab039/6311356 by guest on 17 December 2021
                          coverage in Nigeria
                                                     a,b
                          David A. Adewole                 , Steve Reidc , Tolu Onid,e and Ayo S. Adebowalef,∗

    a
    Department of Health Policy and Management, Faculty of Public Health, College of Medicine, University of Ibadan, Ibadan, Nigeria;
b
 Department of Public Health & Family Medicine, Division of Public Health Medicine, University of Cape Town, Cape Town, South Africa;
 c
   Primary Health Care Directorate, Faculty of Health Sciences, University of Cape Town, E47 OMB Groote Schuur Hospital, Observatory,
    Cape Town 7925, South Africa; d Medical Research Council Epidemiology Unit, University of Cambridge, Cambridge, UK; e Division of
Public Health Medicine, School of Public Health and Family Medicine, University of Cape Town, Cape Town, South Africa; f Department of
                   Epidemiology and Medical Statistics, Faculty of Public Health, University of Ibadan, Ibadan, Nigeria
                               ∗ Corresponding   author: Tel: +2348034052838; E-mail: daadewole@com.ui.edu.ng

              Received 5 December 2020; revised 15 March 2021; editorial decision 9 June 2021; accepted 17 June 2021

           Background: This study was carried out to enable an assessment of geospatial distribution and access to health-
           care facilities under the National Health Insurance Scheme (NHIS) of Nigeria. The findings will be useful for effi-
           cient planning and equitable distribution of healthcare resources.
           Methods: Data, including the distribution of selected health facilities, were collected in Ibadan, Nigeria. The
           location of all facilities was recorded using Global Positioning System and was subsequently mapped using ArcGIS
           software to produce spider-web diagrams displaying the spatial distribution of all health facilities.
           Results: The result of clustering analysis of health facilities shows that there is a statistically significant hotspot
           of health facility at 99% confidence located around the urban areas of Ibadan. The significant hotspot result is
           dominated by a feature with a high value and is surrounded by other features also with high values. Away from
           the urban built-up area of Ibadan, health facility clustering is not statistically significant. There was also a high
           level (94%) of bypassing of NHIS-accredited facilities among the enrollees.
           Conclusions: Lopsided distribution of health facilities in the study area should be corrected as this may result in
           inequity of access to available health services.

Keywords: bypassing, geospatial mapping, health insurance, healthcare access, Nigeria, universal health coverage.

Introduction                                                             challenges.6 Health outcomes are poor in Nigeria: life expectancy
                                                                         at birth is 54 y, birth attended by skilled health staff is 43% of the
The magnitude and nature of determinants of access to health-            total and the under 5 mortality rate is 120 per 1000 live births.7
care differ between and within countries.1,2 This also determines        The poor performance of the health system in Nigeria has been
the inequity of access to healthcare and thus difficulties in achiev-    attributed to inequity of physical access to available health facil-
ing universal health coverage (UHC).3 Access to care has been dis-       ities among other factors.5,8
cussed along with spatial availability and geographical accessibil-          The National Health Insurance Scheme (NHIS) was estab-
ity to healthcare facilities, among other dimensions.4 Geograph-         lished about 15 y ago to reduce inequity of access to care.9 How-
ical accessibility defines the extent to which distant facilities are    ever, studies that have been conducted about the NHIS have
patronised, especially in rural areas where healthcare facilities are    focused primarily on the financial function and related factors
inadequate in number and are also more spread out.4,5 Globally,          of inequity of access to the health system.10 Although the pri-
problems of spatial availability and geographical accessibility to       mary healthcare (PHC) level is the officially recognised point of
healthcare facilities are some of the health system’s identified         entry into the health system in Nigeria, under the NHIS, only the

© The Author(s) 2021. Published by Oxford University Press on behalf of Royal Society of Tropical Medicine and Hygiene. This is an Open Access
article distributed under the terms of the Creative Commons Attribution License (http://creativecommons.org/licenses/by/4.0/), which permits
unrestricted reuse, distribution, and reproduction in any medium, provided the original work is properly cited.

                                                                                                                                             1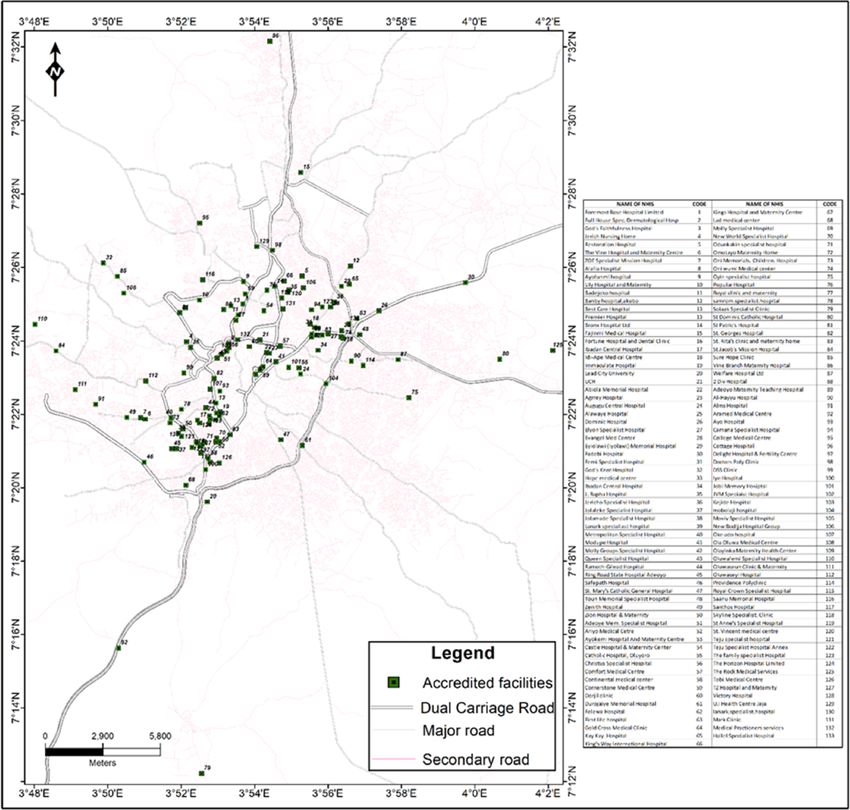
D. A. Adewole et al.

secondary and the tertiary levels of care are used for service provi-   Sampling strategy
sion.11 To the best of our knowledge, other factors with enormous
                                                                        A list of all healthcare facilities within the study area (11 LGAs),
impact on access to care, such as availability and geospatial dis-
                                                                        primary, secondary and tertiary care level facilities, was obtained
tribution of available healthcare facilities under the NHIS, have
                                                                        from the Oyo State Ministry of Health. Coordinates of all facili-
not been comprehensively studied in Nigeria. Thus, this study was
                                                                        ties, both NHIS-accredited and others that were not engaged by
limited to answering the basic question of physical availability of
                                                                        the NHIS, were determined using Global Positioning System (GPS).

                                                                                                                                                Downloaded from https://academic.oup.com/inthealth/advance-article/doi/10.1093/inthealth/ihab039/6311356 by guest on 17 December 2021
and geographical accessibility to accredited healthcare facilities
                                                                        The location of all facilities was recorded using GPS and subse-
under the NHIS. This would enable a novel opportunity to assess
                                                                        quently mapped using ArcGIS software. Next, a list of all NHIS-
the physical access function of achieving UHC. It would also pro-
                                                                        accredited facilities within the study area was obtained from the
vide invaluable support for evidence-based planning and decision
                                                                        NHIS Oyo State Office in Ibadan. As for the choice of enrollees, 11
making on resource allocation in Nigeria and other similar set-
                                                                        NHIS-accredited health facilities, and 1 facility in each of the 11
tings. The findings will be useful in taking appropriate steps to re-
                                                                        LGAs, was selected by simple random sampling to make a total
duce physical inequity of access to available healthcare facilities
                                                                        of 11 facilities (selected across 11 LGAs). The selected facilities
and, by proxy, access to quality healthcare where such is avail-
                                                                        were visited and the number of enrollees in each of the selected
able. The results would be appropriate in other settings planning
                                                                        health facilities was verified. Proportionate allocation of the esti-
to implement similar reforms for UHC.
                                                                        mated sample size (420) was performed based on the number of
                                                                        enrollees across the selected NHIS-accredited facilities.

Materials and Methods                                                   Participant selection and GPS mapping
Study design and area                                                   A list of NHIS enrollees waiting to receive care in the outpatient
                                                                        section of a selected health facility was obtained from the med-
This was a multidisciplinary study with a descriptive cross-            ical records department of the facility. Eligible individuals were
sectional component and a geospatial mapping. It was con-               the principal enrollees or spouses (excluding dependents aged
ducted in the 11 local government areas (LGAs) of Ibadan, Oyo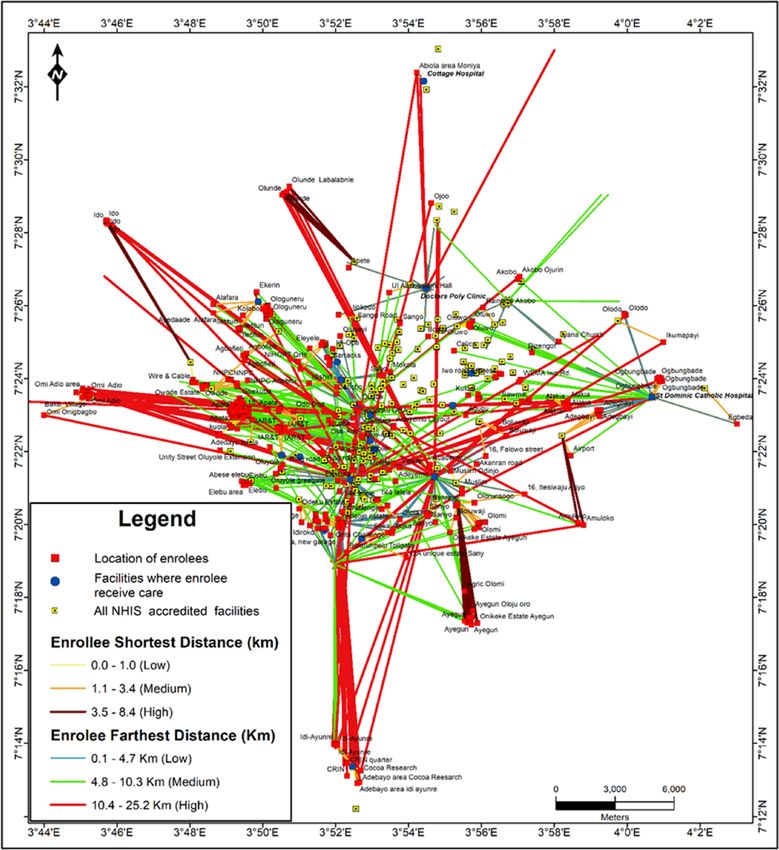
International Health

                                                                                                                                            Downloaded from https://academic.oup.com/inthealth/advance-article/doi/10.1093/inthealth/ihab039/6311356 by guest on 17 December 2021
Figure 1. Clustering analysis of accredited health facilities.

objective mathematical description of spatial point events in           Similarly, the locations of healthcare facilities utilised by re-
space. In this regard, it describes the spatial arrangement of      spondents (NHIS enrollee as indicated in the questionnaire)
both the NHIS-accredited and non-accredited facilities in Ibadan    were extracted from the list of NHIS-accredited facilities in the
in terms of whether they are clustered, random or regular.          metropolis. Coordinates of the facilities were obtained during
The analysis was computed at 5.0% significance level. For the       client interviews at those facilities. Therefore, these two data
NHIS-accredited facilities, whatever distribution pattern emerges   layers—enrollee’s residence (closest major landmark as proxy for
from the analysis has implications for enrollee accessibility and   residence) and location of healthcare facilities typically used by
utilisation of services provided by NHIS facilities.                enrollees—were used in the spatial analysis to identify the clos-
                                                                    est NHIS-accredited healthcare facility to each enrollee residence
                                                                    and to also estimate the distance between an enrollee’s location
                                                                    and each NHIS facility being utilised. The ‘Distance to the Nearest
Identification of enrollees’ nearest NHIS facility                  Hub (points)’ function in Quantum GIS (QGIS) V. 3.10 was used to
The identification of enrollees’ nearest NHIS facility was accom-   automatically assign enrollees to the nearest NHIS facility while
plished using the GPS locations of all accredited NHIS facilities   the ‘Join by lines (Hub Lines)’ functions were used to assign en-
in the metropolis. In addition, the approximate coordinates of      rollees to the NHIS facility they use. These two functions in QGIS V.
all the respondents interviewed in this study were also obtained.   3.10 provide not only the maps showing the connectivity, but also
Residential coordinates of the respondents could not be directly    information about distances between enrollees and their nearest
obtained through Open Data Kit Collect because respondents          NHIS facility, as well as the distance between enrollees and the
were interviewed outside of their residence. Hence, an accurate     NHIS facilities they have been using.
description of their residence was requested, with a view to us-
ing other methods to estimate their residential coordinates. Each
enrollee’s street address was searched for on Google Earth satel-   Methods and discussion for nearest neighbor analysis
lite image and the search was enhanced by field knowledge of        The spatial pattern of health facilities in Ibadan was analysed
the names of the bus stops, major landmarks and streets clos-       using the nearest neighbour analysis (NNA) statistical algorithm
est to the places of residence of enrollees (obtained during the    in Arc GIS 10.4 software. A GPS device was used to determine
interview). Such locations were extracted from Google Earth as a    and record the locations (coordinates) of accredited NHIS and
single x and y coordinate.                                          other health facilities in the study area. The coordinates were

                                                                                                                                       3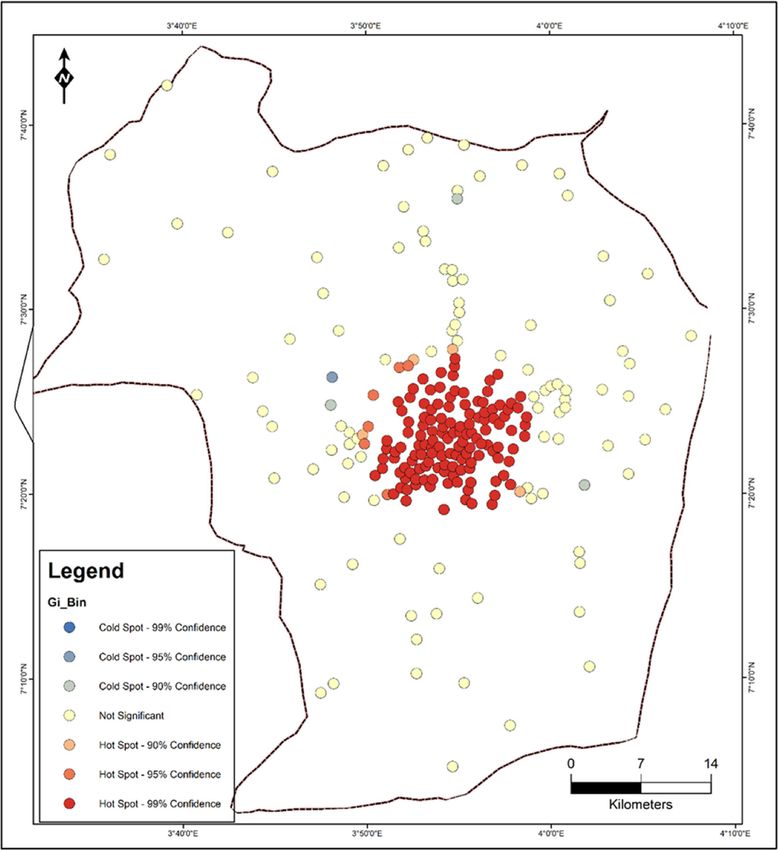
D. A. Adewole et al.

                                                                                                                                              Downloaded from https://academic.oup.com/inthealth/advance-article/doi/10.1093/inthealth/ihab039/6311356 by guest on 17 December 2021
Figure 2. Spatial pattern of health facilities in the study area.

subsequently imported to the ArcGIS software, where they were         (Table 1). Hence, there is significant clustering of healthcare fa-
mapped and overlaid on the administrative map of the Ibadan           cilities in some localities in Ibadan, resulting in unequal access to
metropolis. It should be noted that political boundaries of the       NHIS-accredited facilities in the metropolis.
study area were also digitised from a georeferenced map of the
Ibadan region using a projected coordinate system (UTM 31N).
    The coordinates of the health facilities, as well as the shape-   Cluster analysis of health facilities in Ibadan
files of the study area, were saved in the same projected coor-       To further show the degree of clustering of the result, the cluster
dinate system (UTM Zone 31 N) for better analytical results. The      analysis ‘optimised hot spot’ tool in ArcGIS V. 10.4.1 was used.
average NNA was used to analyze the spatial pattern of distribu-      Hotspot analysis was used to identify neighbourhoods/localities
tion of the healthcare facilities. The result shows that the spa-     with the clustering. The resultant Z-score is used to identify
tial pattern of health facilities distribution in the study area is   whether a neighbourhood can be characterised as a hotspot or a
clustered (Figure 1). Thus, given the z-score of 9.990117, there      cold spot. A high z-score and a low p value for a feature indicates
is a less than 1% likelihood that this clustered pattern could be     a significant hotspot, while a low negative z-score and small
the result of random chance. The result of the analysis shows         p value indicate a significant cold spot. The higher (or lower)
that Rn 0.842974 (Rn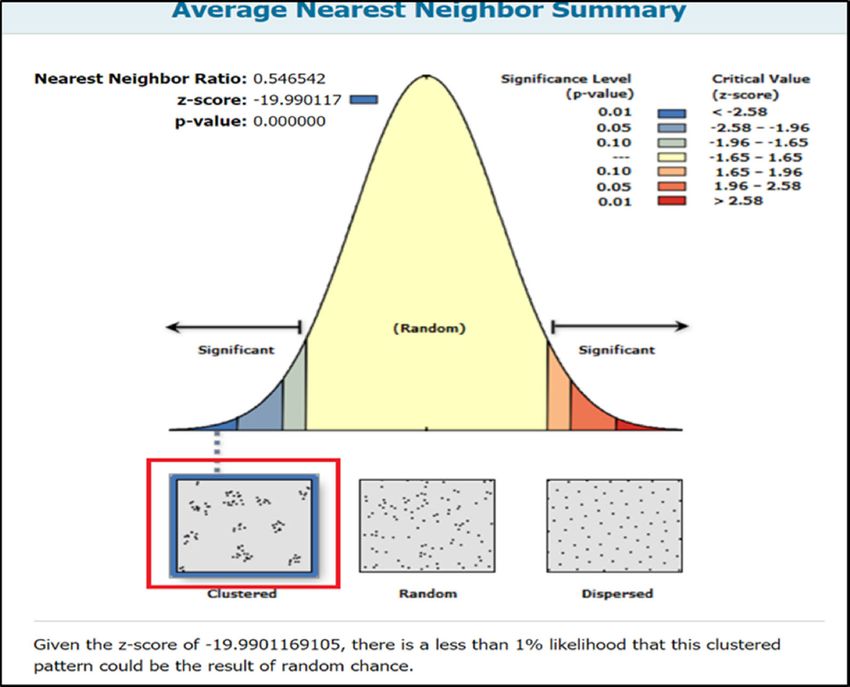
International Health
Table 1. Statistics of nearest neighbour analysis of health facilities in Ibadan
Observed Expected Area of
No. of mean mean study
Facility facilities Z-score p-value distance (m) distance (m) Rn-value (m2 ) Pattern
Downloaded from https://academic.oup.com/inthealth/advance-article/doi/10.1093/inthealth/ihab039/6311356 by guest on 17 December 2021
Health facility 531 -9.990117 90% of all study participants
did bypass nearby health facilities to receive care. The average
distance covered by an individual study participant was 1.096–
5.914 km (Table 4).
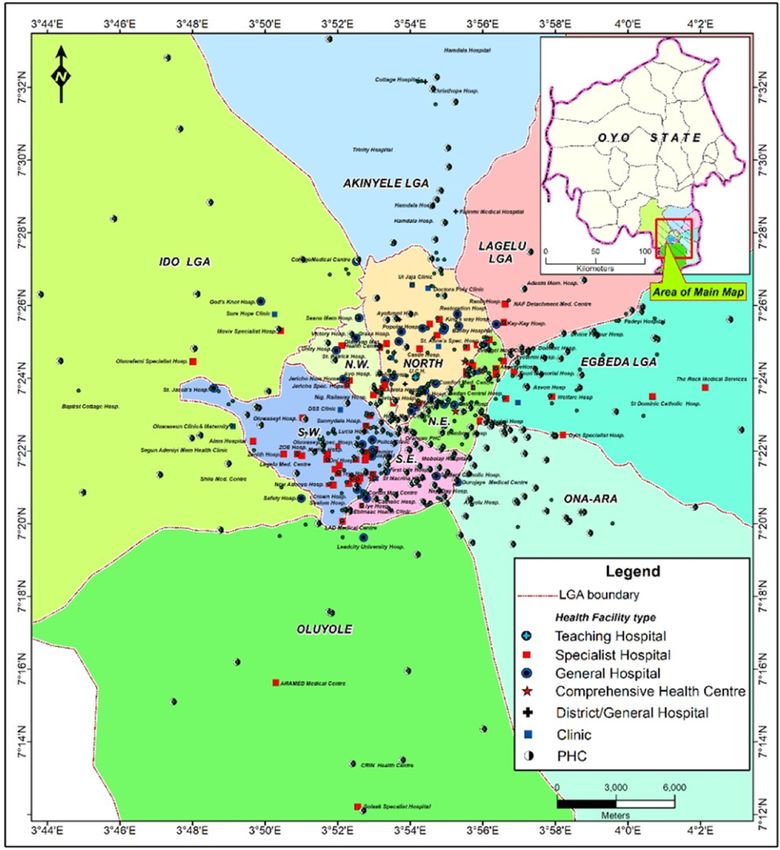
Results Figure 3 shows the geospatial relationship between the 11
Table 2 shows the population of urban and semiurban (rural) LGAs that constitute the study area. It also shows various types
LGAs. The urban LGAs’ population was 1889776 (53.4%) of the of healthcare facilities providing services at different levels of
total population in the 11 LGAs. It should be noted that the to- care, that is, primary, secondary and tertiary. These facilities be-
tal number of healthcare facilities in the urban LGAs was higher long to both the public and private sectors. From Figure 3, it can
only by 18 (3.1%) than it was in the semiurban LGAs. Population be seen that most of the facilities are clustered within the centre,
coverage under the NHIS was 103 313 (5.5%) of the total popu- which corresponds to the five inner core LGAs of Ibadan, while
5D. A. Adewole et al.
Table 3. Health facility bypassing status of enrollees
Bypassed Non-bypassing
Serial no. Patronised health facility No. % No. % Total
Downloaded from https://academic.oup.com/inthealth/advance-article/doi/10.1093/inthealth/ihab039/6311356 by guest on 17 December 2021
1 Teju 59 98.3 1 1.7 60
2 St. Mary 59 100 0 0.0 59
3 St. Marello 29 100 0 0.0 29
4 St. Dominic 30 81.1 7 18.9 37
5 Cottage Police Clinic 39 95.1 2 4.9 41
6 Lafia 63 100 0 0.0 63
7 LAD 39 81.1 9 18.9 48
8 Jericho 14 100 0 0.0 14
9 Immaculate 50 100 0 0.0 50
10 Doctor’s Polyclinic 10 66.7 5 33.3 15
11 Chrisbo 13 86.7 2 13.3 15
Total 405 94.0 26 6.0 431
Table 4. Average distance travelled by enrollees bypassing health facilities
Average distance travelled
Serial no. Hospital Shortest distance (km) Longest distance (km)
1 Chrisbo 1.095 2.732
2 Doctors Polyclinic 1.021 3.731
3 Immaculate 1.141 7.617
4 Jericho 0.763 3.805
5 Lad 0.513 6.062
6 Lafia 1.157 7.329
7 Police Cottage 0.833 5.709
8 St. Marello Catholic 1.932 8.595
9 St. Mary Catholic 1.752 7.234
10 St. Dominic 0.978 6.156
11 Teju 0.866 6.089
Total average 1.096 5.914
the peripheral areas of the city, which contain the remaining Figure 5 is a map that shows the geospatial relationship be-
six LGAs, had few healthcare facilities scattered within them. It tween NHIS-accredited facilities and enrollees’ residences. En-
should be noted, however, that PHC facilities have a better spread rollees receive healthcare services in accredited facilities. How-
throughout the 11 LGAs and were most prominent in peripheral ever, while some patronised health facilities that were closest
LGAs compared with secondary and tertiary level facilities. to their residence, the majority did so in health facilities that
Figure 4 shows only the NHIS-accredited facilities in the study were further away from where they (i.e. the enrollees) lived, as
area. Similar to the distribution of all other facilities, includ- indicated by the longer straight lines. Also, the majority of en-
ing those that were not providing services under the NHIS, rollees seemed to patronise facilities that were located in the
the majority of these facilities were clustered within the inner centre of the study area, which corresponds to the five inner
five LGAs of Ibadan, while the peripheral parts of the city had LGAs. Evidence of this was demonstrated by the heavy traf-
sparsely distributed NHIS-accredited health facilities. The same fic lines towards the centre of the map compared with the
reason as provided above is sufficient to explain this distribution thinner lines, which indicate lighter traffic and are thus less
pattern. travelled.
6International Health
Downloaded from https://academic.oup.com/inthealth/advance-article/doi/10.1093/inthealth/ihab039/6311356 by guest on 17 December 2021
Figure 3. Types of health facilities in the study area.
Discussion distribution of healthcare facilities within the study area may not
be unconnected with the city’s growth, which tends to be cen-
In this study, we found that most of the healthcare facilities in the trifugal in nature, with the result that the further away one trav-
study area were clustered within the inner core of Ibadan, while els, the sparser healthcare facilities become. This may also have
the peripheral areas of the city had few and scattered health fa- to do with the availability of infrastructure, such as better road
cilities. However, the distribution of PHC facilities was more equi- networks, as well as population density, which are more likely
table than secondary and tertiary facilities across all the LGAs in to be higher in the core inner areas of cities than in periurban
the study area. The observed pattern of spread of health facili- areas.
ties in the current study corroborated the pattern found in earlier The current study shows that the city of Ibadan contains
studies conducted in Nigeria and elsewhere.17,18 The pattern of healthcare facilities at different levels in a centripetal pattern.
7D. A. Adewole et al.
Downloaded from https://academic.oup.com/inthealth/advance-article/doi/10.1093/inthealth/ihab039/6311356 by guest on 17 December 2021
Figure 4. NHIS-accredited facilities in the study area.
This suggests that healthcare services are available and could be For this, the number of PHC facilities in a LGA was determined by
accessed by those who need them, provided other factors such as the number of administrative wards in that LGA. As such, PHC fa-
geographical access are not constraining issues. While the pres- cilities are widespread in both rural and urban areas, constitut-
ence of a social health insurance scheme does not guarantee ing >85% of all healthcare facilities at the rate of almost one
access to needed services,19 the presence of a social health in- PHC facility per ward throughout the country.11 From this pic-
surance scheme, as is found under the NHIS, has the potential ture, achieving UHC would have been more equitable if PHC fa-
to minimise financial constraint as a factor of inequitable ac- cilities were engaged as service providers. Countries with remark-
cess to available healthcare. Yet access to healthcare in Nigeria able achievement towards UHC have been reported to engage
is poor and is worse in semiurban and rural areas.5 The avail- the first level of care of the health system in service provision.
ability of healthcare facilities and geographical accessibility are In Rwanda, Ghana and Brazil, PHC facilities were engaged as ser-
some of the factors that determine access to healthcare services. vice providers. The involvement of the lowest level of care in addi-
It should be noted that PHC facilities were not engaged by the tion to higher levels contributed to the successful health reform
NHIS to provide services to enrollees, yet PHC facilities had the for UHC in these countries.20,21 In Nigeria, however, despite the
most equitable geospatial spread of the three levels of care, as availability of widespread PHC facilities in both urban and rural
was demonstrated in the maps. The Nigerian government has areas, these centres were not utilised as service providers under
adopted the PHC level as the entry point into the health system. the NHIS.
8International Health
Downloaded from https://academic.oup.com/inthealth/advance-article/doi/10.1093/inthealth/ihab039/6311356 by guest on 17 December 2021
Figure 5. Spatial relationship between enrollees’ residence, closest and furthest NHIS-accredited facilities for care.
Grossly, the distribution of total healthcare facilities in the service users. The literature shows an association between the
study area was skewed in favour of urban settlement, even al- distance to receive care and adverse health outcomes. Small dis-
though the population difference between the two parts of the tances from health facilities were associated with a higher like-
city was not substantial. In a similar manner, population cover- lihood of child mortality. It also increased the chances of non-
age by the NHIS in the urban area was much better than it was use of health facilities.2 An association between long distances
in the semiurban settlement.9 This is despite closer proximity of to health facilities and poor health outcomes has been reported
semiurban settlement to the metropolis. The situation is worse in among victims of snakebite in Nigeria.8 Distance between resi-
the remote rural areas.22 It is not clear how the country intends dence and health facilities has been shown to shape healthcare-
to achieve UHC with the current pattern of distribution of health seeking behaviour, as the longer the distance then the less likely
facilities and the non-involvement of the PHC centres as service people are to patronise such facilities and the more likely they are
points. What is clear, however, is that countries that have had en- to adopt unsafe alternative care.5 Non-utilisation or a delayed use
couraging performance on the way to achieving UHC made use of health services with increase in distance between residence
of the lowest levels of care, which are incidentally the closest to and health facilities have been reported in much earlier studies
9D. A. Adewole et al.
in Nigeria,23,24 with consequently poor health outcomes.25 How- between actual participants’ residential locations and the land-
ever, the clustering of most of these facilities in the centre of the marks used as proxies was 300–500 m. It is acknowledged that
city is suggestive of better access to healthcare among those who using landmarks as proxies for participants’ residential locations
reside in the urban area than among those who reside in semiur- could affect the distance measurements. We accept all these as
ban and rural areas of the city. However, it has been shown that limitations.
proximity to a healthcare facility does not necessarily translate to
Downloaded from https://academic.oup.com/inthealth/advance-article/doi/10.1093/inthealth/ihab039/6311356 by guest on 17 December 2021
better health facility patronage.19
When individuals patronise a facility that is further away in- Conclusions
stead of the facility with the lowest travel cost, this phenomenon In contrast to developed economies, GIS studies are not common
is called bypassing.23 In our study there is evidence of the degree in sub-Saharan Africa, however, they are highly relevant to solv-
of bypassing of NHIS-accredited facilities among NHIS enrollees. ing the high burden of diseases and other health-related chal-
The geospatial pattern and distribution of the facilities chosen for lenges in the region.6 The current study has provided invaluable
care, and a numerical equivalent (and proportion) of those who findings that are not common in health system assessment in
bypassed the closest health facility to receive care in the selected this environment, and therefore would be useful for evidence-
study facilities, are evidence of bypassing in the study area. Over- based, decision-making policies in health planning and efficient
all, the rate of bypassing varied across facilities. The majority of allocation of health resources by need in population groups. This
those who bypassed seemed to be unaware of this. This tends to will assist in minimising inequity of access to required healthcare
support the hypothesis that study participants may not be aware resources and services,31 which, judging by the findings in this
of closer facilities to their residences. study, is more likely to be worse in the rural areas of Nigeria and
The average distance travelled to access care was 1–6 km. in other similar settings.2,5
Many factors have been put forward for the bypassing phe-
nomenon. Previous studies that have studied bypassing of health
facilities26,27 have portrayed the phenomenon as a simple delib-
erate action on the part of healthcare consumers seeking a bet- Authors’ contributions: DAA conceptualised the study, analysed the
ter quality health service. Inadequate knowledge of clients of the data and wrote the manuscript. SAA performed the analysis of the data
availability of closer health facilities is another likely reason. Al- with DAA. SR, TO and SAA reviewed the manuscript with useful sugges-
though this factor was not explored, stigmatising illnesses such tions. All authors approved the final manuscript.
as TB and HIV/AIDS could lead to individuals preferring a facility
further away from home rather than one that is closer.28 Other Funding: Special thanks to Postgraduate Academic Mobility for African
factors that have been cited as probably responsible for bypassing Physician Scientists (PAMAPS) for the part-sponsorship of the PhD Pro-
could be exigencies such as the location of healthcare facilities gramme at the University of Cape Town, South Africa. All other funding
close to workplaces, frequently patronised areas such as market- necessities were provided by David A. Adewole.
places, as well as residences of family members and friends.29
This study claims that the phenomenon of bypassing actually Competing interests: The authors declare that they have no competing
took place in this study population. This claim is reinforced by the interests.
reason that almost all (94.0%) of the study population did actu-
ally bypass, that is, it was too large a number for a non-routine Ethical approval: Ethical approval to conduct the study was sought
and obtained at the Oyo State Ethical Review Committee (ref. no. AD
event such as referral to account for. This is more so that the pro-
13/479/596). Likewise, the research was approved by the Ethics Commit-
cess of selection of study population employed probability sam-
tee of the University of Cape Town, South Africa, HREC (ref. 536/2018).
pling methods. However, irrespective of the reasons behind the The design of the work conforms to standards currently applied in Nige-
(bypassing) phenomenon, travelling long distances to access care ria. Study participants’ consent was sought and obtained.
may result in poor health outcomes.2 Thus, the government and
other stakeholders must endeavour to address the responsible Data availability: The datasets used and/or analysed during the current
factors as appropriate. study are available from the corresponding author on reasonable request.
Euclidean metric (straight-line distance between two points)
was used as proxy for spatial access to health service points (fa-
cilities). It is noteworthy that this method does not take into con-
sideration topographic and infrastructural barriers such as ele- References
vations, slopes, water bodies and other physical barriers on the 1 Chou CF, Barker LE, Crews JE, et al. Disparities in eye care utilization
way to accessing healthcare in facilities. It is acknowledged that among the United States adults with visual impairment: findings from
these barriers could be taken care of by other methods such as the behavioral risk factor surveillance system 2006-2009. Am J Oph-
the network analysis method for distance measurement. How- thalmol. 2012;154(6 Suppl):25.
ever, it should be noted that Euclidean measures are acceptable, 2 Karra M, Fink G, Canning D. Facility distance and child mortal-
considering the cost and time in resource-poor settings, where ity: a multi-country study of health facility access, service utiliza-
travel is largely done by walking through largely non-motorised tion, and child health outcomes. Int J Epidemiol. 2017;46(3):817–
pathways, and where there is a lack of actual travel time and 26.
cost data and self-reported travel time is usually inaccurate.30 3 Ogundele OJ, Pavlova M, Groot W. Examining trends in inequality in
The scope of the current work could not accommodate the rea- the use of reproductive health care services in Ghana and Nigeria.
son for bypassing as it was observed in this study. The distance BMC Pregnancy Childbirth. 2018;18(1):492.
10International Health
4 Peters DH, Garg A, Bloom G, et al. Poverty and access to health care 19 Lagomarsino G, Garabrant A, Adyas A, et al. Moving towards universal
in developing countries. Ann N Y Acad Sci. 2008;1136(1):161–71. health coverage: health insurance reforms in nine developing coun-
5 Okeke TA, Okeibunor JC. Rural-urban differences in health-seeking for tries in Africa and Asia. Lancet. 2012;380(9845):933–43.
the treatment of childhood malaria in south-east Nigeria. Health Pol- 20 Atun R, de Andrade LO, Almeida G, et al. Health-system re-
icy. 2010;95(1):62–8. form and universal health coverage in Latin America. Lancet.
6 Makanga PT, Schuurman N, von Dadelszen P, et al. A scoping review 2015;385(9974):1230–47.
Downloaded from https://academic.oup.com/inthealth/advance-article/doi/10.1093/inthealth/ihab039/6311356 by guest on 17 December 2021
of geographic information systems in maternal health. Int J Gynaecol 21 Machado CV, Silva GAE. Political struggles for a universal health sys-
Obstet. 2016;134(1):13–7. tem in Brazil: successes and limits in the reduction of inequalities.
7 World Bank. Health Indicators: Nigeria. Country Profile. The World Global Health. 2019;15(Suppl 1):77.
Bank. 2021. Available at https://databank.worldbank.org/views/ 22 Federal Ministry of Health Nigeria. National Strategic Health Devel-
reports/reportwidget.aspx?Report_Name=CountryProfile&Id= opment Plan (NHSDP) 2010-2015. Abuja, Nigeria; 2010. Available
b450fd57&tbar=y&dd=y&inf=n&zm=n&country=NGA [accessed at https://www.uhc2030.org/fileadmin/uploads/ihp/Documents/
February 28, 2021]. Country_Pages/Nigeria/Nigeria%20National%20Strategic%
8 Iliyasu G, Tiamiyu A, Daiyab F, et al. Effect of distance and delay in 20Health%20Development%20Plan%20Framework%202009-2015.
access to care on outcome of snakebite in rural north-eastern Nigeria. pdf [accessed Jun 3, 2020].
Rural Remote Health. 2015;15(4):3496. 23 Akin JS, Hutchinson P. Health-care facility choice and the phe-
9 Federal Ministry of Health Nigeria. Strategic Review of Nigeria’s Na- nomenon of bypassing. Health Policy Plan.1999;14(2):135–
tional Health Insurance Scheme. Abuja Nigeria, 2014. 51.
10 Arin D, Hongoro C. Scaling up national health insurance in Nigeria: 24 Stock R. Distance and the utilization of health facilities in rural Nigeria.
learning from case studies of India, Colombia, and Thailand. Wash- Soc Sci Med. 1983;17(9):563–70.
ington, DC: Futures Group. The Health Policy Project, 2013. 25 Kadobera D, Sartorius B, Masanja H, et al. The effect of distance to
11 Labiran A, Mafe M, Onajole B, et al. Human resources for health formal health facility on childhood mortality in rural Tanzania, 2005-
country profile–Nigeria. Africa Health Workforce observatory. 2008. 2007. Glob Health Action. 2012; 5:1–9.
Available at https://www.who.int/workforcealliance/knowledge/ 26 Tanou M, Kamiya Y. Assessing the impact of geographical access
resources/hrh_profile_nigeria/en/ [accessed December 4, 2020]. to health facilities on maternal healthcare utilization: evidence from
12 Adelekan I. Ibadan city diagnostic report. Urban Africa risk knowl- the Burkina Faso demographic and health survey 2010. BMC Public
edge, 2016. Health. 2019;19(1):838.
13 National Population Commission Nigeria. Census 2006. Abuja Nigeria; 27 Wong KLM, Benova L, Campbell OMR. A look back on how far to walk:
2006. Available at http://population.gov.ng/ [accessed December 4, Systematic review and meta-analysis of physical access to skilled care
2020]. for childbirth in Sub-Saharan Africa. PLoS One. 2017;12(9):e0184432.
14 Mohammed S, Bermejo JL, Souares A, et al. Assessing responsiveness 28 Onyeonoro UU, Chukwu JN, Nwafor CC, et al. Evaluation of patient
of health care services within a health insurance scheme in Nigeria: satisfaction with tuberculosis services in southern Nigeria. Health Serv
users’ perspectives. BMC Health Serv Res. 2013;13:502. Insights. 2015; 8:25–33.
15 Kish L. Survey sampling. 1965. 29 Yao J, Agadjanian V. Bypassing health facilities in rural Mozambique:
spatial, institutional, and individual determinants. BMC Health Serv
16 ESRI, inventorArcGis Desktop. Redlands, CA: Environmental Systems Res. 2018;18(1):1006.
Research Institute; 2012.
30 Sanders SR, Erickson LD, Call VR, et al. Rural health care by-
17 Chowdhury AI, Abdullah AYM, Haider R, et al. Analyzing spatial and pass behavior: how community and spatial characteristics affect
space-time clustering of facility-based deliveries in Bangladesh. Trop primary health care selection. J Rural Health. 2015;31(2):146–
Med Health. 2019;47:44. 56.
18 Wong KLM, Radovich E, Owolabi OO, et al. Why not? Understand- 31 Macharia PM, Ouma PO, Gogo EG, et al. Spatial accessibility to
ing the spatial clustering of private facility-based delivery and fi- basic public health services in South Sudan. Geospat Health.
nancial reasons for homebirths in Nigeria. BMC Health Serv Res. 2017;12(1):510.
2018;18(1):397.
11You can also read