Get More from A Score - Using a Single Test to Deliver Multiple Measurements - Scantron
←
→
Page content transcription
If your browser does not render page correctly, please read the page content below
Get More from A Score
                          Using a Single Test to Deliver Multiple Measurements

                          One of the biggest complaints that parents, teachers, and
                          administrators have today is “too much testing!” These stakeholders
                          express strong concern that as new standards are adopted, testing
                          will increase even further.

Combine Spring high-stakes testing and the prep for that with the testing often
required for grade or program placement, growth measurement, universal screening,
and other measurement needs, and you can understand the concern. Administrators
are starting to address these concerns directly, including an announcement by the
Council of Chief State School Officers:

          “Assessments should complement each other in a way that
          defines a coherent system of measures. Assessments should be
          administered in only the numbers and duration that will give us
          the information that is needed and nothing more. Multiple
          assessments of the same students for similar purposes should be
          minimized or eliminated.” 1

What if there were a single test you could administer two to four times a year that
took less than an hour to provide a coherent system of measures?

It turns out that there is: Scantron’s computer-adaptive assessment solution,
Performance Series.

Increase Assessment Flexibility
So what is computer-adaptive testing? Simply
put, computer-adaptive testing (CAT) adjusts
to the ability level of the student. As a student
answers correctly, he or she is presented with
a harder question on the same topic. If a
student answers incorrectly, he or she is
presented with an easier question. The test
continues in this way through the units or
topics being tested until the system identifies
a consistent pattern in responses.

1 "Commitments from CCSSO and CGCS on High-Quality Assessments."Http://www.ccsso.org/. Council of Chief State School Officers, 15
     Oct. 2014. Web. 29 Oct. 2014.

Get More from A Score: Using a Single Test to Deliver Multiple Measurements                                      Page | 1
© 2019 Scantron Corporation. All rights reserved.
Scantron and the Scantron logo are registered trademarks of Scantron Corporation.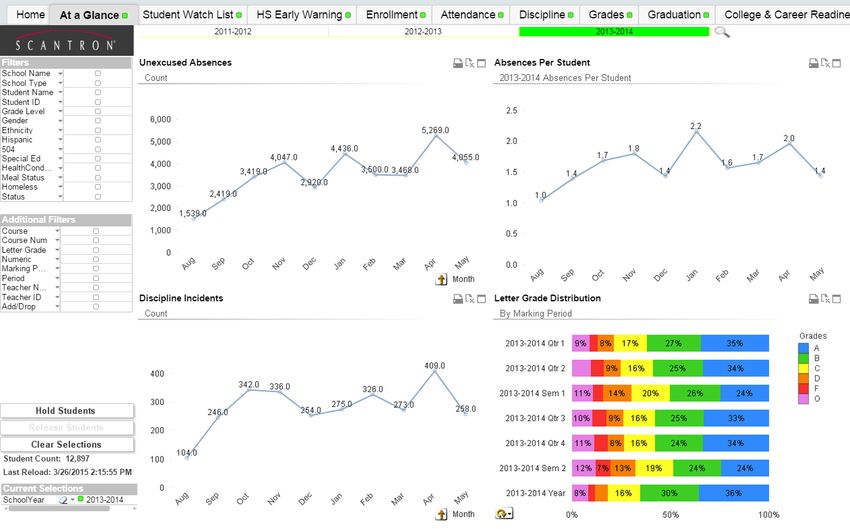
From there, the test analyzes the complete pattern of
                                                responses to determine an estimate of the student’s
                                                ability.

                                   The student’s ability estimate is presented as a scaled
                                   score, which is simply a translation of the ability
                                   estimate and represents that student’s relative
                                   position on a common vertical scale for that subject. 2
                                   The vertical scale ranges across the continuum of
learning in that subject for all grade levels (as shown to the left).

A CAT is more flexible than fixed-form testing, especially for core subjects. Struggling
students never feel overwhelmed, and high achievers feel challenged, while students
who perform more in the center of the testing bell curve are also presented with the
correct level of the material, allowing everyone to be evaluated as accurately as
possible.

As shown above, the amount of measurement information you get from a fixed-form
test can be limited for the struggling student (left-hand side) or the high achiever
(right-hand side). Because a CAT adjusts to the student, you can efficiently assess a
broader range of knowledge in less time, giving you a strong educational foundation to
build on.

So far, so good. Any computer-adaptive measure offers similar flexibility. But what
does Scantron deliver to take it to the next level?

2    Performance Series uses the Item Response Theory (IRT) Rasch model to estimate student ability; the standard
     error of measure (SEM) associated with each ability estimate is also provided.

Get More from A Score: Using a Single Test to Deliver Multiple Measurements                           Page | 2
© 2019 Scantron Corporation. All rights reserved.
Scantron and the Scantron logo are registered trademarks of Scantron Corporation
Intelligent (Re)Start
Intelligent Start configures Performance Series to remember the ability level that
student attained on a particular subject, and starts that student with an appropriate
item difficulty level the next time that student takes a test in the same subject. 3 Even if
the student transfers to another school in the district, Performance Series will start his
or her next test at the correct level as long as that student has the same student ID.

Why do you care? Intelligent Start ensures that a student begins subsequent
assessments at the ability estimate where he or she left off on a prior (same subject)
test. This allows subsequent test administrations to be of shorter duration since the
student does not have to again demonstrate prior knowledge. Intelligent Start also
remembers the student ID so when a student moves to a new school or program
within the district, memory of the student’s ability estimates are maintained in the
system. This allows the student to avoid having to start all over again, making it easier
to assimilate the student instructionally into the new class.

Intelligent Start ensures you don’t waste valuable testing and instructional time
covering and re-covering material where the student is already proficient. Students
can pick up where they left off, and teachers get a current and accurate picture of
student achievement.

Testing Accommodations: Grade Level Modification
You can use Grade Level Modification to set a student’s initial Performance Series test
to begin at a different point than their currently assigned grade level. This means that
if you already know the student is performing significantly above or below grade level,
you can adjust the test starting point to make the test easier or more challenging for
the student as needed.

Why do you care? Grade Level Modification allows students to begin a test closer to
their actual ability level when a student is significantly lower- or higher-performing.

Grade Level Modification reduces testing time by presenting initial questions
appropriate to the student’s level of knowledge as identified by the modification you
set. Students known to be struggling are not presented with initial material above their
capabilities, thus reducing their overall frustration. Students known to be high
performing start a level closer to their proficiency, reducing their boredom and
ensuring they remain engaged with the test. In addition, students at both ends of the
spectrum get a shorter, more focused assessment that provides a score with
enhanced accuracy.

3    Intelligent Start is different for each specific subject (e.g., Mathematics is a different subject and test from Algebra, which is
     different from Geometry, etc.).

Get More from A Score: Using a Single Test to Deliver Multiple Measurements                                                   Page | 3
© 2019 Scantron Corporation. All rights reserved.
Scantron and the Scantron logo are registered trademarks of Scantron Corporation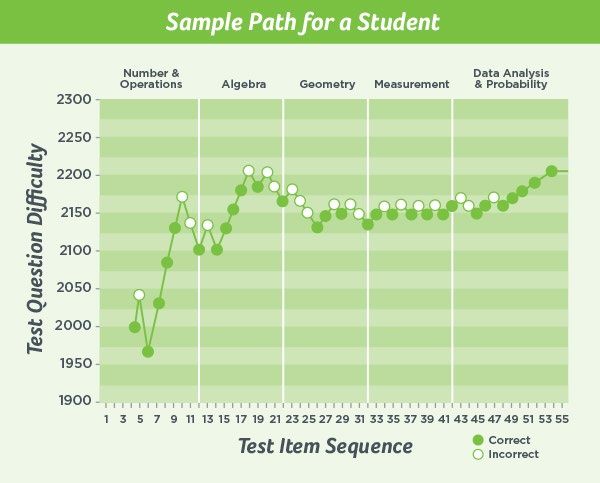
Testing Irregularities
Performance Series automatically spoils a test if the student appears to be randomly
selecting answers or if the system detects other testing irregularities. If, for example, a
student answers five consecutive questions within 15 seconds and gets three or more
of them wrong, Performance Series flags that test for irregularities.

Why do you care? Automatically checking for testing irregularities provides an
additional level of control over the trustworthiness of your scores. When a test is
automatically spoiled, the original results are removed from the system and the
student starts the test fresh, providing an opportunity for closer proctoring, some
other accommodation, or both.

Test Spoiling
You can also manually spoil a test. Sometimes students are simply not ready to be
tested that day. They may be very young and experiencing attention-span issues.
They may be feeling ill and are thus not at their best. They may be behaviorally
challenged and having an agitated day or difficulty focusing on any task. Regardless of
the reason, manually spoiling a test enables you to clear the slate so they can retake
the test anew on a better day, without negatively impacting their academic record.

Why do you care? When you spoil a test, the original results are removed from the
system and the student starts the test fresh. Performance Series does not retain the
earlier effort, which means you get a result you can count on to truly reflect the
student’s ability.

Test spoiling can also save time and effort. An observant teacher or proctor can
usually spot a student in distress, and simply have them stop the test immediately. You
do not need to wait until a test is complete to spoil it.

Test Length
Performance Series Express provides a shorter, 25-question version of the standard
Performance Series test. Using the same subjects and item pools as the standard test,
PS Express provides flexibility with an eye on the clock. You can view the same reports
as you receive for the standard test, including reports at the student, class, and district
levels.

Please note: Since any short-form test relies on fewer questions to determine the
ability level, the standard error of measure (SEM) is higher, resulting in a slightly less
precise ability estimate. Consider your requirements around the balance of higher
precision vs faster testing when you decide whether to use a shorter form test.

Why do you care? Because Express is shorter, it reduces the burden on overbooked
computer labs and school network bandwidth, something that is especially important
during Spring when testing time is at a premium due to summative testing. It can also
be beneficial for students who have difficulty paying attention and/or maintaining
focus. A shorter assessment enables these students to better demonstrate their true
ability without experiencing testing fatigue.

Get More from A Score: Using a Single Test to Deliver Multiple Measurements        Page | 4
© 2019 Scantron Corporation. All rights reserved.
Scantron and the Scantron logo are registered trademarks of Scantron Corporation

Although Scantron recommends using the standard PS test two to four times a year to
establish baselines and provide growth measurement, some of our clients use PS
Express more often throughout the year to gather results more frequently so they can
adjust instruction accordingly.

National Norms
Scantron regularly gathers national norm data for each subject area, providing a
national peer group to serve as a basis for score comparison. This norm group includes
more than 70,000 students tested in the Spring and Fall. 4 Each group is representative
of the gender/ethnicity composition of the nation as a whole.

Why do you care? Comparing student scores against a national norm group provides
further insight into your students that you can use for reporting and additional
analysis—including easy and immediate comparative reporting on annual measureable
objectives (AMO). Knowing where students rank against a national peer group can
help you focus on college and career readiness more easily. Consider the availability of
recent, regular, and comprehensive norming studies when you are choosing a CAT
provider. Scantron’s lengthy experience in the market and early adoption of this crucial
research means Performance Series already includes the results of multiple years of
norming data and analysis.

Solve more needs with a single measurement vehicle
          “Too often, students take tests that are designed to be used for a
          single purpose. Better assessments and more coordination among
          educators, from the classroom to the central office to the state
          education department, would allow students to take fewer formal
          assessments during the course of the year without sacrificing our
          ability to have crucial feedback about how students are learning.” 5
          David Hespe, New Jersey Acting Commissioner of Education

For more than a decade, Scantron has rigorously developed and frequently refreshed
the Performance Series item pools. Items are pre-aligned to state standards and to the
Common Core—in many cases written expressly to support Common Core and Next
Generation Science Standards (NGSS)—so they can be used to reflect adequate yearly
progress (AYP), AMO, and other state or national measurement requirements.

A single Performance Series test returns a variety of scores, including:
   • Scaled Score
   • National Percentile Ranking (NPR)
   • Lexile® measures (Reading tests only)
   • Performance Rating (with custom research study)

4    Winter norms are also available. Rather than creating an independent Winter norm group, an interpolation of Winter norms was
     developed. Assuming linear growth between fall and spring, the distribution that would have occurred midway between fall and
     spring was estimated. As a result, the interpolated Winter norm scores for each content area were calculated as the average of the
     Fall and Spring norm scores.
5    "Chief State School Officers, Urban School Leaders Offer Statements of Support for Commitments on High-Quality Assessments."
     Http://www.ccsso.org/. Council of Chief State School Officers, 15 Oct. 2014. Web. 29 Oct. 2014.

Get More from A Score: Using a Single Test to Deliver Multiple Measurements                                            Page | 5
© 2019 Scantron Corporation. All rights reserved.
Scantron and the Scantron logo are registered trademarks of Scantron Corporation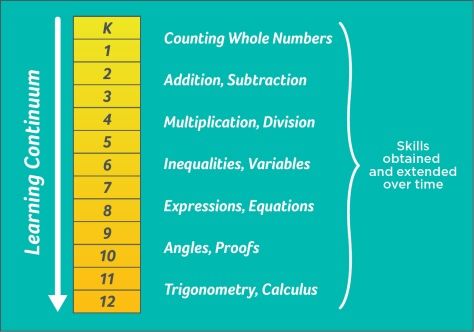
That’s nice, you say, but how can I use these scores to understand my students and
improve their achievement? Let’s explore.

Detailed Reports
Performance Series offers extensive reporting so you can get the most out of your
scores, such as:

     •    Student / Parent data
             o Profile Templates, containing information to share with students and
                parents, with different layouts covering growth trends, specific scores,
                and skills to focus on. Available in English and Spanish.
             o Suggested Learning Objective (SLO) Reports (see Personalized
                Learning/Individualized Instruction, below, for details)
     •    Teacher / Instructional data
             o Class Profile, containing information regarding current scores with
                grouping options on either scores or instructional level by skill
             o Student Detail Report, showing groups of students who have
                demonstrated success or are experiencing challenges, by skill
             o Suggested Learning Objective (SLO) Reports (see Personalized
                Learning/Individualized Instruction, below, for details)
             o Class Standard Student Detail Reports, which shows whether students
                achieved specific selected education standards. This helps you know
                what areas in which to support the student and to provide his or her
                additional learning resources.
             o Gains Analysis Reports, providing yearly gain targets to maintain
                progress with national peers and evaluation of that progress as the
                year continues
             o Performance Band Reports, containing information that enables
                placement based on norm comparison or custom, predictive research
                categories
     •    Administrative / Evaluation Data
             o Summary Reports, providing a quick view of all student subject scores
                with average and score distribution
             o Gains Reports, so you can review test gains by group, location or grade
                across summer or within a school year
             o Gains Analysis Report that demonstrate/evaluate gains against norms
                and growth categories
             o Performance Bands that evaluate recent test scores for grouping and
                resource allocation, or for predictive categories (with custom research)
             o Predictive Validity Reports (available with a custom predictive validity
                study); see High Stakes Test Prediction later in this article

As you view each type of report listed above, you can drill deeper into the information,
narrowing your focus until you get exactly the data you need (e.g., school, class, or
individual student). These reports can be filtered by time frame, customizable student
groups, and a variety of demographics to aggregate and disaggregate results.

Get More from A Score: Using a Single Test to Deliver Multiple Measurements        Page | 6
© 2019 Scantron Corporation. All rights reserved.
Scantron and the Scantron logo are registered trademarks of Scantron Corporation
Personalized Learning/Individualized Instruction
In addition to the aggregate reports, one of the tools our clients cite as a key reason
they chose Performance Series over other CAT solutions is the student profile. In fact,
customers are enthusiastic about the entire reporting experience in Performance
Series.
The student profile breaks down performance scores by subject into a visual report
you can use to explore specific needs. Needs are further specified via the Student
Learning Objectives (SLO) report, which details the specific standards—not just
strands—where additional instruction or guidance may be necessary. The SLO report is
also available at the class level. The class-level report helps you determine whether the
entire class needs additional instruction, as well as identifying specific groups of
students who may be struggling with the material so you can form study groups or
other classroom-level interventions.
SLO down—there’s more! The SLO report doesn’t stop with this identification,
however. One of the strongest benefits Scantron has to offer is tight relationships with
multiple instructional resource partners. Other CATs may offer a similar connection,
but it’s usually into their own curricula, limiting the resources available to you. Because
Scantron is your assessment and analysis partner, we focus on best assessment
practices, balanced cognitive complexity coverage, and deep understanding of and
alignment to your chosen standards. To this end, we’ve established partnerships to
provide integrated connections to a variety of instructional resources:
• netTrekker® by Knovation® supplies access to targeted instructional resources.
All netTrekker’s resources are curated by education experts to ensure high
quality. By accessing these materials through the SLO, the netTrekker search is
pre-completed, sending you directly to more than 300,000 resources relating
to the skills and standards you need to target.
• Various Edgenuity® solutions, such as Odyssey® , MyPath® , Hybridge® , or
Pathblazer® , which can automatically import Performance Series scores and
guide you in creating a personalized learning path for each student.
• Classworks® , which assists teacher in creating individual learning exercises and
targeted classroom instruction based on Performance Series test results.
Scantron continually seeks out and adds new resource partners to help you get
the most out of your results so you can bridge the gap between assessment
and instruction.
Growth Measurement
Growth measurement is simply comparing two scores on a similar (or identical)
test on the same subject, given at a minimum of two different times in the school
year (typically in the Fall and Spring). The difference between these two scores
can be considered to represent the student’s academic growth in that subject
during that time.
How districts use growth measures varies widely. Some use it strictly to monitor
student growth within a domain (e.g., Math or Reading) at specified intervals (we
Get More from A Score: Using a Single Test to Deliver Multiple Measurements Page | 7
© 2019 Scantron Corporation. All rights reserved.
Scantron and the Scantron logo are registered trademarks of Scantron Corporationrecommend two to four times a year) across the school year. Some use smaller measures to monitor student progress more frequently. Some districts use growth measurement as one of the elements in their educator effectiveness programs. Regardless of how your district uses the results, Scantron’s Performance Series can provide effective growth measures. Because scores are reported against a common vertical scale, a significant increase in score beyond the SEM truly reflects an increase in proficiency of the skill being measured. Instead of devising additional measures, simply administer Performance Series at appropriate intervals, and then use the results (from either the standard or the Express form) as a yardstick. Universal Screening Universal screening is part of a Response to Intervention (RTI) framework. You need a baseline measure of where all students are within foundational skills (such as Math and Reading), and to repeat that measure at least two more times during the year to identify growth. So far, that sounds a lot like the basic growth measurement we discussed previously. However, universal screening applies an additional layer: determining which students may fall into an instructional tier where they need additional intervention with a progressive plan of increasing intensity to return them to grade-level (or whatever growth goal you set). Using a computer-adaptive assessment like Performance Series for screening provides the baseline view you need for all students. If you are using such an assessment anyway, Performance Series helps you continue that measure over time within an RTI framework and identify individual growth and gains. You can identify specifically how a student has improved from their baseline, not just that they still “do not meet standards,” where some CATs stop. Performance Series’ support for customized performance bands, combined with customizable student groups, even helps you see, easily and graphically, how identified students are improving. Using Performance Series as a screener helps you reduce your testing footprint, freeing up instructional time and precious school network bandwidth. Program Placement Identifying students for program placement can be tricky. Many of the factors to be considered are subjective: Is this student ready academically and socially to move up a grade? Does he or she have the study skills and drive to be a good candidate for a particular track such as GATE, Advanced Placement, or International Baccalaureate? Would a program like AVID help this student succeed? Performance Series adds an academically-based, objective measure to the discussion, supplementing the subjective analysis. Its vertical scaling, national norming, and grade level estimates provide objective test scores and comparative ranking to specify overall subject readiness. SLOs identify which specific skills students have attained so you can be sure the placement doesn’t overextend their identified abilities and put them in a potentially negative “catch-up” loop. Get More from A Score: Using a Single Test to Deliver Multiple Measurements Page | 8 © 2019 Scantron Corporation. All rights reserved. Scantron and the Scantron logo are registered trademarks of Scantron Corporation
High Stakes Test Prediction (with predictive validity study)
Scantron doesn’t stop with simply providing a test mechanism. Our assessment
experts and psychometricians conduct a variety of research studies for our clients,
including predictive validity studies to determine how closely Performance Series
scores map to scores students can be predicted to achieve on one or more selected
high-stakes state summative or college entrance exams.

Once a study is completed, you can then administer Performance Series as you would
anyway—but you can use the same scores for an additional purpose: identifying how a
student is predicted to perform on state grade-level tests (such as California’s STAR
test or Louisiana’s LEAP) or college-readiness exams (such as ACT® or SAT® ). You
can use the student profile and Suggested Learning Objectives that you receive as a
matter of course to help fill any gaps before the student takes that all-important test
to help them succeed.

Prediction is a moveable feast, however. State summative tests change every few
years. As we’ve all seen over the years, educational standards themselves are adapted
and adjusted to better match the world in which our students must function and
succeed.

When considering predictive validity studies, look for a partner who is in this for the
long haul, with significant experience and expertise in prediction studies. Make sure
your research partner has the stamina and know-how to not only conduct the study,
but maintain it in the face of the only constant there is: change.

Scantron doesn’t just conduct the study, turn in a white paper, and dust our hands off
after a job well done. Teachers, parents, and students don’t need yet another thing to
read—they need actionable information and concrete, specific recommendations.
Scantron delivers.

In addition to a research report documenting the
results of the study, we integrate results directly into
your Performance Series subscription, via already-
established predictive validity reports you can access
from our reports area. For each study, you can access a report that shows the
likelihood (expressed as a confidence percentage) for each student’s predicted
performance category on the summative test.

A cautionary note: Predictions are valid and reliable, with the understanding that the
student continues to receive the same amount and quality of instruction. What this
means for educators is that interventions should be examined and planned carefully to
avoid the risk of sacrificing a predicted high performance by one student for the sake
of improving a predicted low performance for another. In addition, high-performing
students need continual challenge—use predictive data to add to instruction as
appropriate for all students, not just the students experiencing difficulties.

Get More from A Score: Using a Single Test to Deliver Multiple Measurements        Page | 9
© 2019 Scantron Corporation. All rights reserved.
Scantron and the Scantron logo are registered trademarks of Scantron Corporation
For example, based on Performance Series scores, Student A is predicted to have a
high score on the state summative exam. Student B is predicted to have a low score. If
you make an instructional change to support improving Student B’s score, and this
change reduces the support Student A was getting, Student A may not score as well
as predicted. Plan to use prediction reports to determine who needs extra help, not to
shift help from one student to another.

Standards Tracking
Performance Series is criterion-based. This means that over the years, items have
evolved to be aligned to and even written expressly to support a wide variety of
standards documents, including college-and-career-ready standards and the Next
Generation Science Standards (NGSS), as well as the most recent educational
standards developed by your state.

To view Performance Series scores in light of these standards, all you have to do
is select the standards document to be referenced. We can even create standards
connections to more than one standards document so you can still use the scores
even if you’re transitioning between standards systems. The appropriate discrete
standards (not just strands) appear in a variety of reports—without having to
administer multiple tests or deconstruct the strands into specific standards or
skills yourself!

Further, this standard-level connection informs the SLO’s recommendations of
additional instructional resources provided by our partners. As previously noted, the
SLO uses whatever standard or combination of standards you select to support your
efforts to improve student growth and achievement.

This deep, standard-level connection between test results and standards means you
automatically receive the detailed information you require to tailor your next
instructional steps to specific student needs and achievements. Create study groups.
Design lesson plans to support specific standards where you’ve identified a gap. You
can even create individual additional homework assignments for specific students to
help them get back on track. The data you need to adjust instruction is right at your
fingertips.

Transform result data into actionable knowledge
We’ve already discussed the wide variety of reports available directly in Performance
Series. Scantron believes that there is another step in the data-driven instructional
transformation: true, multi-dimensional analytics.

To that end, we’ve partnered with Qlik® , a leading provider of advanced analytics
technology, to combine their data analysis platform with our decades-long
experience in educational data. The result is Scantron Analytics, a powerful tool
you can use to truly explore your student data, making connections and gaining
insights never before possible.

Get More from A Score: Using a Single Test to Deliver Multiple Measurements        P a g e | 10
© 2019 Scantron Corporation. All rights reserved.
Scantron and the Scantron logo are registered trademarks of Scantron Corporation
Spreadsheets are a common way of analyzing data, but looking at a spreadsheet of
test scores can only help you answer the question “How did the students do on this
test?” To know how that compares to other tests, for example: how benchmark
assessments relate to state summative scores, you need another spreadsheet. Then
you have to combine them into a single view and add a chart to visualize the data.
Then, if you want to know whether attendance played a role in the scores, you have to
overlay yet another spreadsheet using advanced functions and formulae. This process
is sometimes manageable for confirming relationships that you already suspect to be
true. It does not, however, help you identify relationships between seemingly unrelated
variables.

To avoid a spreadsheet maze and bias associated with data familiarity, some districts
opt to build a data warehouse to pull together all the pieces of information needed to
build a complete picture of the student. However, this can be expensive, time-
consuming, and resource-intensive. And that’s just to set it up, without analyzing the
data it contains. The analytics component can add yet more time and cost, and often
results in a rigid set of query paths written to answer a limited number of questions.

Fortunately, there’s a powerful, yet simple, solution that helps you explore your data
and answer your own questions, as you think of them (and even those that you don’t).
Scantron Analytics automatically and securely consumes data from a variety of
sources: your student information system, ACT® , SAT® , state-determined high-stakes
tests, interim assessment measures (including Performance Series), and much more.

Get More from A Score: Using a Single Test to Deliver Multiple Measurements        P a g e | 11
© 2019 Scantron Corporation. All rights reserved.
Scantron and the Scantron logo are registered trademarks of Scantron Corporation
Dynamic, interactive dashboards provide a starting point to explore your data. From a
district-wide view, one click gets you down to a school, a class, or even an individual
student record. Another click can instantly disaggregate results, grouping them by
demographics such as gender, ethnicity, Special Ed status, Free and Reduced Lunch,
or student groups that you define—whatever data grouping helps you answer your
questions. Scantron Analytics also includes an ability to define a cohort of students
based on any criteria you choose, such as a specific Performance Band in an
Performance Series test, and then analyze related information for that cohort, such as
their attendance or grades. Access to longitudinal data makes cohort analysis even
more powerful—a single click can take you back to prior years’ results.

A world-class analytics solution breaks the barrier between information and
knowledge. You can immediately see the connections and patterns (both expected
and unexpected) that enable you to make decisions based on information instead of
guesswork. You can see the relationships between disparate data and use that
knowledge to make decisions that help your students succeed—easier and faster than
ever before.

How can Scantron help?
Scantron has an extensive track record providing digital assessment solutions for
computer-adaptive and fixed-form approaches, as well as world-class item banks, to
help thousands of customers succeed in developing assessments that measure and
accelerate student growth.

“Scantron’s computer-adaptive diagnostic test, Performance Series, delivers a single
score you can use for a variety of measures,” says Nikki Eatchel, Chief Assessment
Officer. “Being able to measure so many different elements with a single assessment
saves our clients time and effort, reducing test overload while improving the
information you get about each student’s attainment of crucial skills and standards.”

Scantron introduced our first computer-adaptive measure more than a decade ago,
and added our fixed-form digital assessment platform not long after. We’ve been
evolving our platform and content ever since, increasing our understanding of the
instructional shifts in educational standards and balanced cognitive rigor, and
reflecting that understanding in our item banks and tests.

We’ve helped districts with workshops and consulting for content development
processes as well as working with customers to provide high-quality, aligned content.
We’ve validated educator assessment efforts and demonstrated positive impact to
student learning with research studies ranging from determining growth targets to
predictive validity studies.

Beyond assessment vehicles, Scantron offers Scantron Analytics, powered by the
leading “big data” analytics engine: QlikView. Scantron Analytics presents up-to-date
information through highly visual, easy-to-understand dashboards. By storing all
information in memory, Scantron Analytics delivers powerful analytics without the
need for a separate data warehouse. Using information you’re already collecting,

Get More from A Score: Using a Single Test to Deliver Multiple Measurements        P a g e | 12
© 2019 Scantron Corporation. All rights reserved.
Scantron and the Scantron logo are registered trademarks of Scantron Corporation
sourced from a wide variety of educational systems, Scantron Analytics displays easy-
to-read, graphical dashboards and data visualizations. Important trends and previously
hidden connections jump out, so you can spend your time developing creative
solutions instead of trying to make sense of rows and columns of numbers.

Whatever the assessment assistance you need, Scantron has the products, tools,
services, and expertise to help you ensure that you have the right program for your
students. Our award-winning web-based software, combined with our comprehensive
suite of assessment services, help you get the most out of your assessments and
results. Use the following checklist to identify considerations important to your
assessment requirement and see how Scantron can meet you where you are and help
you get to where you want to be.

Contact Us:
1.800.722.6876
www.scantron.com/k12
Scantron Corporation. 1313 Lone Oak Road, Eagan, MN 55121

Get More from A Score: Using a Single Test to Deliver Multiple Measurements        P a g e | 13
© 2019 Scantron Corporation. All rights reserved.
Scantron and the Scantron logo are registered trademarks of Scantron Corporation
CHECKLIST
Are You Getting Enough from One Score?
Questions to Ask Yourself About Your Computer-Adaptive Test (CAT)
Is your CAT flexible? Does your CAT remember the ability level the student last attained on the test? If it
does, will it automatically restart the student’s next test at that level?
Can you configure your CAT to let you adjust a student’s starting grade level to account
for known accommodation needs (above or below current grade level)?
Does your CAT identify testing irregularities and automatically spoil the test if it
detects them? If the system spoils a test, is the spoiled test cleared from the student’s
record so he or she starts over fresh?
Can you manually spoil a test if a student is having a bad experience that day? If you
spoil a test, is the spoiled test cleared from the student’s record so he or she starts
over fresh?
Does your CAT provide a long form and a short form to accommodate a variety of
testing needs or free up computer lab time?
Does your CAT include national norms so you can compare your students to a national
peer group? Does your CAT partner perform their own norm studies directly or merely
link to norming done through connected resources? How often is it refreshed?
How many needs does Do you get a vertically scaled score? A grade level estimate? A national percentile
your CAT score serve? ranking/normal curve equivalent? Does your score include Lexiles®?
Can you define performance bands to suit your needs?
Does your CAT partner also provide research services so your scores can include a
performance rating?
Can you access a wide variety of student, parent, teacher, and administrative reports?
Can reports be aggregated and disaggregated by different student populations? Does
your CAT include a student or class profile you can use to access additional linked
instructional materials?
Can you use your scores to demonstrate growth? Do reports include gains and gains
analysis data as well as score summaries?
Can you easily use your results for universal screening, measuring students against their
own results, rather than just “does not meet standards”?
Can you use the scores as part of program placement? Can you track results to specific
standards, or merely to high-level strands?
Can your CAT partner perform research for a predictive validity rating against a selected
high-stakes test?
Can you connect to Does your CAT provider link to an analytics engine that lets you explore your data
deeper analytics? visually, rather than wading through spreadsheets?
INFORM INSTRUCTION For a free consultation to evaluate your
TO IMPACT STUDENT assessment needs, call 800.722.6876 or
ACHIEVEMENT TODAY! visit us at www.scantron.com/k12.
© 2019 Scantron Corporation. All rights reserved.You can also read