NUTRITIONAL ASSESSMENT IN OLDER ADULTS : MNA 25 YEARS OF A SCREENING TOOL & A REFERENCE STANDARD FOR CARE AND RESEARCH; WHAT NEXT?
←
→
Page content transcription
If your browser does not render page correctly, please read the page content below
J Nutr Health Aging. 2021;
© The Author(s)

             NUTRITIONAL ASSESSMENT IN OLDER ADULTS : MNA® 25 YEARS
             OF A SCREENING TOOL & A REFERENCE STANDARD FOR CARE
                          AND RESEARCH; WHAT NEXT?
                                                                  Y. GUIGOZ, B. VELLAS
                               Gerontopole, Toulouse University Hospital, INSERM UMR 1027, University of Toulouse, France. Corresponding author:
                                           Yves Guigoz, Chemin du Raidillon, CH-1066 Epalinges, Switzerland. yves.guigoz@gmail.com

                   Abstract: A tool to assess nutritional status in older persons was really needed. It took 5 years to design the
                   MNA® (Mini Nutrition Assessment) tool, complete the first validations studies both in Europe and in the U.S.
                   and to publish it. After the full MNA®, the MNA® short form and the self-MNA® have been validated. As well as
                   Chinese and other national MNA® forms. Now more than 2000 clinical research have used the MNA® all over the
                   world from community care to hospital. At least 22 Expert groups included the MNA® in new clinical practice
                   guidelines, national or international registries. The MNA® is presently included in almost all geriatric and
                   nutrition textbook and part of the teaching program for medicine and other health care professional worldwide.
                   The urgent need is to target the frail older adults more likely to have weight loss and poor appetite and to prevent
                   frailty and weight loss in the robust. We present in this paper the review of 30 years of clinical research and
                   practice using the MNA® worldwide.

                   Key words: Nutrition, MNA, aging.

                      Introduction and short history                                     assessment including nutritional intake, anthropometric
                                                                                         measurement, and biological biomarkers (e.g. albumin, pre-
   Malnutrition in older adults is a really important problem,                           albumin, CRP, α1-acid glycoprotein, cholesterol, triglycerides,
occurs 40% more often in the older ones; and is identified in                            vitamins A, D, E, B1, B2, B6, and B12, folate, copper, zinc,
1 of 3 older adults in the hospital, and in 1 of 2 rehabilitation                        haemoglobin, and blood cell count). We did it in two different
patients (1). Subjects intake is often poor from lack of appetite,                       populations in Toulouse area, France and in Albuquerque, NM,
most adults in the hospital eat less than 50% of the served food                         USA. Subjects were classified using principal component and
at each meal and the proportion of patients with malnutrition                            discriminant analysis. Principal component analysis indicated
increases during hospital stay (2, 3).                                                   that the MNA® can be used without clinical biochemistry.
   A tool to assess nutritional status in older persons was really                       Threshold value ranges for risk of malnutrition and malnutrition
needed. It is why in 1989 at my first IAGG conference in                                 were 22-24 points and 16-18 points, respectively, on a
Acapulco, I spoke about the MNA® idea with Yves Guigoz,                                  maximum of 30 points. Exact threshold values were then set by
from the Nestle International Research Center in Lausanne.                               cross-tabulation of cut-off values for serum albumin without the
I told him we must design and validate a tool for assessing                              presence of inflammation. We have been able to observe that
nutritional status in the elderly analogous following the MMSE                           those with an MNA® score less than 17.5 have usually protein-
tool for assessing cognitive functions. Because already most                             calorie undernutrition, those between 17 and 23 are at risk for
physician know that a total score of 30 is the maximum for                               malnutrition but have not yet protein-calorie undernutrition and
cognitive functions our total score for the MNA® must be also                            those > 23 have in general an adequate nutritional status (5-7).
at 30.                                                                                      In 2001, With Larry Rubenstein, from U.C.L.A we
                                                                                         developed validated the MNA ® Short-form (8). The MNA ®
    Validation of the MNA® full form, short form and self-                               short form includes 6 items to do a first steps to screen those at
                   management form (fig. 1)                                              risk for malnutrition. After completing the MNA® short form it
                                                                                         is still useful if the subjects are scored at risk for malnutrition
   It took us 5 years (1994) to convince our colleagues, to                              to complete the full MNA®. Carefully looking at the full MNA®
design the tool, to complete the first validations studies both in                       items to determine where the subjects lose point can help to
France and in the U.S. and to publish it (4, 5). We would like                           guide the nutrition intervention. For e.g. if we observe that a
to acknowledge Werner Bauer, former director of the Nestlé                               patient doesn’t eat on the evening we can propose something,
Research Center who took the decision to fund the study,                                 them if some subjects need help to eat… it takes few minutes
Phill Garry Ph.D., W.C Cameron Chumlea Ph.D., from the                                   to do the MNA® SF and it is already a very common used tool.
University of New Mexico Aging Process Study, Albuquerque,                                  In 2009 a Revised MNA® short-form (9) has been developed
NM, USA and our team at the Gerontopole, including Sylvie                                & validated as a stand-alone screening tool; it includes option
Lauque RD. We validated the MNA® screening versus the                                    for substituting calf circumference (CC) for BMI, and takes less
results from 2 physicians with all the current nutritional                               than 5 minutes. The MNA®-SF is available in 42 languages,
Received December 29, 2020
Accepted for publication January 4, 2021                                             1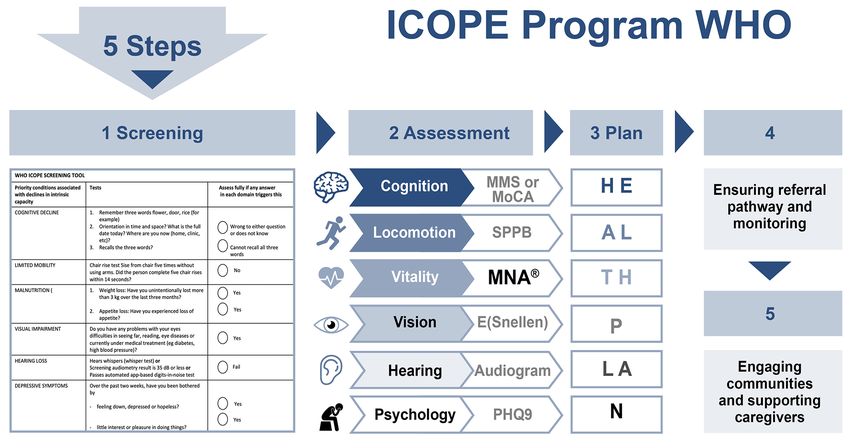
J Nutr Health Aging

                                       NUTRITIONAL ASSESSMENT IN OLDER ADULTS

                                                          Figure 1
                                                 MNA®: History & Development

https://www.MNA® -elderly.com. The validity of substituting            studies, used as reference standard to validate other screening
CC for BMI has been further validated (10-12).                         tools and compared to following screening tools : MUST, NRS-
   In 2012 the Self-MNA® was developed (13) and validated              2002, GNRI, SGA, PG-SGA, NRI, SNAQ, MST, and NUTRI
in community-dwelling older adults, results shared with their          score, in different settings, community, home care, nursing
family medicine (14). It takes 3-5 minutes. If we want to,             homes and hospitals (20, 30, 34, 42; 47, 53, 123, 181, 227-258).
improve the health of older persons self-management and                The sensitivity and specificity of the MNA® are 80% (SD 13)
participative care are very useful underlining the importance of       and 68% (SD 22), respectively, against a wide range of criteria
such tool (15, 16).                                                    in 40 studies (see table 15: MNA ® Sensitivity/Specificity
                                                                       against Nutritional assessment parameters & other parameters)
   MNA® use in clinical research                                       (140, 222, 227, 228, 235, 241, 246, 248, 259-287). The same is
   As we can see in table 1, more than 2000 clinical research          true for the MNA®-SF with a sensitivity of 87% (SD 10) and a
have used the MNA® all over the world on many topics from              specificity of 85% (SD 15) against the MNA®, and a sensitivity
frailty to hip fractures, from community care to hospital (see         of 81% (SD 18) and a specificity of 63 % (SD 20) against a
recent publications 2018-2020 (1, 14-226) and MNA ® and                wide range of criteria in 43 studies (Tables 16 & 17) (8, 12,
MNA®-SF tables Identifying the elderly at risk of malnutrition         20, 41, 54, 67, 140, 222, 227, 228, 230, 234, 235, 240, 247,
(Tables 2 – 13). We observed a prevalence of malnutrition of 5         266, 270, 278, 282, 284, 286, 288-307). In general, it can be
% (SE 0.1) and 4.3 % (SE 0.1) in the community for MNA® and            observed that MNA®-SF and MNA® are the most used tools to
MNA®-SF respectively; of 11 % (SE 0.2) and 11.0% (SE 0.3)              evaluate the risk of malnutrition in the elderly, independent of
for the frail elderly (outpatients and home care) respectively.        the setting, with high sensitivity, ≥ 80%, and a good specificity,
A Higher prevalence of malnutrition is observed in hospitals,          ≥ 60% (Tables 15 - 17), and see meta-analysis/systematic
22 % (SE 0.2) and 29 % (SE 0.3) for MNA® and MNA®-SF;                  review, reviews, and content validity (1, 43, 47, 149, 182, 221,
and for institutionalized elderly 18 % (SE 0.3) and 22 % (SE           308-320). MNA®-SF and MNA® are appropriate screening
0.4) respectively. Cognitively impaired elderly and Parkinson’s        and assessment tools for use in community-dwelling elderly
disease patients have similar prevalence to the frail elderly,         (321), and all other geriatric settings (205, 322-329). Further
14 % (SE 0.4), and 6.3 (SE 0.9) for MNA ®. (see Table 14:              the MNA®s are the only tools to evaluate the intake of nutrient-
Prevalence of malnutrition and risk of malnutrition in different       rich food groups, which allow for implementation of nutritional
settings).                                                             intervention. Discrepancies with other screening tools come
   The MNA® and MNA®-SF have been validated in many                    mainly from the dietary assessment and the difference in weight

                                                                   2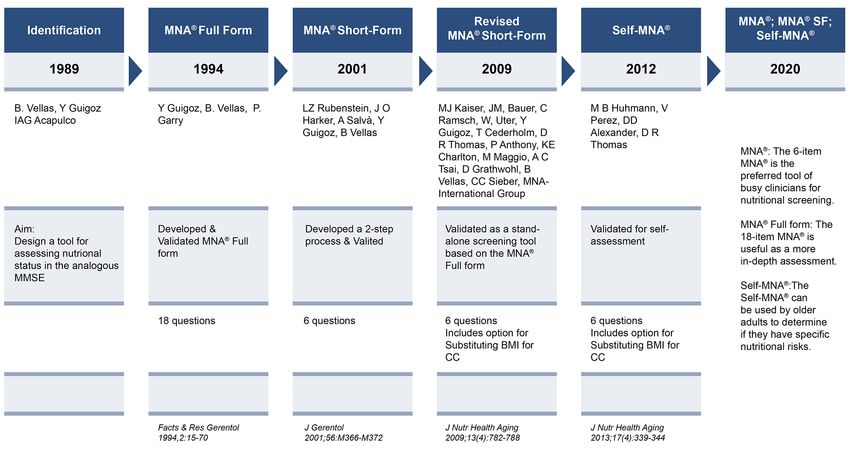
J Nutr Health Aging

                                        THE JOURNAL OF NUTRITION, HEALTH & AGING

                                                                Figure 2
                                                            The MNA® forms

                                                                Table 1
                                                          MNA®: Publications
             As of October 2020, at least 2500 articles have been published using the MNA®, covering a broad range topics

Search terms e.g. Medline                                                                                                  n Publications
Frailty / Sarcopenia
[(«Sarcopenia»[Mesh]) OR «Frailty»[Mesh] AND [«Mini Nutritional Assessment» OR MNA®-SF]                                         436
Functionality
«Physical Fitness»[Mesh] AND [«Mini Nutritional Assessment» OR MNA®-SF]                                                         365
Disability
«Disability Evaluation»[Mesh] AND [«Mini Nutritional Assessment» OR MNA®-SF]                                                    262
Community
[«Community Health Services»[Mesh] OR «Community Medicine»[Mesh]] AND [«Mini Nutritional Assessment» OR MNA®-SF]                405
Outpatient/Home care
[(«Home Care Services»[Mesh]) OR «Outpatients»[Mesh]] AND [«Mini Nutritional Assessment» OR MNA®-SF]                            405
Hospital setting
«Hospitals»[Mesh]AND [«Mini Nutritional Assessment» OR MNA®-SF]                                                                 387
Nursing home / Long term care
[(«Nursing Homes»[Mesh]) OR «Long-Term Care»[Mesh]] AND [«Mini Nutritional Assessment» OR MNA®-SF]                              483
Cognitively impaired elderly
[(«Memory Disorders»[Mesh]) OR «Dementia»[Mesh]] AND [«Mini Nutritional Assessment» OR MNA®-SF]                                 456
Total publications Medline
«Mini Nutritional Assessment» OR MNA-SF                                                                                        1604

loss evaluation. It is the only assessment tool assessing two              MNA® use in clinical practice
«functional concept» related to muscle and cognitive function.             At least 22 Expert groups included the MNA® in new clinical
MNA® can be improved by the addition of inflammatory factors            practice guidelines, national or international registries (113,
or other biological nutritional biomarkers when needed.                 116, 131, 132, 136, 151, 189, 190, 319, 324, 342-377). New
   The MNA® appears also to be useful as primary criteria               Global Leadership in Malnutrition (132) consensus publication
for intervention studies, and move positively in several major          outlines the diagnostic criteria for malnutrition, for application
studies (56, 89, 98, 330-334).                                          in clinical settings (131, 151). GLIM Committee involved
   Further, the MNA® appears useful to measure frail older              major global clinical nutrition societies: ASPEN, ESPEN,
persons, especially when the MNA® is between 17 and 23.5 (27,           FELANPE, PENSA representatives (Tables 18). 42 Electronic
286, 303, 335, 336). Malnutrition and physical frailty seem to          Health Record Software Companies have incorporated
be strongly related, however, they should be assessed separately        MNA® in software, 22 APPS for Smartphones, tablets have
within the geriatric assessment (313, 317, 326, 337-341).               incorporated MNA® (Table 19).

                                                                    3
J Nutr Health Aging
NUTRITIONAL ASSESSMENT IN OLDER ADULTS
Figure 3
W.H.O Icope Pogram
Notably, the MNA ® screening tool evaluates items that senior citizen and monitor their nutritional status, the aims of
are similar to relevant criteria that GLIM established for the ICOPE Monitor apps part of the Inspire program is to monitor
diagnosis of malnutrition (202, 378). Furthermore for the the main function including nutrition in older adults. The links
evaluation of malnutrition in the elderly, the MNA® with its two between Nutrition and Geroscience for a healthy aging have to
step procedure a) screening with MNA®-SF and b) nutritional be studied (396, 397).
status evaluation with the MNA® full form can be completed Perspective for the future have of course to treat
with evaluation of nutritional makers (e.g. as serum C-reactive undernutrition in sick old adults; however, the urgent need is to
protein and transthyretin (prealbumin) (379-386)) or the GLIM target the frail older adults more likely to have weight loss and
criteria (131, 206, 207, 223, 376, 387). This is of importance to poor appetite. To do it, program for early detection of the risk
separate malnutrition from inflammation, when undernutrition of malnutrition should be implemented as it is in development
is due to disease related cachexia (174, 380, 383, 388-391). in Netherlands (80, 81, 115, 184), the NUDAD (Nutrition, the
MNA® fulfill the two steps, screening followed by assessment, unrecognized determinant in Alzheimer’s disease) study (139,
required by the GLIM criteria procedure for the diagnosis of 398) and within the Integrated Care for Older People (ICOPE)
protein-energy malnutrition in elderly (376, 377), and provides with the implementation of the INSPIRE study (213, 394, 399).
guidance for nutritional intervention. Elderly with malnutrition Further the geriatric assessment to be comprehensive should
or at risk of malnutrition should have a nutritional intervention include the MNA®-SF as nutrition parameters and all the elderly
with multidisciplinary team in order to support adequate dietary detected at risk of malnutrition or malnourished should be
intake, maintain or increase body weight and/or improve further evaluated with GLIM criteria, and MNA® to be able to
functional and clinical outcome (184, 189, 190, 363, 392). implement a nutritional intervention. The best MNA® score to
predict healthy aging is still to be determined
MNA® and Healthy aging
Funding: Educational Research grant by Nestlé Research Center to develop the
For the W.H.O Healthy aging is the capacity to maintain MNA®. Publication fees and open access were funded by Nestlé Health Science.
function, to be able to do what we value. The ICOPE step 1
includes some nutrition assessment (weight loss, poor appetite), Open Access: This article is distributed under the terms of the Creative Commons
Attribution 4.0 International License (http://creativecommons.org/licenses/by/4.0/),
and MNA® is part of the ICOPE program step 2, Integrated care which permits use, duplication, adaptation, distribution and reproduction in any medium
of older persons (figure 3) to maintain functions in older adults or format, as long as you give appropriate credit to the original author(s) and the source,
(393-395). Our practice needs really to move to prevention provide a link to the Creative Commons license and indicate if changes were made.
and ambulatory care. We need to provide good nutrition to the
4J Nutr Health Aging
THE JOURNAL OF NUTRITION, HEALTH & AGING
Table 2
MNA®-SF Clinical practice: Community-dwelling elderly - Identifying the elderly/adults at risk of malnutrition
Setting Nutritional status evaluation [% of subjects] Reference
n Age [year] Under-nourished At risk of Well-nourished Pub Year CountryJ Nutr Health Aging
NUTRITIONAL ASSESSMENT IN OLDER ADULTS
Table 2 (continued)
MNA®-SF Clinical practice: Community-dwelling elderly - Identifying the elderly/adults at risk of malnutrition
Setting Nutritional status evaluation [% of subjects] Reference
n Age [year] Under-nourishedJ Nutr Health Aging
THE JOURNAL OF NUTRITION, HEALTH & AGING
Table 2 (Continued)
MNA®-SF Clinical practice: Community-dwelling elderly - Identifying the elderly/adults at risk of malnutrition
Setting Nutritional status evaluation [% of subjects] Reference
n Age [year] Under-nourishedJ Nutr Health Aging
NUTRITIONAL ASSESSMENT IN OLDER ADULTS
Table 3
MNA® -SF Clinical practice: elderly – Hospial Settings - Identifying the elderly/adults at risk of malnutrition
Setting Nutritional status evaluation
[% of subjects]
n Age Undernourished & At risk Well-nourished Pub Year Country Reference
of malnutrition
[year] 18 year 73 27 2010 Brazil Raslan M. et al. Nutrition
public university hospital 2010;26:721-726
Patients admitted to the 196 66 ± 13 41 59 2010 The Netherlands Hafsteinsdóttir T.B. et al. J
neurological and neurosurgical Clin Nurs 2010;19:639-648
wards
Hospitalised patients 101 ≥ 65 97 3 2011 The Netherlands Neelemmaat F. et al. J Clin
Nurs 20:2144-52
Short-stay geriatric department in 1306 85 ± 6 74 26 2012 France Dramé M. et al. Rev Epidemiol
nine French hospital centers Sante Publique 2012 ;60:189-
196
Patients admitted to three 106 79.4 81 19 2012 Spain Calvo I. et al. Nutr Hosp
different internal medicine units 2012;27:1619-1625
Patients undergoing Transcatheter 119 83.4 + 4.6 45 56 2013 Switzerland Schoenenberger A.W. et al. Eur
aortic valve implantation (TAVI) Heart J 2013;34:684-692
Patients ≥70 years with colorectal 143 75 (70-92) 27 73 2013 The Netherlands Aaldriks A.A. et al. Geriatr
cancer Oncol 2013 ;4:218-226
Elderly patients admitted for 142 71.8 ± 5.4 women 45 55 2015 China Zhou J. et al.Nutr J 2015
surgery 72.0 ± 5.9 men ;14:68
Older adults admitted to rural 57 79.1 7.3 88 12 2016 Australia Marshall S. et al. J Acad Nutr
rehabilitation facilities Diet 2016;116:795-801
Ambulatory patients with chronic 130 66.3 ± 11.5 26 74 2016 Germany Saitoh M. et al. Wien Klin
heart failure Wochenschr 2016;128:497-504
Geriatric trauma patients 50 84.9 ± 5 62 38 2016 Germany Goost H. et al. Technology
and Health Care 24 (2016)
225–239
Hospitalized patients of a 351 67.9 (28–91) 24 76 2018 Germany Ihle C. et al. BMC Musculos-
Department of Arthroplasty keletal Disorders 2018;19:83
Elderly, aged ≥ 65 years, 181 ≥ 65 58 42 2018 Spain Castro-Vega I. et al. Nutr Hosp
hospitalized 2018;35:351-358
Elderly patients with 255 76.5±4.8 48 52 2018 China Ye X-J. et al. BMJ Open.
gastrointestinal cancer 2018;8(4):e019750
Adult cancer patients (20-59.9 63 64.2 ± 12.0 68 32 2018 Brazil Lima E.M.B. et al. Nutr Hosp
years) and elderly patients (≥ 2018;35(5):1138-1144
60 years)
Adult vascular surgery patients at 322 67.6 ± 14.1 48 53 2019 Australia Thomas J. et al. Br J Nutr
hospital admission 2019;122:689-697
Outpatients ≥70 years at the 288 81.1 ± 6.6 64 36.1 2019 Spain Bolado Jiménez C. et al. Nutri-
Emergency Department of the tion 2019 ;66:142-1466
University Clinical Hospital of
Valladolid
Patients in themedical wards of 350 71.5 ± 8.0 5 95 2019 Nigeria Adebusoye, L. et al. Ghana
the University College Hospital Med J 2019;53(3):210-216
(UCH), Ibadan
Patients aged over 65 years with 76 80 72 28 2019 Poland Ostrowska, J. et al. J Hum Nutr
cardiovascular diseases Diet. 2019;32(1):119-127
Consecutive patients, admitted for 358 82 (76–86) 13 87 2020 Poland Magnuszewski L. et al. Int J
the first time to the department of Environ Res Public Health.
geriatrics 2020;17(13):4768
Older patients undergoing pace- 197 82.9 ± 4.9 46 54 2020 Switzerland Schoenenberger A.W. et al.
maker implantation BMC Geriatr 2020;20:287
Patients ≥50 years admitted in 520 61 (55–70) 95 5 2020 Togo Gbeasor-Komlanvi F.A. et
medical and surgical services of al.BMC Geriatr 2020;20:507
six hospitals in Togo
8J Nutr Health Aging
THE JOURNAL OF NUTRITION, HEALTH & AGING
Table 3 (continued)
MNA® -SF Clinical practice: elderly – Hospial Settings - Identifying the elderly/adults at risk of malnutrition
Setting Nutritional status evaluation
[% of subjects]
n Age Undernourished & At risk Well-nourished Pub Year Country Reference
of malnutrition
[year] 18 31 48 22 2014 U.S.A. Yost G. et al. Nutr Clin Pract.
advanced heart failure 2014;29(5):686-691
Acute care hospital patients on 1333 74 (65 - 97) 23.3 26 51 2014 Austria Dorner T.E. et al. J Nutr Health
admission Aging 2014 ;18:264-269
Inpatients diagnosed 169 79 ± 7 88 12 0 2014 Japan Wakabayashi H. et al. J Reha-
with hospital-associated bil Med 2014;46:277-282
deconditioning
Consecutive patients admitted to 526 58.5 ± 12 (22 – 85) 6 64 30.4 2014 Sri Lanka Pathirana A. K. SpringerPlus
the cardiology unit of a tertiary 2014 ;3:412
care hospital
aged patients consecutively 131 69.3 ± 8.2 43 47 10.7 2014 Egypt Abd-El-Gawad W.M. et al.
admitted to the acute geriatrics Clin Nutr 2014;33:1108-1116
medical ward of Geriatrics and
Gerontology department in Ain
Shams University hospitals, Cairo
Elderly patients hospitalized at a 141 73.5 ± 5.2 28 48 25 2015 Korea Baek M-H. & Heo Y-R. Nutr
geriatric care hospital Res Pract 2015;9:637-643
Patients with Postoperative Acute 150 >18 year 33 62 5 2016 Turkey Özbilgin Ş. et al. Medicine
Care Unit admission after general 2016;95:e5038
surgery, and surgery related to
orthopedics and urology
Hospitalized pre-dialysis patients 33 73 ± 7 46 39 15 2016 Turkey Buyukaydin B. et al. J
Aging Res Clin Practice
2016;5(3):158-161
Patients hospitalized in the 392 84.8 ± 6.3 14 44 42 2016 Switzerland Frangos E. et al.J Nutr Health
general geriatric and internal Aging 2016;20:705-713
medicine units
Older hip fracture patients, aged 472 84 (77-91) 9 42 49 2016 Finland Nuotio M. et al. Eur J Clin Nutr
≥ 65 years 2016;70:393-398
Orthopedic and traumatology 399 ≥ 65 7 27.3 65 2017 Germany Lambert C. et al. Nutrition
patient cohort 2017;37:60–67
Hospitalised trauma patients 521 54 ± 18.1 6 30 64 2017 Germany Ihle c. et al. Z Orthop Unfall
2017;155:184–193
9J Nutr Health Aging
NUTRITIONAL ASSESSMENT IN OLDER ADULTS
Table 3 (continued)
MNA® -SF Clinical practice: elderly – Hospial Settings - Identifying the elderly/adults at risk of malnutrition
Nutritional status evaluation[% of subjects]
Setting/Conditions n Age Under- At risk of Well-nourished Pub Year Country Reference
nourished malnutrition
[year] 65 218 83.5 ± 7.5 26 53 21 2017 Hong Kong Miu K.Y.D. and Lam P.S. Ann
years admitted to a rehabilitation China Rehabil Med 2017;41:1005-
unit 1012
Elderly consecutively admitted to 342 83.1 ± 6.8 11 45 44 2018 Germany Pourhassan M. et al.Clinical
the geriatric acute care ward Nutrition 2018;37:1354e1359
Elderly consecutively admitted at 358 82.1 ± 8.2 49 49 3 2018 Germany Pourhassan M. et al. Clin Nutr
geriatric hospital ward ESPEN 2018;27:100-104
Patients ≥70 years from the 172 85 ± 6.4 31 49 20 2018 Australia Dent E. et al. Nutr Diet
20-bed Geriatric Evaluation and 2018;75:11–16
Management Unit (GEMU)
Māori or Pacific ethnicity) at 234 83.6 ± 7.6 27 47 27 2018 New Zealand Chatindiara I. et al. BMC Ge-
admission to hospital riatr. 2018;18(1):78
Elderly > 85 years admitted to 88 90.0 ± 3.7 28 43 28 2018 New Zealand Popman A. et al.Nutr Diet
one of two hospital wards in 2018;75:52–58
Auckland
Patients with a proximal femoral 437 79 ± 12.8 13 35 52 2018 The Netherlands van der Sijp M.P.L. et al. Injury
fracture 2018;49:2239–2243
Elderly patients of both sexes, 200 72.5 ± 5.3 16 41 43 2028 Brazil Lopes J.R. et al. Clin Nutr
diagnosed with cancer 2018;37(Suppl 1):S201
Hospitalized elderly patients 331 78.4 ± 9.7 14 40 46 2018 Brazil El Kik R.M. et al. Nutr Hosp
2018;35(5):1059-1065
N-patients ≥70 years admitted for 95 84.7 ± 6.6 27 73 0 2018 Spain Sánchez-Rodríguez D. et
postacute rehabilitation al. Arch Gerontol Geriatr
2018;76:210-214
Consecutive patients admitted to convalescent rehabilitation wards
with sarcopenia 343 80 ± 9 67 31 2 2018 Japan
Yoshimura Y. et al. Clin Nutr
without sarcopenia 294 68 ± 11 11 64 25
2018;37:2022-2028
Patients newly admitted to a 1056 70 ± 11 38 48 15 2019 Japan Shiraishi A. et al. Geriatr Ge-
post-rehabilitation hospital rontol Int 2019;19:189-196
Patients with femoral neck, 205 83.5 ± 7.0 22 50 27 2019 Japan Inoue T. et al. Clin Nutr
trochanteric, sub-trochanteric and 2019;38:220-226
basicervical hip fractures
Older individuals, who were 200 81.4 ± 6.6 31 60 9 2019 Germany Sieske L. et al. Nutrients
consecutively admitted to a 2019;11:1986
geriatric acute care ward
Hospital admission, diagnosis of 415 81 ± 7.7 9 43 48 2019 Italy Spain Lelli D. et al. J Am Coll Nutr.
orthopedic surgery or stroke 2019 Jul;38(5):441-446
Older patients who were 233 82.1 ± 7.1 39 47 14 2019 Germany Pourhassan M. et al. J
consecutively hospitalized to a Geriatr Psychiatry Neurol
geriatric acute care ward 2019;32(2):90-96
Patients ≥75 were screened in the 50 83 (75-94) 22 78 0 2019 Ireland Brady D. et al. Age Ageing
Emergency department 2019 :48 :iii1–iii16
All patients with cancer, aged 433 82.8 ± 4.8 29 47 24 2020 France Liuu E. et al. BMC Geriatr
75 years and older, who were 2020;20:295
referred to the geriatric oncology
clinic of Poitiers University
Hospital
10J Nutr Health Aging
THE JOURNAL OF NUTRITION, HEALTH & AGING
Table 3 (continued)
MNA® -SF Clinical practice: elderly – Hospial Settings - Identifying the elderly/adults at risk of malnutrition
Nutritional status evaluation[% of subjects]
Setting/Conditions n Age Under- At risk of Well-nourished Pub Year Country Reference
nourished malnutrition
[year]J Nutr Health Aging
NUTRITIONAL ASSESSMENT IN OLDER ADULTS
Table 4 (continued)
MNA® -SF Clinical practice - Frail elderly (Outpatient/Home Care) - Identifying the elderly/adults at risk of malnutrition
Nutritional status evaluation[% of subjects]
Setting/Conditions n Age Undernourished At risk of malnutrition Well-nourished Pub Year Country Reference
[year]J Nutr Health Aging
THE JOURNAL OF NUTRITION, HEALTH & AGING
Table 4 (continued)
MNA® -SF Clinical practice - Frail elderly (Outpatient/Home Care) - Identifying the elderly/adults at risk of malnutrition
Nutritional status evaluation[% of subjects]
Setting/Conditions n Age Undernourished At risk of malnutrition Well-nourished Pub Year Country Reference
[year]J Nutr Health Aging
NUTRITIONAL ASSESSMENT IN OLDER ADULTS
Table 5 (continued)
MNA® -SF Clinical practice - Institution - Identifying the elderly/adults at risk of malnutrition
Nutritional status evaluation[% of subjects]
Setting/Conditions n Age Undernourished At risk of malnu- Well-nourished Pub Year Country Reference
trition
[year]J Nutr Health Aging
THE JOURNAL OF NUTRITION, HEALTH & AGING
Table 6
MNA® -SF Clinical practice- Cognitively impaired elderly/elderly-adults with Parkinson’s disease - Identifying the elderly/
adults at risk of malnutrition
Nutritional status evaluation [% of subjects]
Setting n Age Undernourished & At risk of malnutrition Well-nourished Pub Year Country Reference
[year]J Nutr Health Aging
NUTRITIONAL ASSESSMENT IN OLDER ADULTS
Table 7 (continued)
MNA® Clinical practice- Community-living elderly - Identifying the elderly/adults at risk of malnutrition
Nutritional status evaluation[% of subjects]
Setting n Age Under-nourished At risk Well-nourished Pub Year Country Reference
[year] 70 0 22 78 1999 Denmark Beck AM et al. Ugeskr.Laeger
1997;159:6377-6381
Br J Nutr 1999;81:31-36
Hispanic elderly 356 >65 1 27 72 1999 USA Pareo-Tubbeh SL et al J Am Diet
Assoc 1999;99:572-582
Inner city African Americans 134 > 70 2 39 60 1999 USA Miller DK et al. Nestle Nutr
Workshop Ser.Clin Perform.Pro-
gramme 1999;1:79-86 Morley
JE et al. Nestle Nutr Workshop
Ser.Clin Perform.Programme
1999;1:67-76
Random selection of elderly 102 75 1 16 83 1999 Poland Chartewska J et al. Nestle Nutr
aged 75 years living at home in Workshop Ser Clin Perform
Warsaw Programme 1999;1:161
Elderly persons in the commu- 463 >70 1 8 91 2000 Israel Maaravi Y. et al Aging (Milano.)
nity, Jerusalem 2000;12:173-9
Elderly in rural and semi-rural 502 74 ± 7 3 28 69 2001 Greece Spartharakis GC et al. J Nutr
regions of central Greece Health Aging 2002;6:19
Free-living elders 97 76 (70-90) 0 33 64 2001 Chili Urteaga C et al. Rev Méd Chile
2001;129:871-876
Elderly selected among 7 Spanish 3459 73.2 ± 2 4 34 62 2001 Spain Spanish Geriatric Oral Health
regions (Andalucia, Catalunya, Researcg Group. Int Dent J
Galicia, Madrid, Murcia, Navarra 2001;51(3):228-234
& Valencia) Ramon J.M. et al. Med Clin
(Barc) 2001;117:766-770
Older Hispanics living 51 70 (52 - 92) 2 33 65 2002 USA Kicklighter J.R. & Duchon D.
indepedently J Appl Gerontol 2002;21(1),
119-133
Home living retired elderly, 51 51- 97 0 26 74 2002 Estonia Saava M. & Kisper-Hint I.-R. J
Tallinn Nutr Health Aging 2002;6:93-95
Free-living elderly participating 69 50-90 3 32 65 2004 USA Davidson J. & al. J Nutr Elder
in congregate meal-site programs 2004;(24)1: 53-67
Older persons living in the 42 70.9 + 6.7 0 31 69 2004 Brazil Delacorte R.R. et al J Nutr Health
community Aging 2004;8:531-534
Retires resident from a 115 68 ± 9 (50 - 89) 2 19 79 2004 China Fei X.F. et al. Chinese Journal
community, Shanghai of Clinical Rehabilitation
2004;8(21):4364-4365
Representative randomly slected >53 2004 Taiwan Tsai A.C. et al. Public Health
elderly >53 yrs Nutr 7(1):69-76, 2004
910 50 -60 1 8 91
Asia Pac J Clin Nutr 2007;16
1180 60 - 70 2 12 86 (4):656-662
J Nutr Health Aging
1820 70 - 80 4 15 81 2008;12(4):239-243
530 >80 5 24 71
Healthy free-living elderly 150 55-85 0 0 100 2004 UK Nayak USL & Queiroga JM Ge-
(MNA® -SF) rontechnology 2004;3(2):77-88
Elderly volunters living in 1564 70 + 8 8 76 16 2005 Turkey Kucukerdonmez O. et al. Saudi
Ankara Med J 2005;26:1611-1616
«middle class» non- 128 70-75 0 17 83 2005 Sweden Eriksson B.G. et al. J Nutr Health
instutitionalised individuals aged Aging 2005;9:212-220
70-75
Community-dwellin elders 240 81.7 + 8.7 (61-93) 5 39 56 2005 USA Chen C.C-H. et al. Adv Nursing
Sci 2005;28:376-389
Active healthy elderly women 82 >65 0 0 100 2005 France Rolland Y. et al. J Nutr Health
Aging 2005;9:397-402
Elderly free-living women 351 73 + 2.3 0 7 92 2006 Sweden Salminen H. et al. Eur J Clin Nutr
2006;60:486-493
Independently living elderly 172 71.8 ± 8.4 6 19 80 2006 Austria Hackl J.M. et al. Journal fur
at home Ernährungsmedizin 2006;8(1):13-
20
16J Nutr Health Aging
THE JOURNAL OF NUTRITION, HEALTH & AGING
Table 7 (continued)
MNA® Clinical practice- Community-living elderly - Identifying the elderly/adults at risk of malnutrition
Nutritional status evaluation[% of subjects]
Setting n Age Under-nourished At risk Well-nourished Pub Year Country Reference
[year] 60 (60 - 92) 1 19 79 2008 Brazil De Marchi R.J. et al. Nutrition
elderly 2008;24:546-553
Elderly living on the island of 111 75.0± 7.2 1 29 70 2008 Italy Mandas A. et al. Mediterr J Nutr
Sardinia Metab 2008;1:99-107
Community older adults in 162 74.1 ± 7.95 8 36 56 2009 China Han Y. et al. Public Health Nutr
Wuhan 2009;12(8):1189-1196
Representative sample of 2860 73.7 ± 6.8 4 32 65 2008 Spain Gil-Montoya J.A. et al. J Public
Spaniards over 65 years old Health Dent 2008;68(2):88-93
Elderly people from a senior 130 72.2 ± 4.3 0 13 87 2008 Japan Iizaka S. et al. Geriatr Gerontol
college in Tokyo Int 2008;8(1):24-31
2001–2006 in home-living older 579 75(2001) 0 15 86 2009 Sweden Johansson . et al. J Clin Nursing
people, southern Sweden 80(2002) 2009;18(9):1354-1364
Representative sample of older 728 80.7 ± 7.4 13 58 30 2009 Spain De la Montana Miguelez
people in Ourense J.et al. Arch Latinoam Nutr
2009;59(4):390-395
J Nutr Health Aging. 2011
Mar;15(3):187-91
Polish older persons aged 65+, 420 65+ 1 22 77 2010 Poland Niedźwiedzka E. et al. Adv Med
living in five selected regions of Sci 2010;55(2):172-8
Poland,
Elderly people aged 60 years or 612 68.8 ± 5.9 8 67,2 25 2011 Thailand Samnieng P. et al. J Nutr Geron-
older living in 19 sub-districts of tol Geriatr 2011;30:291-304
the Mueang district,
Phitsanuloke province
Community-dwelling elderly 83 73.7 ± 6.5 0 6 94 2012 Ireland Claesson M.J. et al. Nature
2012:488:178-84
Community dwelling (94%), 175 77.8 ± 6.5 2 25 73 2012 France Rolland Y. et al. J Am Med Dir
hospitalized, and nursing home Assoc. 2012;13(1):31-34
residents.
Community-dwelling elderly 50 70.1 ± 6.1 0 0 100 2012 France Cousson P.Y. et al. Gerodontolo-
fully dentates gy. 2012 Jun;29(2):e685-e692.
Community-dwelling elderly 47 70.1 ± 8.1 2 19 79
complete denture wearer
Quasi-probabilistic sample
of people ≥ 60 years old:
“Thousand´s Study”
Women 570 71 ± 7.7 9 51 41 2012 Mexico Rodriguez-Tadeo A. et al. J Nutr
Health Aging 2012;16:426-431
Men 190 73.7 ± 7.9 6 51 43
17J Nutr Health Aging
NUTRITIONAL ASSESSMENT IN OLDER ADULTS
Table 7 (continued)
MNA® Clinical practice- Community-living elderly - Identifying the elderly/adults at risk of malnutrition
Nutritional status evaluation[% of subjects]
Setting n Age Under-nourished At risk Well-nourished Pub Year Country Reference
[year] 60 7 40 53 2014 India Shilpa J. & Kumari K.S. Int J of
subjects from Kochi, Kerala Adv Res 2014;2 :214-221
Individuals aged ≥ 75 years 640 81.3 ± 5.0 2 20 78 2014 Spain Jürschik P. et al. Med Clin (Barc)
living in the community. 2014;143:191-195
Community dwellers ≥ 65 years, 6040 73.5 ± 5.2 0 12 88 2015 France Torres M.J. et al. Osteoporos Int
randomly recruited: Three-City 2015;26:2157-2164
(3C) study
Elderly, aged ≥ 60, randomly 1338 69.1 ± 7.3 6 41 53 2015 Iran Tanjani P.T. et al. Arch Gerontol
selected from the chosen cities Geriatr 2015;60:281-287
of 5 provinces representing the
country (geography, climate,
ethnicity, and culture)
Elderly >60 years of age residing 360 >60 15 55 30 2015 India Agarwalla R. et al. J Family
in the villages for longer than 6 Community Med. 2015;22(1):39-
months 43
Independent-living older adults 380 77.7 ± 9.8 1 9 91 2015 Belgium Bauer J.M. et al. J Am Med Dir
with mild to moderate limitations Germany Assoc 2015;16:740-747
in physical function : PROVIDE Ireland
study Italy
Sweden
U. K.
Older adults ≥ 65 years, living independently, recruited in the Taipei, Taiwan region
Nonfrail (n = 91) 0 28 72 2016 Taiwan Chang S.-F. et al. J Clin Nurs
152 80.9 ± 7.7 2016;25:424-433
Prefrail (n = 61) 8 46 46
18J Nutr Health Aging
THE JOURNAL OF NUTRITION, HEALTH & AGING
Table 7 (continued)
MNA® Clinical practice- Community-living elderly - Identifying the elderly/adults at risk of malnutrition
Nutritional status evaluation[% of subjects]
Setting n Age Under-nourished At risk Well-nourished Pub Year Country Reference
[year]J Nutr Health Aging
NUTRITIONAL ASSESSMENT IN OLDER ADULTS
Table 7 (continued)
MNA® Clinical practice- Community-living elderly - Identifying the elderly/adults at risk of malnutrition
Nutritional status evaluation[% of subjects]
Setting n Age Under-nourished At risk Well-nourished Pub Year Country Reference
[year]J Nutr Health Aging
THE JOURNAL OF NUTRITION, HEALTH & AGING
Table 8
MNA® Clinical practice- Hospital Settings - Identifying the elderly/adults at risk of malnutrition
Nutritional status evaluation[% of subjects]
Setting n Age Under-nourished At risk Well-nourished Pub Year Country Reference
[year] 70 15 33 52 1999 Switzerland Quadri P et al.Nest-
on admission to hospital le Nutr Workshop
Ser Clin Perform
Programme
1999;1:141-147
Acute care elderly patients 151 83.8 (70-99) 26 52 22 1999 Belgium Joosten E et
al.Aging (Milano)
1999;111:390-394
Acute care General surgery and 152 >65 15 44 41 1999 Canada Azad N et al. CMAJ
neurosciences 1999;161:511-515
Acute care Elderly patients, not 419 72 (60 - 98) 7 25 68 1999 France Cohendy R et
institutionalized, scheduled for al. Nestle Nutr
elective surgery Workshop Ser.Clin
Perform.Programme
1999;1:117-121
Acute care 299 83± 8 24 45 31 1999 France
Sub-acute care 196 32 55 13
Compan B et al. J
Long-term care 423 25 50 25 Nutr Health Aging
1999;3:146-151
Geriatric Medicine Elderly 175 80+8 22 49 30 2000 Belgium Gazzotti c et al. J
patients admitted to the regional Nutr Health Aging
university hospital 2000;4:176-81
Acute care Orthopaedic ward 49 60 -103 16 47 37 2000 U.K. Murphy MC et al.
patients admitted for emergency Eur J Clin Nutr
surgery 2000;54:555-562
Internal medicine 101 79.7 ± 6.3 (70-93) 8 46 47 2000 France Clement A et
al. Presse Med
2000;29:1207-1213
Geriatric medicine Assessment 1145 84.2 19 60 21 2001 Switzerland van Nes MC et al.
on admission to hospital Age and Ageing
2001;30:221-226
Hospital, general medicine 408 63 (>60) 19 43 38 2001 France
Gin H. et al.
Hospital, surgery 113 21 44 35
Cah Nutr Diét
Hospital, geriatry 75 53 41 6 2001;36:185-188
Geriatric ward of a general 126 31 51 18 2002 Belgium Pepersack T et al. J
hospital Nutr Health Aging
2002;6:306-310
Acute geriatric inpatient ward. 83 83+7 26 56 18 2002 Sweden Persson M. et al.
J Am Geriatr Soc
50:1996–2002,
2002
Sub-acute care 837 76 + 13 29 63 9 2002 USA Thomas D.R. &
al. Am J Clin Nutr
2002;75:308-313
Geriatric hospital admissions 486 81 ± 8 74 23 3 2002 Italy Donini L.M. & al. J
Nutr Health Aging
2002;6(2):141-146
Geriatric hospital 167 82 ± 8 2 30 68 2003 Italy Donini L.M. & al.
Journal of nutrition
2003;7(5):282-292
Demented patients admitted to 174 80.24 ± 8.09 36 48 17 2003 Italy Magri F. & al.
an Alzheimer section Aging Clin
Exp Res2003;
15(2):148-153
21J Nutr Health Aging
NUTRITIONAL ASSESSMENT IN OLDER ADULTS
Table 8 (continued)
MNA® Clinical practice- Hospital Settings - Identifying the elderly/adults at risk of malnutrition
Nutritional status evaluation[% of subjects]
Setting n Age Under-nourished At risk Well-nourished Pub Year Country Reference
[year] 65 13 63 24 2003 Australia Slaviero KA.
advanced cancer about to start & al. Nutrition
palliative chemotherapy and Cancer
2003;(46)2:148-157
Patients admitted to 5 regional 43 78.6 (68 - 94) 21 29 50 2003 Australia Barone L. et al. J
hospital Nutr Health Aging
2003;7(1):13-17
Patients over 60-year admitted 123 74 (60 - 97) 13 36 51 2003 France Bauduer F. et al. J
in hematology department Nutr Health Aging
2003;7(3):179-182
Inpatient geriatric service of 298 > 60 61 32 7 2004 The Nether- Rypkema G. & al. J
an university hospital and a lands Nutr Health Aging
geriatric ward of a non-academic 2004;8(2):122-127
teaching hospital (MNA® -SF)
Older men with prostate cancer total = 2004 Lithuania
80 > 65 (65-94) Toliusiene J.
& al. Medicina
Group a: advanced 40 10 50 40
2002;38:929-932
Group b: benign 40 0 8 37 2004 Spain Support Care Can-
cer 2004(12):716-
719
Geriatric convalescence unit 118 46 47 8 Arellano Perez
(intermediate care facility) M. & al. Rev
Mult Gerontol
2004;14(5):258-261
First visit to a geriatric clinic 204 77.5 ± 6.1 8 37 56 2004 Spain Esteban M. et
for surgery al. Rev Esp
Geriatr Gerontol
2004;39(1):25-28
Patients on discharge from 65 >65 29 46 25 2004 Australia Visvanathan R.
surrounding acute hospitals. & al. Age Ageing
Hampstead Rehabilitation 2004;33:260-265
Centre in Adelaide, a sub-acute
care facility
Geriatric Oncology Program: 135 78 (66–92). 24 41 36 2004 France Terret C. et al.
Cancer patients J Clin Oncol
2004;22(14S):8167
Rehabilitation unit at the Repa- 133 81+6 6 47 47 2005 Australia Neumann S.A. et al.
triation General Hospital J Hum Nutr Dietet
2005;18:129-136
Patients attending the medical 157 65 (32-81) 9 57 34 2005 Australia Read J.A. et al.
oncology day centers Nutr Cancer
2005;53:51-56
Acute care geriatric wards 80 80.2 + 7.7 33 38 30 2005 Germany Bauer J.M. et al. Z.
Gerontol Geriatr
2005;38:322-327
ClinNutr
2005;34(4):557
(Abstr P046)
Patients admitted to hospital 200 81± 7 50 38 13 2005 Spain Gomez Ramos
et al. Nutr Hosp
2005;20(4):286-292
Arch Latinoam Nutr
2005;55(1)71-76
Patients admitted to hospital 145 68 30 2 2005 Spain Izaola O. et al.
An Med Interna
2005;22(7):313-316
Elderly hospitalized for different 207 74.3 ± 7.0 9 30 61 2005 Portugal Martins C.P.A.L. et
medical and/or surgical reasons al. J Nutr Elderly
2005;25:5-21
Prospective cohort study of 414 >75 49 33 17 2005 Israel Kagansky N. et al.
patients from a geriatric hospital Am J Clin Nutr
2005;82:784-791
22J Nutr Health Aging
THE JOURNAL OF NUTRITION, HEALTH & AGING
Table 8 (continued)
MNA® Clinical practice- Hospital Settings - Identifying the elderly/adults at risk of malnutrition
Nutritional status evaluation[% of subjects]
Setting n Age Under-nourished At risk Well-nourished Pub Year Country Reference
[year] 65 19 36 57 2007 Israel Feldblum I. et al.
internal medicine department Nutr J 2007;6:37
Multimorbid geriatric patients in 81 79.3 ± 7.4 40 58 3 2007 Germany Hengstermann S.
acute care with Pressure Ulcere et al. J parenter
Enteral Nutr 2007;
31:288-294
Idem, without Pressure Ulcer 403 79.7 ± 7.7 17 60 24
Rehabilitation ward 38 4 42 54 2007 Australia Neumann S.A. et
al. Nutr Dietetics
2007;64:179-185
23J Nutr Health Aging
NUTRITIONAL ASSESSMENT IN OLDER ADULTS
Table 8 (continued)
MNA® Clinical practice- Hospital Settings - Identifying the elderly/adults at risk of malnutrition
Nutritional status evaluation[% of subjects]
Setting n Age Under-nourished At risk Well-nourished Pub Year Country Reference
[year] 75 10 60 30 2007 Sweden Olofsson B. et al.
J Clin Nursing
2007;16:2027-2038
Admission to cardiac and 114 75 ± 6 4.4 43 52.6 2007 Taiwan Chen C.C-H. et
orthopaedic services al. J Clin Nursing
2007;16:2015-2026
Consecutively admitted patients 205 82 (75 - 95) 30 60 10 2007 Germany Saeglitz C. PhD
Thesis 2007, Hohen
Landwirtschaflichen
Falkultät der
Rheinischen
Friedriech-Wil-
hems-Universität
Bonn
Consecutively admitted patients 97 71 ± 7.7 18 50 32 2007 Mexico Gutiérrez
Reyes J.G. et
al. Nutr Hosp
2007;22(6):702-709
Hospitalized elderly 123 >65 24 42 35 2007 Spain Villar Taibo R.
et al. Nutr Hosp
2007;22(Supl 1):68(
Abstr)
Admission to orthopedic surgery 107 62 ± 20 (16 - 95) 12 22 66 2008 Spain Garcia Duque S.
et al. Nutr Hosp
2008;23(5):493-499
Admisson to hospital 41 83 ± 5 29 71 0 2008 Spain Trabal J. et al. Clin
Nutr 2008;Sup-
pl3(1):61( P078)
Admisson to hospital: elderly 531 32 51 17 2008 Portugal Cansado P et al.
patients Clin Nutr 2007;
Suppl2(2):99(P032)
Elderly patients at a tertiary 100 81.9 ± 6.3 30 61 9 2008 Australia Adams N.E. et
teaching hospital al. Nutr Dietetics
2008;65:144-150
Multimorbid patients 808 77.1 ± 9.0 20 65 15 2008 Germany Hengstermann
S. et al. J Nutr
Health Aging
2008;12(2):117-122
Mono-centre non-interventional 102 62 ± 19 12 38 50 2006 Switzerland Gehring N. et al.
trial hospitalised patients Swiss Med Wkly
2006;136(41-
42):664-669
Patients hospitalized for 117 84.7 ± 6.5 31 53 16 2008 Spain Cabré M. et al.
pneumonia in the Acute Med Clin (Barc)
Geriatric Unit of Hospital de 2008;131(5):167-
Mataró, Barcelona 170
Patients with rheumatoid 59 65 (55 - 75 22 51 27 2008 Sweden Elkan A.C. et al.
arthritis at inpatient ward Eur J Clin Nutr
2008;62:1239-1247
COPD patients admitted to an 50 75.7 ± 6.9 48 48 2 2008 Sweden Odencrants S. et
acute care hospital ward al. J Clin Nursing
2008;17:1771-1778
Hospitalized medical patients 195 >65 0 39 61 2008 Israel German L. et al. J
Nutr Health Aging
2008;12(5):313-318
180 persons, 65 males and 115 180 79.5 (65-97) 19 67 14 2008 Italy Amici A. et al.Arch
females (Rehabilitation unit) Gerontol Geriatr
2008;46(3):327-334
Admission to medicine guard of 113 78.3 ± 7.7 (65 - 98) 38 41 21 2008 Chile Hirsch S. et al.
a military hospital Open Longevity Sci
2008;2:17-22
24J Nutr Health Aging
THE JOURNAL OF NUTRITION, HEALTH & AGING
Table 8 (continued)
MNA® Clinical practice- Hospital Settings - Identifying the elderly/adults at risk of malnutrition
Nutritional status evaluation[% of subjects]
Setting n Age Under-nourished At risk Well-nourished Pub Year Country Reference
[year] 18 years old, with 115 66 (32-86) 25 51 24 2011 Greece Gioulbasanis I. et
newly diagnosed metastatic al.Lung Cancer
lung cancer, admittedto 2011;74(3):516-520
the Department of Medical
Oncology, University Hospital
of Heraklion
Patients were randomly selected 400 67.4 ± 16.1 15 44 42 2011 Spain Velasco C. et al.Eur
from the hospital admission J Clin Nutr. 2011
register ;65:269-274
Patients with cancer >70years 202 77 ± 4.2 3 30 65 2011 The Netherlands Aaldriks A.A. et
for whom chemotherapy was al. Crit Rev Oncol
prescribed by their medical Hematol 2011
oncologist ;79:205-212
Older non-diabetic and diabetic 164 85.2 ± 6.4 17 53 29 2012 Switzerland Vischer U.M.
patients et al. Clin Nutr
2012;31:113-117
Patients admitted to three 106 79.4 22 55 24 2012 Spain Calvo I. et al.
different internal medicine units Nutr Hosp
2012;27:1619-1625
Patients admitted in different 57 70.5 ± 16 14 35 51 2012 Spain Ocón Bretón M.J.
medical or surgical wards et al. Nutr Hosp
2012;27:701-706
25J Nutr Health Aging
NUTRITIONAL ASSESSMENT IN OLDER ADULTS
Table 8 (continued)
MNA® Clinical practice- Hospital Settings - Identifying the elderly/adults at risk of malnutrition
Nutritional status evaluation[% of subjects]
Setting n Age Under-nourished At risk Well-nourished Pub Year Country Reference
[year] 18 years old) with 162 >18 25 65 10 2014 U.S.A. Yost G. et al.
advanced heart failure Nutr Clin Pract.
2014;29(5):686-691
Consecutively admitted internal 130 76.2±7.2 37 31 32 2015 Turkey Demir M.V. et al.
medicine patients at Sakarya Niger J Clin Pract.
Education and Research 2015;18(6):757-761
Hospital
Elderly patients hospitalized at a 141 73.5 ± 5.2 26 40 34 2015 Korea Baek M.-H. and
geriatric care hospital Heo Y.-R. Nutr Res
Pract 2015;9:637-
643
Hospitalized patient of a tertiary 194 71.6 ± 21.4 23 46 31 2015 Spain Calleja Fernández
hospital center A. et al. Nutr Hosp
2015;31:2240-2246
Geriatric trauma patients 50 84.9 ± 5 28 42 30 2016 Germany Goost H. et al.
Technology and
Health Care
2016;24: 225–239
Acute geriatric ward admission 120 82.5 ±8.0 27 48 25 2016 Norway Jacobsen .L. et
al. BMJ Open
2016;6:e011512.
Patients with the age of 75 years 226 83 ± 5 5 27 68 2016 The Netherlands van Wissen J. et al.
or older and an indication for J Nutr Health Aging
hip surgery 2016;20:964-968
Older adults admitted to rural 57 79.1 ± 7.3 28 58 14 2016 Australia Marshall S. et al.
rehabilitation facilities J Acad Nutr Diet
2016;116:785-794
Patients aged ≥70 years admitted 100 85.2 ± 6.1 40 44 16 2017 Australia Dent E. et al.
to the Geriatric Evaluation and Australas J Ageing
Management Unit following a 2017;36:E8-E13
brief acute hospital stay
Older patients (aged ≥ 60 years) 453 79.0 ± 7.8 10 41 48 2017 China Hu X. et al. Sci Rep
from the acute geriatric wards of 2017;7:3171
two hospitals in Chengdu
Orthopedic and traumatology 398 ≥ 65 4 34 62 2017 Germany Lambert C. et
patient cohort al. Nutrition
2017;37:60–67
26J Nutr Health Aging
THE JOURNAL OF NUTRITION, HEALTH & AGING
Table 8 (continued)
MNA® Clinical practice- Hospital Settings - Identifying the elderly/adults at risk of malnutrition
Nutritional status evaluation[% of subjects]
Setting n Age Under-nourished At risk Well-nourished Pub Year Country Reference
[year] 18 years) with 1952 62.7 ± 12.9 9 42 49 2017 Italy Muscaritoli M.
solid tumor diagnosis and a life et al. Oncotarget
expectancy >3 months 2010;8:79884-
79896
Acutely ill patients admitted 1409 80 ± 9 43 42 15 2017 Brazil Avelino-Silva T.J.et
to a geriatric ward of a tertiary al. PLoS medicine
university hospital in São Paulo 2017;14:e1002264
Patients with end-stage renal 47 69.7 ± 8.95 2 28 70 2018 Poland Rogowski Ł. Et al.
disease Adv Clin Exp Med
2018;27:1117–1123
Patients staying on the internal 76 65 ± 9.7 3 29 68 2018 Poland Gołąbek K. et
medicine ward al. Rocz Panstw
Women Zakl Hig 2018;69
:281-288
Men 44 63 ± 8.4 0 18 82
Patients hospitalized for a hip 62 79.9 ± 7.7 9 46 44 2018 Italy Valentini A. et al.
fracture Clin Interv Aging
2018;13:1237-1244
Caucasian patients undergoing 50 73.5 ± 7.76 10 44 46 2018 Italy Mignini E.V. et
major surgery al. Eur Rev Med
Pharmacol Sci.
2018;22(11):3524-
3533
Oncology patients. 296 58.3 ± 11.6 16 44 40 2018 Turkey Koc E.M. et al.
Fam Pract Palliat
Care2018;3:39-44
Patients with GIS cancer 153 70.5 ± 5.6 38 35 28 2018 Turkey Bicakli D.H. et
al . Nutrition
2018;47:39–42
Elderly undergoing elective 26 75 ± 1 0 0 100 2019 The Nether- Kouw I.W.K. et al. J
total hip arthroplasty at hospital lands Am Med Dir Assoc
admission 2019;20(1):35-42
Consecutively admitted internal 425 81.2±5.9 23 35 41 2019 China Miao J.-P. et
medicine patients al. BMJ Open.
2019;9(2):e022993
Hospitalized elderly patients 134 68.9 ± 8.4 43 42 16 2019 Malaysia Abd Aziz N.A.S:
et al. Clin Nutr
ESPEN 2019
;29:77-85
Very old patients admitted to 150 87.6 ± 4.9 13 49 38 2019 Spain Sánchez-Castellano
an Orthogeriatric Unit for the C. et al. Nutr Hosp
treatment of a hip fracture 2019;36(4):813-818
Outpatients ≥70 years at the 288 81.1 ± 6.6 15 55 31 2019 Spain Bolado Jiménez C.
Emergency Department of the et al. Nutrition 2019
University Clinical Hospital of ;66:142-1466
Valladolid
Hospitalized elderly 124 85.9 ± 5.5 50 50 2020 Belgium Hammami S. et al.
BMC Geriatrics
2020;20(1):144
Patients hospitalised on 240 83.4 ± 8.1 37 61 2 2019 Germany Becker L. et al. Sci
the geriatric wards of the Rep 2019 ;9:9064
Department of Internal Medicine
Consecutive patients with 113 67.0 ± 16.1 36 48 16 2020 Belgium Vanden Wyngaert
end-stage kidney disease on K. et al. PLoS One
maintenance haemodialysis 2020;15:e0236816
27J Nutr Health Aging
NUTRITIONAL ASSESSMENT IN OLDER ADULTS
Table 8 (continued)
MNA® Clinical practice- Hospital Settings - Identifying the elderly/adults at risk of malnutrition
Nutritional status evaluation[% of subjects]
Setting n Age Under-nourished At risk Well-nourished Pub Year Country Reference
[year]J Nutr Health Aging
THE JOURNAL OF NUTRITION, HEALTH & AGING
Table 9 (continued)
MNA® Clinical practice – Frail elderly (Outpatient/Home Care) - Identifying the elderly/adults at risk of malnutrition
Nutritional status evaluation[% of subjects]
Setting n Age Under-nourished At risk Well-nourished Pub Year Country Reference
[year] 75 [75-94) 3 48 49 2004 Finland Soini H. & al.
in rural Finland. Eur J Clin Nutr
2004;58:64-70
Home living elderly Swedish 351 ~73 0 7 92 2004 Sweden Salminen H. &
women al Osteoporos
Int 2004;15(Sup-
pl1):S52
Outpatients 215 >60 4 31 65 2004 Turkei Sakarya M. &
al Anasthesiol
Intensivmed Notfal
2004;39:400-405
Home-care Patients 104 >65 20 52 28 2004 Spain Ricart Casas J.
Aten Primaria
2004;34:238-243
Elderly in various settings was 226 78.6 + 0.5 20 58 22 2005 Japan Kuzuya M. et
carried out. al. Nutrition
2005;21:498–503
Elderly living at home in 5 353 82± 7 8 41 51 2005 Sweden Saletti A. & al. Geron-
Swedish municipalities tology 2005;51:192-
198
Patients living at home and 51 76-93 0 47 53 2005 Finland Soini H. & al. J
receiving home health care Nutr health Aging
services 2005;9:249-253
Community-dwelling and frail 187 >60 5 50 44.4 2005 South Africa Charlton K.E. et al.
elderly Public Health Nutr
2005;8:468-479
Apartment residents 67 70 ± 2.5 0 34 66 2005 Canada Lawrence H.P. et al.
Spec Care Dentist
2005;25(5):242-252
Elderly service flat residents 80 85.5 (79 - 90) 30 59 11 2005 Sweden Ödlund Olin A. et
al. Eur J Clin Nutr
2005;59:263-270
Residential homes 127 >65 20 50 30 2006 Sweden Wikby K. et al. J
Nutr health Aging
2006;10:232-238
Day-care centers 281 81.9 ± 7.2 9 51 40 2006 Japan Izawa S. et al. Clin
Nutr 2006 ;25:962-967
Osteoporosis study women 120 69 (60-80) 34 4 62 2006 Lithuania Ožeraitienė V.
& Būtėnaitė V.
Medicina (Kaunas)
2006;42(10):836-842
Home care patients 178 83.5 ±4.63 3 48 49 2006 Finland Soini H. et al. J
Gerontol Nurs
2006;32(4):12-17
11 Centers of Health 1605 65 - 100) 6 34 60 2007 Spain Jiménez Sanz M.
et al. Nutr Hosp
2007;22(Supl
1):9(Abstr)
Elderly outpatients with and 77 73.9 ± 8.5 9 39 52 2008 Poland Szewczyk M.T. et al.
without venous ulcers Ostomy Wound Ma-
nage 2008;54(9):34-
6,38-40,42
29J Nutr Health Aging
NUTRITIONAL ASSESSMENT IN OLDER ADULTS
Table 9 (continued)
MNA® Clinical practice – Frail elderly (Outpatient/Home Care) - Identifying the elderly/adults at risk of malnutrition
Nutritional status evaluation[% of subjects]
Setting n Age Under-nourished At risk Well-nourished Pub Year Country Reference
[year]J Nutr Health Aging
THE JOURNAL OF NUTRITION, HEALTH & AGING
Table 9 (continued)
MNA® Clinical practice – Frail elderly (Outpatient/Home Care) - Identifying the elderly/adults at risk of malnutrition
Nutritional status evaluation[% of subjects]
Setting n Age Under-nourished At risk Well-nourished Pub Year Country Reference
[year] 65 19 29 52 2015 Turkey Gündüz E. et al. Med
outpatient clinics Sci Monit 2015; 21:
2750–2756
Patients aged ≥65 years who 236 76.4 ± 7.2 15 30 55 2015 Turkey Sarikaya D. et al.
were admitted to our geriatric Arch Gerontol Geriatr
medicine outpatient clinic 2015;61:56-60
Postmenopausal women, 200 45 - 64 11 27 62 2016 Egypt Gabal H. et al. Eur
outpatient clinics in Ain Shams J Public Health
University hospital 2016;25:ckv176.300
Patients aged ≥65 years of 190 80 (75-84) 6 45 50 2016 Germany Schrader E.et al. J
a geriatric day hospital of a Nutr Health Aging
large community hospital in 2016;20:918-926
Nuremberg
Elderly, aged ≥65 years, being 1103 79.5 ± 8.4 10 23 67 2016 Spain Cuerda C. et al. Nutr
treated in community healthcare Hosp 2016;33:263-269
services in the Community of
Madrid : DREAM + 65 Study
Patients referred to the Geriatric 1309 82.5 ± 6.3 5 35 61 2017 France Rapp L. et al. J Frailty
Frailty Clinic. Aging 2017;6:154-60
Frail elderlyl, home care 80 83 ± 8 9 39 53 2017 Austria Haider S. et al. PLoS
One. 2017;12(1):
e0169613
Aged-care facilities in metro- 215 85·8 ±7·5 11 57 32 2017 Australia Iuliano S. et al. Br J
politan Melbourne and regional Nutr 2017;117:142-147
Victoria
Patients who visited the geriatric 404 80.2 ±7.1 15 56 29 2018 The Netherlands Kurkcu M. et al.
outpatient department of a Dutch Clin Nutr ESPEN
hospital 2018;23:112-116
Elderly outpatients (≥65 years) 473 80.9 ± 6.6 15 34 51 2018 Italy Liguori I et al.
admitted to a CGA center Nutr Clin Pract
2018;33(6):879-886
Outpatients evaluated at the 50 78.1 ± 6.0 0 22 78 2018 Italy Valentini A. et al.
department of internal medicine Clin Interv Aging
2018;13:1237-1244
Elderly patients at a Geriatric 159 76.9 + 6.4 8 33 60 2018 Thailand Pengsorn N. et al.
Outpatient Clinic J Med Assoc Thai
2018:101:869-874
Outpatients with chronic stroke 59 71 ±14.7 0 25 75 2019 Taiwan Lin S-C. et al. PLoS
One 2019;14:e0218749
Secondary outpatient clinic
Non-Frail 39 73.6 ± 5.7 0 13 87 2019 Brazil Zukeran M.S. et al.
J Nutr Health Aging
Pre-frail 76 75.3 ± 7.2 2 31 68
2019;23(2):217-220
Frail 139 78.9 ± 7.6 8 54 38
Elderly over 65 years of age in 3 248 81.3 (80 - 82) 9 29 62 2019 Spain Muñoz Díaz B. et
health centres and 3 residential al. Family Practice
care homes in Cordoba 2019;36:172-178
Elderly home care patients 209 ≥ 19 53 30 17 2019 Turkey Adıgüzel E. & Acar-
Tek N. Exp Gerontol
2019;120:15-20
Older patients undergoing cancer 454 78 (65 – 96) 30 35 35 2019 U.S.A. Zhang X. et al. J Geria-
care tr Oncol 2019;10:763-
769
BMJ Supportive
& Palliative Care
2020;10:363-368
31J Nutr Health Aging
NUTRITIONAL ASSESSMENT IN OLDER ADULTS
Table 9 (continued)
MNA® Clinical practice – Frail elderly (Outpatient/Home Care) - Identifying the elderly/adults at risk of malnutrition
Nutritional status evaluation[% of subjects]
Setting n Age Under-nourished At risk Well-nourished Pub Year Country Reference
[year]J Nutr Health Aging
THE JOURNAL OF NUTRITION, HEALTH & AGING
Table 10 (continued)
MNA® Clinical practice: elderly – Institution - Identifying the elderly/adults at risk of malnutrition
Nutritional status evaluation[% of subjects]
Setting n Age Under-nourished At risk Well-nourished Pub Year Country Reference
[year] 60 71 26 4 2000 Italy Donini LM et al. Age &
Nutrition 2000;11:2-5
Long term care 77 85.6 ± 8.8 32 43 25 2000 France Menecier-Ossia L.
et al. Revue Geriatr
2000;25:65-70
Institution (all) 872 84.5 ± 8 36 48 16 2000 Sweden Saletti A et al. Geron-
tology 2000;46:139-
145
Rehabilitation unit 73 80.4 ± 7.6 23 67 10 2000 Switzerland Liver C et al. Age &
Nutrition 2000;11:67-
71
Institutionalized elderly Chinese 120 >60 21 52 26 2001 China Hui WH. et al. Hong
Kong J Gerontol
2001;15:35-43
Nursing home 150 58 -96 1 27 73 2002 Estonia Saava M. & Kis-
per-Hint I.-R. J Nutr
Health Aging2002;
6:93-95
Spanish institution
Ramon J.M. & al Med
Women 134 5 38 58
>65 2001 Spain Clin (Barc) 2001;117:
Men 255 9 46 45 766-770
Nursing home 66 >65 32 55 9 2002 Denmark Beck AM. & al Aging
Clin Exp Res. 14:212-
215, 2002
Municipal care 261 65 -107 23 56 21 2002 Sweden Christensson et al.
Eur J Clin Nutr
2002;56:810-818
Long term geriatric unit Mataró 67 83 ± 8 24 37 39 2002 Spain Bleda MN & al J
Nutr Health Aging
2002;6:134-37
Nursing homes
Madrid 205 >65 35 51 24 2002 Spain Ribeira Casado J.M.
J Nutr Health Aging
Valencia 94 79.3 5 45 50
6:84-90, 2002
Sánchez, R. Residential
1999 ;9 :21-30.
Latorre C. et al. Rev
Esp Geriatr Gerontol
2000;35(supl 1):74-75
Institutionalized patients with a 99 86.5 ± 6.1 17 68 14 2003 Spain Gregorio P.G. & al
diagnosis of AD according with J Nutr Health Aging
NINCDS/ADRDA criteria from 2003;(7)5:304-308
8 nursing-homes
Institutionalized older women 89 85 ± 6 (72-98) 8 82 30 2003 Spain Ruiz-López M.D. et al.
Nutrition 2003;19:767-
771
Nursing homes residents 90 86 ± 6 13 63 23 2003 Switzerland Gerber V. et al. J
Nutr Health Aging
2003;7:140-145
Nursing Home elders with 24 >65 54 29 17 2004 USA Hudgens JH & al.
pressure ulcers JPEN J Parenter Enteral
Nutr 2004;28(6):416-
422
Elderly from a geriatric home 63 >60 14 70 16 2004 Venezuela Peña E. et al. Rev
Esp Geriatr Gerontol
2004;39(6):360-366
Patients admitted at our 352 81.5 ± 8 38 55 7 2004 Italy Baldelli M.V. et al.
subacute care nursing home Arch Gerontol Geriatr
Suppl 2004;(9):39-43
Nursing home residents 50 81.3 16 54 30 2004 Spain Villaverde Gutierrez
C. et al. Geriatrika
2004;20(1):8-11
33You can also read