Papaya 2017-2021 STRATEGIC INVESTMENT PLAN - Hort Innovation
←
→
Page content transcription
If your browser does not render page correctly, please read the page content below

Papaya
S TR ATE G I C I N V E S TM E NT PL A N

 2017-2021
Content
Introduction                                                                                                                                            3
   The papaya SIP                                                                                                                                       3
   Papaya SIP at a glance                                                                                                                               4
Section one: Context                                                                                                                                    6
   The Australian papaya industry                                                                                                                        6
   Operating environment                                                                                                                                11
Section two: Papaya industry outcomes                                                                                                                   12
Section three: Papaya industry priorities                                                                                                               14
   Industry investment priorities                                                                                                                       14
   Aligning to Hort Innovation investment priorities                                                                                                    16
Section four: Papaya monitoring and evaluation                                                                                                          18
   Papaya SIP monitoring, evaluation and reporting                                                                                                  18
   Papaya industry M&E plan                                                                                                                         20
Section five: Impact assessment                                                                                                                     22
Section six: Risk management                                                                                                                        24

DISCLAIMER
Any views contained in this Strategic Investment Plan (SIP) do not necessarily represent the views of Horticulture Innovation Australia Limited
(Hort Innovation) or its commitment to a particular course of action or a guarantee of specific outcomes. Hort Innovation will make research and
development (R&D) and marketing investments to meet its obligations as outlined in the Deed of Agreement between Hort Innovation and the Australian
Government (2014-18) and the Hort Innovation Constitution (2016). Hort Innovation reserves the right to amend or vary the SIP without notice.
Hort Innovation makes no representations and expressly disclaims all warranties (to the extent permitted by law) as to the accuracy, completeness,
or currency of information provided in Section 1 of this SIP. Recipients or users of the information contained therein (and any links) should take
independent action before relying on its accuracy in any way. Hort Innovation is not responsible for, and will not be liable for, any loss, damage,
claim, expense, cost (including legal costs) or other direct or indirect liability arising in any way (including from Hort Innovation or any other
person’s negligence or otherwise) from the use, non-use or reliance on the information contained in Section 1 of this SIP.

COPYRIGHT
Copyright subsists in this SIP. Hort Innovation owns the copyright in this SIP. Apart from rights to use as permitted by the Copyright Act 1968 (Cth)
this SIP (in part or as a whole) cannot be reproduced, published, communicated or adapted without the prior written consent of Hort Innovation.
Any request or enquiry to publish, communicate, adapt or use the SIP should be addressed to:
Communications Manager
Hort Innovation
Level 8, 1 Chifley Square
Sydney NSW 2000
Australia
Email: communications@horticulture.com.au
Telephone: 02 8295 2300

HORT INNOVATION                                                            2                              PAPAYA STRATEGIC INVESTMENT PLAN – 2017-2021
Introduction
This Strategic Investment Plan (SIP) is the roadmap that helps guide Hort
Innovation’s oversight and management of individual levy industry investment
programs. The SIP lays the foundation for decision making in levy investments
and represents the balanced interest of the particular industry from which the
levy is collected. The very important function of the SIP is to make sure that
levy investment decisions align with industry priorities.

Hort Innovation is the not-for-profit, grower-owned research         Levy is payable on papaya that are produced in Australia
and development (R&D) and marketing company for                      and either sold by the producer or used by the producer
Australia’s $9 billion horticulture Industry.                        in the production of other goods. The levy rate on fresh
                                                                     and export papaya is 2 cents per kilogram and processing
As part of the role Hort Innovation plays as the industry            papaya is 0.25 cents per kilogram.
services body for Australian horticulture, the organisation is
tasked by the Australian Government with working alongside           Hort Innovation manages the papaya levy funds which are
industry to produce a strategic plan for investment of levies        directed to R&D (fresh and export is 1 cent per kilogram
in industry R&D and marketing activities.                            and processing is 0.25 cents per kilogram) and marketing
                                                                     (1 cent per kilogram). In 2015/16 total papaya levy receipts
Each individual levy industry investment strategy also speaks        were approximately $334,000: $167,000 of R&D levies and
to the future growth and sustainability of the Australian            $167,000 of marketing levies.
horticulture industry, as a whole. The SIPs are produced
under the umbrella of the Hort Innovation Strategic Plan,            Hort Innovation has developed this SIP to strategically
which takes a whole of industry view in setting its direction,       invest the collected papaya levy funds in the priority areas
as it considers broader agriculture government priorities for        identified and agreed by the papaya industry. The ability to
the advancement of Australian horticulture.                          deliver on all the articulated strategies (and investments) in
                                                                     an impactful manner will be determined by the ability of the
The process in preparing each SIP was managed by Hort                statutory levy to provide the resources to do so.
Innovation and facilitated in partnership with Industry
Representative Bodies and Strategic Investment Advisory              This plan represents the Australian papaya industry’s
Panels (SIAP). Independent consultants were engaged                  collective view of its R&D and marketing needs over the next
to run the consultation process, to gather the advice                five years (2017 to 2021). This plan has been developed in
from stakeholders impartially and produce a plan against             consultation with Australian papaya levy payers through a
which each levy paying industry can be confident of its              synthesis of priority setting exercises, direct consultation,
strategic intent.                                                    two workshops with Hort Innovation’s papaya industry SIAP,
                                                                     and industry consultation. The process to develop this plan is
Hort Innovation has valued the support, advice, time and             fully described in Appendix 1.
commitment of all stakeholders that contributed to producing
the SIPs, especially papaya growers.                                 The papaya SIAP has responsibility for providing strategic
                                                                     investment advice to Hort Innovation. Both Hort Innovation
                                                                     and the advisory panel will be guided by the strategic
The papaya SIP
                                                                     investment priorities identified within this plan, focusing
Producers in the papaya industry pay levies to the                   on those identified as being a higher priority. For more
Department of Agriculture and Water Resources (DAWR),                information on the papaya industry SIAP constituency please
who is responsible for the collection, administration                visit Hort Innovation’s website at www.horticulture.com.au.
and disbursement of levies and charges on behalf of
Australian agricultural industries.

Agricultural levies and charges are imposed on primary
producers by government at the request of industry to
collectively fund R&D, marketing, biosecurity and residue
testing programs.

HORT INNOVATION                                                  3                         PAPAYA STRATEGIC INVESTMENT PLAN – 2017-2021
Papaya
STRATEGIC INVESTMENT PLAN
2017-2021 AT A GLANCE

                                                                 OUTCOMES                STRATEGIES
  POTENTIAL IMPACT OF THIS PLAN
                                                                 Access to new           Continue research, trials and adoption

                      10
                                                                 varieties and           of chemical and other processes

                    $
                                                                 improved pest           for effective pest and disease
                                                                 and disease             management
                                                                 management
                                                                 improves                Continue research and
                                                                 growers’                commercialisation of new genetically
                                                                                         improved varieties that offer increased

                    Million
                                                                 productivity and
                                                                 profitability           disease resistance and consumer
                                                                                         appeal

                                                                                         Develop and adopt an integrated pest
                                                                                         and disease management (IPDM) plan
     Based on an estimated investment of $2.4 million                                    Continue to research and
                 over the next five years                                                refine agronomic practices to
                                                                                         improve productivity, quality and
                                                                                         environmental outcomes
OUTCOMES            STRATEGIES

                                                                 Improved                Increase demand in existing domestic
Increased           Engage with consumers to identify
                                                                 market access           markets through understanding of
quality to ensure   preferred taste and bring this
                                                                 and increased           consumer preference and targeted
consistency of      understanding back to farm so
                                                                 consumer                marketing around these preferences
supply to the       growers can consistently provide
                                                                 demand
consumer            quality fruit meeting consumer                                       Provide opportunities to access
                                                                 increases returns
                    expectations                                                         domestic and international new
                                                                 to growers
                                                                                         markets
                    Increase grower focus on quality
                    through improved engagement                                          Support research, development,
                    and dissemination of best practice                                   adoption of growing practices and
                    information                                                          marketing initiatives to position
                                                                                         papaya as a naturally grown fruit with
                    Research and adopt improved
                                                                                         significant health benefits
                    postharvest packing, treatment
                    protocols, storage, distribution and
                                                                Highest-priority strategies or activities for the initial stages
                    retailer processes to improve quality
                                                                of the plan are indicated in bold.
                    and increase shelf life

HORT INNOVATION                                             4                         PAPAYA STRATEGIC INVESTMENT PLAN – 2017-2021
Papaya
STRATEGIC INVESTMENT PLAN
2017-2021 AT A GLANCE

 Major opportunities                                                    Major challenges
 yy Improved industry information and data sharing to advance           yy Regulatory changes and compliance issues
    production methods, supply chain forecasting, handling              yy Extreme weather events such as cyclones and low rainfall
    techniques and biosecurity defences                                 yy Competition from other exotic tropical fruits
 yy Links to and use of the research conducted in Fiji by               yy Biosecurity breaches and the subsequent cost of quarantining
    Australian Centre for International Agricultural Research              against endemic and imported pests especially ringspot and
    (ACIAR)                                                                fruit fly
 yy Co-operative marketing campaign to raise awareness of the           yy Increasing costs of supply chain with transportation being one
    health benefits of papaya with melon and cross-category                of the major impacts on profitability
    promotion                                                           yy Poor perception of fruit taste particularly in older
                                                                           demographic categories
 yy Identify products that can be supplied consistently to target
    major retail markets                                                yy Supply chain and cold chain issues affecting quality of
                                                                           a fragile product
 yy Consistently adopt management practices that minimise
                                                                        yy Labour intensive harvesting practices
    the use of chemicals for pest and disease management
    and have low impact on the environment to enhance the               yy No industry standard product for supply into main retail
    acceptance of papaya as a health fruit.                                market and inconsistent quality.

Industry size and production distribution                               Papaya supply chain and value 2014/15

                                                                                                                    Processing
                                        WA     8%                                                                   209 tonnes;
SECTION ONE
1
Context
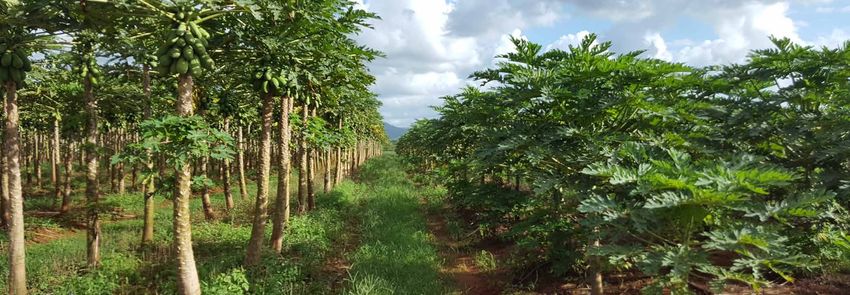
The Australian papaya industry
The Australian papaya industry has growers across Products marketed
Northern Australia from Queensland to Western Australian
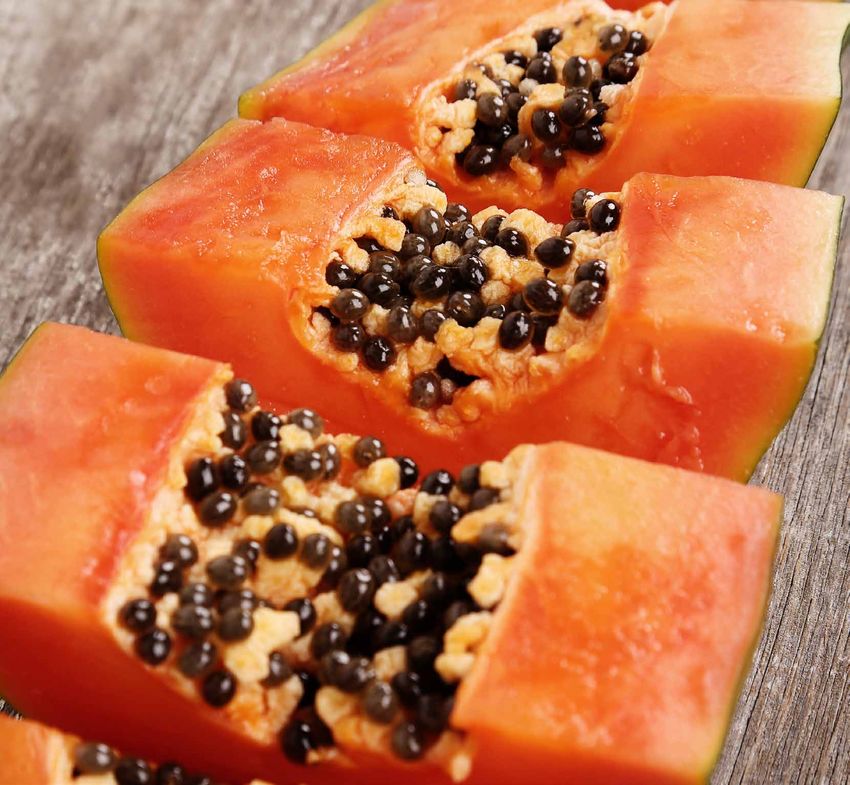
with production of 13,949 tonnes in 2015 for a value of The terms papaya and papaw are referred to differentiate
$25.2 million. Over 90 per cent of production comes from the product in the papaya industry 1. Red papaya and yellow
Queensland with growers spread between Bundaberg and papaws are predominately grown in the warmer tropical
Lakeland, located in the Shire of Cook. Product is either climates areas of Tully, Mareeba, and Innisfail to Mosman in
yellow, referred to as papaw, or red fleshed, known as Far North Queensland. There are new plantings in Lakeland,
papaya. Papaya grows all year round and because of this the North Queensland as well as in Darwin, Northern Territory
industry has the capacity to provide consistent supply of fruit and Kununurra, Western Australia1. Both are available all year
to consumers and year-round income to growers. round with increased supply during spring and autumn.
There are over 130 growers in Australia but production is Currently papaw and papaya varieties are based on a
dominated by several large producers. Growers produce range of commercially available Australian-produced hybrid
different varieties that include hybrids of both yellow and red varieties (papaw – 1B and 13, papaya – RB1, RB2, RB4),
breeds. Understanding consumer taste provides the best imported seed and grower-bred seed stock 2,3. Red-fleshed
basis for determining how varieties should be developed Hybrid RB1, Sunrise Solo, Linda Solo and Sunset Solo are the
through additional research such as the breeding program. most popular papaya varieties grown in North Queensland4.
Commercial lines and breeding lines will conduct taste trials to
incorporate consumer preferences with the breeding project. Papaya grown in Queensland can be transported to all
Australian states and territories except Western Australia.
Production occurs in tropical areas and the crops are Western Australia currently prohibits entry of Queensland
susceptible to a variety of pests and fungal disease. Some papaya for pest and disease quarantine reasons.
of these pests and diseases also affect other fruit varieties Fruit consigned to Tasmania, Victoria, South Australia and
and there is opportunity for collaboration on research in certain areas within New South Wales must be produced
these areas. Specific research in papaya to address ongoing and treated under specific Interstate Certification Assurance
improvements in production and development of varieties (ICA) schemes4.
that are resistant to some of the pests and diseases will
provide benefits across the industry.
Papaya is viewed as a fruit that has good opportunities to
significantly expand within the domestic market but to do
this the industry needs to develop a consistent product so
the retailers and consumers have confidence in the ongoing
quality and supply.
HORT INNOVATION 6 PAPAYA STRATEGIC INVESTMENT PLAN – 2017-2021
SECTION 1: CONTEXT

Figure 1: Fresh papaya production by state 2014/15 (Source: Horticulture Innovation Australia, Australian Horticulture Statistics Handbook 2014/153)

                    Queensland         85%
                    Western Australia    8%
                    Northern Territory 7%

Transportation is through refrigerated road transport to                    Location and extent of production
wholesale markets. Wholesale transportation to retail is
predominantly through unrefrigerated road transport5.                       The majority of papaya is produced in Queensland (over
The supply of premium quality fruits to distant interstate                  90 per cent in North Queensland) with smaller scale
markets continues to be a challenge. Supply chain                           production in the Northern Territory, Western Australia and
management research conducted by Agri-Science                               New South Wales. The distribution of production in 2014/15
Queensland (DEEDI) with funding from Australian Centre                      was 85 per cent in Queensland, eight per cent in Western
for International Agricultural Research (ACIAR) is currently                Australia and seven per cent in the Northern Territory3. The
looking at the interaction of fruit maturity at harvest, post-              2015/16 production has been influenced by the lack of rain
harvest fungicide application and ripening and transport                    and higher temperatures7.
temperature on the out-turn of fruit 2.
                                                                            The Australian Horticulture Statistics Handbook 2014/15
The best storage and transport conditions for ripe papaya                   states that the production volume of papaya was 13,949
are 13° Celsius with a relative humidity of 90 per cent. The                tonnes for the year ending June 2015, which is an increase
fruit is packed in a single layer cardboard or polystyrene                  on the prior year.
carton with 30-litre cartons generally used for yellow papaw
and 18-litre cartons for red papaya. Inside the box, the fruit              The number of growers is estimated at around 130. There is
is protected from damage with poly socks or paper wraps4.                   a trend toward larger growing operations and fewer growers
Fruit is ripened by storing between 20-25˚ Celsius1.                        overall. A significant proportion of production enterprises are
                                                                            family farms7.
Dependent on the year, between 30 to 60 per cent of the
Australian crop will come from the two largest producers.

The majority of papaya is
produced in Queensland
(over 90 per cent in North
Queensland) with smaller scale
production in the Northern
Territory, Western Australia
and New South Wales.

HORT INNOVATION                                                       7                            PAPAYA STRATEGIC INVESTMENT PLAN – 2017-2021
SECTION 1: CONTEXT

Domestic markets                                                                 Queensland. New varieties will consider the flavour profiles
                                                                                 with the intention of more accurately marking the different
Market research indicated that the major growth has been in                      flavours and building this into the breeding program. Other
the red varieties9. In 2012, red-fleshed papaya lines occupied                   considerations are productivity, flesh colour and Papaya
35 to 40 per cent of the market with the traditional yellow-                     ringspot virus (PRSV) resistance. This also has the capacity
fleshed papaw occupying 60 to 65 per cent of the market.                         to benefit other countries affected by Papaya Ringspot Virus
In 2016, around 75 per cent of the market was red and only                       including the United States, parts of Europe, Asia, the Middle
25 per cent was yellow 10. This shows a rapid transition in the                  East and South America11.
industry toward the higher taste, more visually appealing fruit.

  Market                             2012/13       2013/14      2014/15
                                                                                 Consumers and consumer research
 Production volume (tonnes)           12,704        15,138       13,949          The average papaya consumer purchases papaya every
                                                                                 34 days (compared to an average period of 44 days for the
 Production value ($ million)             $20        $24.9           $25.2
                                                                                 tropical fruit category). Like most tropical fruits, there is a
 Fresh imports volume (tonnes)              0          244            162        high reliance on second time purchasers to drive category
 Fresh imports value ($ million)           $0         $0.7            $0.5       growth, with total volume of purchase driven by 10 to 20 per
                                                                                 cent of the consumer households. A significant proportion
 Fresh exports volume
 (tonnes)
                                            3           18              2        of these consumers prefer to purchase pre-cut papaya (flesh
                                                                                 exposed) primarily due to preference for smaller portion
 Fresh exports value ($ million)
SECTION 1: CONTEXT

Figure 2: Gross production value of papaya for major producers and Australia (2008, 2013 and five-year growth)
(Source: FAOSTAT, Value of Agricultural Production by Country (2015) 8)

                 1,550

                 1,350

                 1,150

                  950
   USD MILLION

                  750

                  550

                  350
                                                                                                                                             141.25%
                  150                                            56.33%
                                         -1.28%                                           8.27%                    -46.22%
                  -50
                         2008    2013    %grwt    2008   2013    %grwt    2008    2013    %grwt   2008    2013      %grwt    2008     2013      %grwt

                                Brazil                   India                   Mexico                  Nigeria                    Australia

yy Considered one of the superfoods.                                                 Competitors and the nature of competition
                                                                                     International papaya producers

                                                                                     The major countries that produce papaya are India, Brazil,
                                                                                     Nigeria and Mexico8. Mexico, Belize (99 per cent of its
                                                                                     production) and Brazil are major exporters. United States and
                                                                                     then Singapore are the largest importers, mainly from other
                                                                                     Asian countries13. Figure 2 indicates the percentage growth
                                                                                     of the value of production for the key papaya producers
                                                                                     and its comparison to Australia, between 2008 and 2013.
                                                                                     Although Australia’s production value is substantially lower
                                                                                     than that of the major producers, Australia’s industry has
                                                                                     increased at a greater rate than the other countries for the
                                                                                     2008 to 2013 period.

                                                                                     It is difficult for Australian growers to compete in most
                                                                                     international markets because of the high cost of production
                                                                                     in Australia compared to Asian competitors. An opportunity
                                                                                     may exist to export to New Zealand, given its relative
                                                                                     closeness and existing, although, historically, there have
                                                                                     been small exports to this market.

                                                                                     Australia imported 162 tonnes of fresh product in 2014/15
                                                                                     mainly from Fiji3,14 while only two tonnes were exported.
                                                                                     In 2013 it was reported that Fijian papaya imports into
                                                                                     Australia had ceased due to the prevalence of bacterial
                                                                                     crown rot, although the Fijian industry and government
                                                                                     remained committed to overcoming the biosecurity risk and
                                                                                     regaining access to the Australian market5. The absence
                                                                                     of Papaya ringspot virus (PRSV) in Fiji provides a major
                                                                                     advantage compared with other competing papaya
                                                                                     producing locations such as Hawaii, Philippines and Australia.
                                                                                     Fiji consistently produces the Solo Sunrise red variety,
                                                                                     combining exceptional sweetness and flavour 14.

HORT INNOVATION                                                                  9                            PAPAYA STRATEGIC INVESTMENT PLAN – 2017-2021
SECTION 1: CONTEXT

Most processed products containing papaya are imported.
                                                                                             Consumer metrics

                                                      2 tonnes
                                  Fresh Export
                                                    < $0.1 million                     17%          731g          585g
SECTION 1: CONTEXT
disease control for two destructive papaya diseases, root Marketing systems and structures
rot (Phytophthora palmivora) and Black Spot (Asperisporium
caricae)2. The following companies are major producers of papaya:
yy Skybury Tropical Plantation (Mareeba)
The papaya and melon industries are working together to
find a solution as both are affected by the same disease and yy Lecker Farming (Mareeba)
there is a multi-agency project, funded by Hort Innovation, on yy Mackays Marketing (Tully).
integrated management of FSB.
Operating environment
The papaya industry
Strengths yy Healthy product available all year with tremendous nutritional benefits
yy Consumer awareness of the health benefits
yy Industry connections and communication
yy Good R&D expertise available with rapid time line to develop new varieties
yy Low cost of entry
yy Established, albeit small, levy program with federal support for use in R&D and marketing
yy Plentiful seed stock
yy Crops provide product year round.
Weaknesses yy Poor perception of fruit taste particularly in older demographic categories
yy Supply chain and cold chain issues affecting quality of a fragile product
yy Labour intensive harvesting practices
yy No industry standard product for supply into main retail market and inconsistent quality.
Opportunities yy Improved industry information and data sharing to advance production methods, supply chain forecasting,
handling techniques and biosecurity defences
yy Links to and use of the research conducted in Fiji by ACIAR
yy Co-operative marketing campaign to raise awareness of the health benefits of papaya with melon and
cross category promotion
yy Identify products that can be supplied consistently to target major retail markets.
Threats yy Regulatory changes such as the ‘backpacker tax’ and compliance with The Reef Water Quality Programme19
yy Extreme weather events such as cyclones and low rainfall
yy Competition from other exotic tropical fruits
yy Biosecurity breaches and the subsequent cost of quarantining against endemic and imported pests
especially ringspot and fruit fly
yy Increasing costs of supply chain with transportation being one of the major impacts on profitability.
HORT INNOVATION 11 PAPAYA STRATEGIC INVESTMENT PLAN – 2017-2021SECTION 1: CONTEXT
Promotion and market development Hort Innovation reported in 2016 that a marketing campaign
worth $129,330 included 109 in-store demonstrations
The following are the organisations involved with promotion in Coles and Woolworths and independent retailers by
and industry development: trained ambassadors. The campaign was designed to
yy Papaya Australia Ltd (National peak body) increase awareness and talk about the differences between
papaw and papaya. It found that 73 per cent of buyers had
yy Innisfail Papaw and Papaya Growers Association
previously tried it with health benefits being the primary
yy Mareeba District Fruit & Vegetable Growers Association Ltd reason for buying12.
yy Northern Territory Horticultural Association (NTHA) which
Levy funds collected for marketing are relatively small which
represents horticulture producers in the Territory7
limits the scope of promotional activity. Liaison with similar
yy Hort Innovation helps grow the Australian industry as sized industries has been cost effective with co-operation
a whole and has recently implemented a method of between the persimmon, pineapple and papaya industries
providing information through three channels – Growing promoting together at the 2015 Sydney Royal Easter Show.
Innovation, Hortlink and Grower Intel12. The cost was reported to be four times less than traditional
in-store demonstrations18.
HORT INNOVATION 12 PAPAYA STRATEGIC INVESTMENT PLAN – 2017-2021SECTION TWO
2
Papaya industry
outcomes
The following outcomes have been identified by growers and listed in order of priority as identified through the SIP logic
process outlined in Section 4 of this plan. These prioritised areas will be the focus areas of this plan.
OUTCOME 1
Increased quality to ensure consistency of supply to the consumer
While a number of growers are producing quality product, the lack of a standard product across the industry means that
consumers cannot have confidence that quality and taste will be replicated between purchases. Adoption of standard product
and product branding for both pawpaw and papaya to supply into retail chains could lift consistent demand for product and
complement current niche marketing efforts by individual growers.
This combined with inconsistent harvest and postharvest practices result in poor uniformity along with reduced shelf life for
up to 40 per cent of production. Research and adoption of best practice harvest and supply chain management processes is
needed to ensure a high quality, consistent fruit reaches the consumer more often.
OUTCOME 2
Access to new varieties and improved pest and disease management improves growers’ productivity and profitability
Effective pest and disease management is a challenge for the industry requiring ongoing investment. The industry plans to
combat disease through improved access to effective chemicals, as well as the development of new varieties that appeal to the
consumers and are resistant to disease and pests.
Consumer demand for healthy foods for themselves and their families are increasing. The industry needs to develop and adopt
an IPDM plan including the development of organic processes to meet these consumer expectations.
By 2021, the industry would like to have developed two new superior varieties with advances in low impact/chemical-free plant
health, disease, pest and environmental management.
HORT INNOVATION 13 PAPAYA STRATEGIC INVESTMENT PLAN – 2017-2021SECTION 2: PAPAYA INDUSTRY OUTCOMES OUTCOME 3 Improved market access and increased consumer demand increases returns to growers The health benefits of papaya are known by consumers who are familiar with the fruit, however, taste perceptions of older varieties and inconsistent quality have increased papaya price sensitivity and impacted consumer willingness to buy more frequently. To support demand and increase the frequency of purchases, marketing initiatives to debunk flavour perceptions and the potential uses of green, yellow and red papaya are being developed to help build on papaya’s positive health image. Success in these areas could significantly increase demand in the eastern states. Papaya does not currently have market access to Western Australia and Tasmania. Although the markets in these states are relatively small when compared to the potential growth in eastern states, establishing treatment protocol for Black Spot and compliance with the state quarantine protocols to access these states will assist growers to prepare for requirements related to the export market. While the industry would struggle to be competitive with Asian producers because of their low cost base, there are opportunities to export to New Zealand. In order to successfully and sustainably compete in export markets growers will need to commit to building a reliable supply so that when productions spikes there are channels in place to shift excess fruit. As a result of improved quality, combined with effective marketing initiatives and improved market access, the industry expects prices to rise by 35 per cent to $2.16 per kilogram as production increases by over 50 per cent to 25,000 tonnes by 2021 which, if achieved, could double the value of the industry. HORT INNOVATION 14 PAPAYA STRATEGIC INVESTMENT PLAN – 2017-2021
SECTION THREE

Papaya industry
                                                                                                               3
priorities

Industry investment priorities
The information below describes the outcomes, strategies and possible deliverables that will be the initial priorities of this plan.
Highest-priority strategies or activities for the initial stages of the plan are indicated in bold. The ability to deliver on all the
articulated strategies (and investments) will be determined by the ability of the statutory levy to provide the resources to do so.
The priorities will lay the foundation for future investment and the implementation of this plan will require a balanced approach to
ensure the industry has a high likelihood of success over the short-, medium- and long-term.

 OUTCOME 1 – Increased quality to ensure consistency of supply to the consumer

 STRATEGIES                                               POSSIBLE DELIVERABLES

 1.1 Engage with consumers to identify preferred          yy Understanding of consumer taste and flavour preferences
 taste and bring this understanding back to farm          yy Identified standard varieties that meet consumer preference to be
 so growers can consistently provide quality fruit           supplied by industry through retail channels
 meeting consumer expectations
                                                          yy Growers support industry-wide approach to variety adoption

 1.2 Increase grower focus on quality through             yy Best management practices have been documented
 improved engagement and dissemination of best
                                                          yy Training and support is provided to growers to increase adoption
 practice information
                                                             rates of best practices

 1.3 Research and adopt improved postharvest              yy Guidelines on supply chain best practice have been developed and
 packing, treatment protocols, storage, distribution         published
 and retailer processes to improve quality and            yy Provide training and support to help the supply chain adopt best
 increase shelf life                                         practice storage and distribution

HORT INNOVATION                                                  15                          PAPAYA STRATEGIC INVESTMENT PLAN – 2017-2021
SECTION 3: PAPAYA INDUSTRY PRIORITIES
OUTCOME 2 – Access to new varieties and improved pest and disease management improves growers’ productivity and profitability
STRATEGIES POSSIBLE DELIVERABLES
2.1 Continue research, trials and adoption of yy New chemicals, processes and methods are identified for pest and
chemical and other processes use trials for disease management
effective pest and disease management yy Cost benefit analysis validates and encourages the adoption of new
processes and methods
yy Training and support on how to adopt new processes is provided to
growers
yy Registrations and permits for existing chemicals are maintained until
they can be substituted effectively
2.2 Continue research and commercialisation yy Varieties offering superior flavours, appearance and disease
of new genetically improved varieties that offer resistance are available to and marketed by growers
increased disease resistance and consumer appeal
2.3 Develop and adopt an IPDM plan yy IPDM plan has been developed for the industry including how to
produce organic papaya
yy Benefit cost analysis helps growers decide which approaches to
implement for their business
2.4 Continue to research and refine agronomic yy Research into improved soil, nutrition, water and plant management
practices to improve productivity, quality and has been conducted and adopted by industry
environmental outcomes
OUTCOME 3 – Improved market access and increased consumer demand increases returns to growers
STRATEGIES POSSIBLE DELIVERABLES
3.1 Increase demand in existing domestic markets yy In collaboration with other industries, increase awareness through
through understanding of consumer preference sampling and in-store marketing display and tasting activity
and targeted marketing around these preferences yy Marketing targeted at segments to maximise purchase volume
3.2 Provide opportunities to access domestic and yy Biosecurity issues for domestic and international market access have
international new markets been identified and addressed
yy Export market development plans have been developed
yy Engage international supply chain stakeholders to identify grower led
pathways for export
3.3 Support research, development, adoption yy Health benefits and potential health claims have been researched
of growing practices and marketing initiatives and validated so they can be used in marketing initiatives
to position papaya a naturally grown fruit with yy Growers practices support development of a ‘healthy product’
significant health benefits marketing approach
HORT INNOVATION 16 PAPAYA STRATEGIC INVESTMENT PLAN – 2017-2021SECTION 3: PAPAYA INDUSTRY PRIORITIES
Aligning to Hort Innovation investment priorities
In establishing investment priorities, Hort Innovation analysed both historical and current levy and co-investment portfolios
and priorities. From this analysis, we identified 11 cross-sectoral investment themes. We consolidated these themes further and
considered their alignment with the Australian Government’s Rural RD&E Priorities and National Science and Research Priorities,
to arrive at five investment priorities outlined in Figure 4. Figure 4 also shows how each cross-sectoral investment theme relates to
the five investment priorities.
Figure 4: Hort Innovation’s investment priorities
Pest and disease management
Support Invest in R&D, extension and marketing activities
that deliver crop production, pest and disease
Crop production industry efficiency management sustainability improvements and
and sustainability address the everyday needs of industry.
Sustainability
Improve Discover, develop and deploy innovative
productivity of technologies to increase international and
Novel technologies the supply chain domestic competitive advantage and profitability
through innovative for growers.
technologies
Data insights Grow Grow the capacity of the industry by driving
the horticulture grower and supply chain capabilities and
value chain delivering industry and market intelligence.
Industry development capacity
Domestic market development
International market development,
Drive Ensure produce is of the highest quality, and drive
market growth through strategically targeting
market access and trade long-term domestic new and expanding export opportunities, and
and export growth stimulating domestic market growth.
Product integrity
Lead Deliver operational excellence that provides
Corporate services strategically to enhance investor satisfaction and tangible returns by
the development of the creating and managing high priority investments
Australian horticulture as a result of collaboration with growers and other
Strategic drive industry through investment partners.
operational excellence
The identified investment priorities for papaya cover the five investment priorities for Hort Innovation through refining the industry
focus in terms of varieties enabling the industry to improve productivity and efficiency but being more responsive to consumer
demand. This approach will lead to an increase in domestic demand and mean position the industry to enter new domestic and
export markets. A focus on improving variety resistance to disease and pests will enable it to present a healthier sustainable
product improving its long-term sustainability. Development of better quality, consumer driven priorities will help in working with
the supply chain to deliver better value chain outcomes.
HORT INNOVATION 17 PAPAYA STRATEGIC INVESTMENT PLAN – 2017-2021SECTION 3: PAPAYA INDUSTRY PRIORITIES
The alignment of the papaya SIP outcomes to the Hort Innovation investment priorities, and consequently, the Australian
Government’s Rural RD&E Priorities and National Science and Research Priorities is shown in Table 1.
Table 1: Papaya SIP outcomes alignment to the Hort Innovation investment priorities
Hort Innovation investment priorities Papaya SIP outcomes
Support industry efficiency and sustainability Outcome 1: Increased consistency and quality of papaya
Outcome 2: Access to new varieties and improved pest and
disease management improves growers’ productivity and
profitability
Outcome 3: Improved market access and increased consumer
demand increases returns to growers
Improve productivity of the supply chain Outcome 2: Access to new varieties and improved pest and
disease management improves growers’ productivity and
profitability
Grow the horticulture value chain capacity Outcome 1: Increased consistency and quality of papaya
Outcome 2: Access to new varieties and improved pest and
disease management improves growers’ productivity and
profitability
Drive long-term domestic and export growth Outcome 1: Increased consistency and quality of papaya
Outcome 3: Improved market access and increased consumer
demand increases returns to growers
Lead strategically to enhance the development of the Enabler
Australian horticulture industry through operational
excellence
HORT INNOVATION 18 PAPAYA STRATEGIC INVESTMENT PLAN – 2017-2021SECTION FOUR
4
Papaya monitoring
and evaluation
Papaya SIP monitoring, evaluation The SIP outcomes and strategies will be used to inform
investments in individual projects to deliver on the SIP.
and reporting The results of M&E will be used to reflect on the results of
A SIP program logic and monitoring and evaluation (M&E) investments and in decision-making. Hort Innovation will
plan has been developed for the papaya SIP. These are facilitate the regular review of SIPs to ensure they remain
informed by the Hort Innovation Organisational Evaluation relevant to industry.
Framework. The logic maps a series of expected
consequences of SIP investment. The M&E plan shows the
performance measures that will be measured to demonstrate
progress against the SIP and what data will be collected.
Progress against the SIP will be reported in Hort Innovation
publications and at industry SIAP meetings.
HORT INNOVATION 19 PAPAYA STRATEGIC INVESTMENT PLAN – 2017-2021SECTION 4: PAPAYA MONITORING AND EVALUATION
Papaya SIP logic
An indicative papaya SIP program logic is shown in Figure 5. The logic is based on the Hort Innovation SIP logic hierarchy
(Appendix 3). The highest-priority strategies or activities in the deployment of the initial stages of the plan are indicated in bold.
Figure 5: Papaya SIP logic
Lead strategically
Improve productivity to enhance the
Support industry Drive long-term
Hort Innovation of the supply chain Grow the horticulture development of the
efficiency and domestic and export Australian horticulture
investment priorities through innovative value chain capacity
sustainability growth industry through
technologies
operational excellence
1. Consumers 2. Improved 3. Increased
have access to a environmental returns to growers
End-of-SIP
consistent supply of 2. Improved outcomes
outcomes
quality papaya productivity
Increased
consumer New domestic
demand and international
market
Growers are Improved soil, opportunities are
consistently nutrition, water leveraged
providing Reliance Pest and disease and plant
quality fruit that on existing management is management
meets consumer chemicals is improved Opportunities to
expectations reduced access domestic
Intermediate and international
outcomes markets are
Consumers provided
respond to
Growers adopt Varieties offering Growers adopt new pest marketing,
quality and superior flavours, and disease management incl. ‘healthy
Growers have an supply chain best appearance and chemicals, processes product’ Growers
understanding practices, incl. disease resistance and methods, IPDM and approach support ‘healthy
of consumer for storage and are adopted by other agronomic practice product’
preferences distribution growers improvements approach
1.1 Identify, and provide to 2.1 Research, trial and support adoption of, new
Strategies 3.1 Targeted marketing
growers, customer taste chemicals, processes and methods for pest and
and developed and
preferences; disease management;
indicative implemented;
1.2 Improved engagement and 2.2 Continue research into, and commercialisation
activities 3.2 Domestic and
dissemination of best practice of, opportunities for improved disease resistance
international market
information; and consumer appeal;
development activities;
1.3 Research, document, and 2.3 Develop and an adopt IPDM plan;
3.3 Activities to support
support adoption of, supply 2.4 Research, and support adoption of,
‘healthy product’ approach
chain best practice continuous improvement to agronomic practices
HORT INNOVATION 20 PAPAYA STRATEGIC INVESTMENT PLAN – 2017-2021SECTION 4: PAPAYA MONITORING AND EVALUATION
Papaya SIP M&E plan
The papaya M&E plan is shown in Table 2. The table includes key performance indicators (KPIs) and data collection methods both
at a macro/industry (trend) level and at more specific SIP level/s. Highest-priority strategies or activities for the deployment of the
SIP in the initial stages of the plan are indicated in bold.
Table 2: Monitoring and evaluation plan for the papaya SIP
Data collection methods
Outcome Strategies KPIs and sources
OUTCOME 1: 1.1 Engage with consumers to yy Identification of yy Agreement of industry
Increased identify preferred taste and bring this nominated varieties to be representatives on
consistency and understanding back to farm so growers industry standard varieties
quality of papaya can consistently provide quality fruit
yy Industry providing yy Monitor of varieties
meeting consumer expectations
increased volume of new sold through capital city
1.2 Increase grower focus on quality varieties by 2021 wholesale markets
through improved engagement yy Adoption rates of supply yy Annual survey of retail
and dissemination of best practice chain best practice waste and consumer
information satisfaction
1.3 Research and adopt improved yy Grower/industry survey
postharvest packing, treatment
protocols, storage, distribution and
retailer processes to improve quality
and increase shelf life
OUTCOME 2: 2.1 Continue research, trials and yy Trials underway for three yy R&D project records
Access to new adoption of, chemical and other improved disease and
yy Production data
varieties and processes use trials for effective pest pest resistant varieties
improved pest and disease management by 2021 yy Grower survey
and disease
2.2 Continue research and yy Adoption of improved
management
commercialisation of new genetically APDM and agronomic
improves growers’
improved varieties that offer increased practices
productivity and
profitability disease resistance and consumer appeal
2.3 Develop and adopt an IPDM plan
2.4 Continue to research and refine
agronomic practices to improve
productivity, quality and environmental
outcomes
OUTCOME 3: 3.1 Increase demand in existing yy Evidence of improved yy Retail and consumer
Improved market domestic markets through industry understanding insights data
access and understanding of consumer preference and meeting of consumer
yy Grower survey
increased consumer and targeted marketing around these preferences
demand increases preferences yy Trade data
yy Evidence of improved
returns to growers
understanding of export yy DAWR
3.2 Provide opportunities to access
domestic and international new markets market opportunities and
market access
3.3 Support research, development, yy An increase in exports to
adoption of growing practices and New Zealand
marketing initiatives to position
papaya as a naturally grown fruit with yy Path to commercialisation
significant health benefits established for at least
two certified varieties
HORT INNOVATION 21 PAPAYA STRATEGIC INVESTMENT PLAN – 2017-2021SECTION 4: PAPAYA MONITORING AND EVALUATION
Reporting
The program framework in Figure 6 is the mechanism that links Hort Innovation’s strategy and investment priorities to the
investment process through the industry SIP. SIPs assist Hort Innovation to prioritise based on advice and available resources to
implement the specific industry R&D, extension and marketing programs.
Hort Innovation will use dynamic reporting against our monitoring and evaluation framework to report on investment progress.
The contribution of investments to each industry outcome will be reported regularly, including through industry Annual Reports,
Hort Innovation’s Annual Report and Hort Innovation’s Annual Operating Plan..
Figure 6: Hort Innovation’s program framework
Alignment to Program framework
Hort Innovation’s Strategy
Pest and disease management
Costs Costs
Crop production Costs Costs
Key
Costs Costs
Program Deliverables
Outcomes
Outcomes performance Costs
prioritisation (outputs)
Sustainability indicators
Specific key performance
Novel technologies indicators and costs
for projects under each
Data insights Fund Strategic portfolio will be known
after the fund SIP is
Investment Plan implemented
Consultation
Industry development
Domestic market development
International market development, Advice
market access and trade Investment
Product integrity
Corporate services
Monitoring and evaluation
Strategic drive
Defines how the fund aligns to
Hort Innovation’s five investment
priorities and 11 cross-sectoral
investment themes
HORT INNOVATION 22 PAPAYA STRATEGIC INVESTMENT PLAN – 2017-2021SECTION FIVE
Impact assessment
5
Figure 7: Economic benefit from investment in the papaya SIP
18
Inset image
16
INDUSTRY VALUE (AUD MILLION)
14
12
10
Industry economic impact from SIP
8
Other industry benefits
6 Increased production and export benefits
4 Current production trend
2
–
12
13
14
15
16
17
18
19
20
21
22
23
24
25
26
27
28
29
30
31
20
20
20
20
20
20
20
20
20
20
20
20
20
20
20
20
20
20
20
20
900
Inset image
INDUSTRY VALUE (AUD THOUSAND)
800
Industry economic impact from SIP
700 Other industry benefits
Increased production and export benefits
600
500
400
300
200
100
–
12
13
14
15
16
17
18
19
20
21
22
23
24
25
26
27
28
29
30
31
20
20
20
20
20
20
20
20
20
20
20
20
20
20
20
20
20
20
20
20
An independent assessment of the potential economic impacts from investment into the papaya SIP indicated a positive return on
investment for the industry (Figure 7). The anticipated investment of $2.40 million over the next five years in R&D, extension and
marketing activities is expected to generate $10.03 million in net benefits for the industry, representing a benefit cost ratio of 4.18
times to growers and service providers along the value chain.
The assessment draws from a wide range of available data sources, and projects economic impacts over a 15-year period starting
from 2016/17. A five per cent discount rate has been applied and all values are adjusted for inflation and presented in 2016/17 dollar
terms. The assessment takes a highly conservative approach and the presented figures have been adjusted to account for risks
associated with achieving research outputs, expected adoption and impacts.
HORT INNOVATION 23 PAPAYA STRATEGIC INVESTMENT PLAN – 2017-2021SECTION 5: IMPACT ASSESSMENT
Table 3 provides a summary of the impacts assessed for the SIP, their corresponding outcomes, net economic benefits and
benefit cost ratio.
Table 3: Summary of assessed impacts for each SIP outcome
Anticipated Net
SIP investment benefits Benefit cost
Outcome Expected deliverables (over five years) (over 15 years) ratio
Outcome 1: Increased yy Necessary to drive Incorporated
N/A N/A
consistency and quality of papaya quantified impacts below
Outcome 2: Access to new
varieties and improved pest and yy Increase in prices and
disease management improves increase in production $9,336,136
growers’ productivity and sold
productivity
$2,401,507 4.18
Outcome 3: Improved market
access and increased consumer yy Increase in exports sold,
$696,614
demand increases returns to at projected prices
growers
All impacts $2,401,507 $10,032,750 4.18
The quantified impacts associated with the SIP Outcomes 2 yy An increase in exports to 200 tonnes by 2020/21,
and 3 include: at current projected pricing.
yy An increase in prices to $2.16 by 2020/21 Sales to export markets will rely on provision of market
yy Production sold increasing to 25,000 tonnes by 2020/21. access to both new and existing international markets.
In order to deliver increased production volumes, continued Outcome 1 was not quantified, as it is a necessary
chemical pest and disease management research will be precursor to delivery of Outcomes 2 and 3, and the
required, alongside integrated pest management strategies. associated quantified impacts. The identification of an
The use of genetic improvement to develop disease resistant industry standard that provides consistency and quality
varieties will also enable the increased production. for consumers will enable the increase in both price and
quantity in the domestic market, and the expansion of
In order to improve prices for these sales volumes, genetic export volumes.
improvement must also focus on consumer appeal, and
targeted marketing strategies will be used to drive domestic
demand, with a focus on the health benefits associated
with papaya.
HORT INNOVATION 24 PAPAYA STRATEGIC INVESTMENT PLAN – 2017-2021SECTION SIX
6
Risk management
The purpose of this risk section is to highlight any unique or grow their business through best practice management,
specific risks that qualify the SIP. This is not intended to be variety selection and marketing. The lack of a widespread
an exhaustive risk review of the industry risks, which in part industry view limits potential overall growth because co-
are considered in the SWOT. This is also not reflective of the ordinated activity about variety selection, marketing, disease
general investment risks, which will be considered in the and pest management and other factors. The impacts of this
project investment process. lack of industry consistency needs to be understood and
managed if identified outcomes are to be realised.
Papaya growers are currently segmented into a few large
growers and a number of smaller growers. This means that
there are several growers with the resources to successfully
HORT INNOVATION 25 PAPAYA STRATEGIC INVESTMENT PLAN – 2017-2021APPENDICES
APPENDIX 1: APPENDIX 2:
Process to develop this plan Consultation and validation
The process to develop the SIP was as follows: The following individuals contributed to the development of
this SIP and their contribution is greatly appreciated.
1. ABCD analysis discussions were held at the inaugural
SIAP meeting on July 18, 2016 Name Industry Role
2. The context was developed through desktop research Gerard Kath Papaya Australia President
and engagement with growers and researchers between
October and December 2016 Joe Zappala Grower
3. An industry-wide online survey was issued to gain greater Daniel Mackay Grower
feedback on identified outcomes and to identify any gaps
in the requirements of the industry Mark MacLaughlin Grower
4. The draft outcomes and strategies were validated Hayden Dazenervie Grower
with one on one phone calls to key growers and SIAP
members in December 2016 Yan Diczbalis Queensland Department of
Agriculture and Fisheries
5. The monitoring and evaluation analysis was conducted by
Clear Horizons in December 2016
6. The impact assessment analysis was conducted by
Consulting & Implementation Services (CIS).
HORT INNOVATION 26 PAPAYA STRATEGIC INVESTMENT PLAN – 2017-2021APPENDICES
APPENDIX 3:
Logic hierarchy
To grow the future of
Vision Australia’s horticulture
industries
Common for all
Increased profitability of Increased productivity of Increased global
Investment
Mission Australia’s horticulture Australia’s horticulture competitiveness of Australia’s
industries industries horticulture industries
Hort Innovation Support Improve Grow the Drive
industry productivity horticulture long-term Lead
end-of-strategy
efficiency and of the supply value chain domestic and strategically
outcomes sustainability chain capacity export growth
The industry-specific outcomes of the SIP. The final desired result of SIP investment but may be achieved
after the SIP time-frame. SIP investment may be just one contributing factor to the achievement of these
End-of-SIP
outcomes. For example, incremental productivity, profitability and competitiveness improvements stimulated
outcomes through R&D, changes in consumer awareness, marketing campaign reach and influence and increased
recognition of Australian horticulture products.
SIP specific
Short- to medium-term changes brought about through the SIP, which will support the achievement of end-
SIP intermediate
of-SIP outcomes. For example, practice changes, adoption, changes in grower knowledge, attitudes, skills
outcomes and aspirations (KASA) and marketingreach.
What is directly delivered by the SIP (R&D, extension and marketing activities and outputs, for example,
products and services, and events and engagement) across the 11 horticulture cross-sectoral investment
SIP activities
themes: Pest and Disease Management, Crop Production, Sustainability Improvements, Novel Technologies,
and outputs Data Insights,Industry Development, Product Integrity, International Market Development, Market Access
and Trade, Domestic Market Development, Strategic Drive and Corporate Services.
Preliminary or preparatory activities that are conducted before and during SIP delivery. Includes industry
Foundational
processes, infrastructure and resources that enable the SIP to be developed and delivered. Includes SIP
activities planning, consultation, advisory meetings etc.
HORT INNOVATION 27 PAPAYA STRATEGIC INVESTMENT PLAN – 2017-2021APPENDICES
APPENDIX 4:
Reference documents
1. Papaya Australia Limited. Papaya Australia. 2016 12. Horticulture Innovation Australia, Annual Report 2015/16:
8/11/2016]; Available from: http://australianpapaya.com. Breaking new ground. 2016, Horticulture Innovation
au/about/. Australia Ltd.
2. Yan Diczbalis, B.W., Mark Hickey, Papaya. 2012, National 13. Edward A. Evans, F.H.B., An Overview of Global Papaya
Horticultural Research Network. Production, Trade, and Consumption. FE913 IFAS
Extension, 2015.
3. Horticulture Innovation Australia and Freshlogic,
Australian Horticulture Statistics Handbook 2014/15. 14. Kalara McGregor, A.M., Lex Thomson and Kyle Stice,
2016. Australian Market Analysis – Fiji and Pacific Island
Papaya. 2009.
4. Queensland Department of Agriculture and Fisheries,
T.S.o.Q.D.o.A.a. Papaya. 2013 8/11/2016]; Available from: 15. Plant Health Australia Ltd, Biosecurity Manual for the
https://www.daf.qld.gov.au/plants/fruit-and-vegetables/ Papaya Industry V1.0 August 2013. 2013, Plant Heath
fruit-and-nuts/papaya. Australia.
5. Horticulture Australia Limited, Papaya Industry Strategic 16. Queensland, B., Papaya ringspot disease. 201,
investment Plan 2013/14-2017/18. 2013: Horticulture Department of Employment, Economic Development and
Australia Limited. Innovation, Queensland Government.
6. Neales, S., Pawpaw dreaming: try it, then love it … and 17. Department of Agriculture and Water Resources, A.G.
the sky’s the limit, in The Weekly Times. 2016, News Corp Papaya levy information. 2016 8/11/2016]; Available from:
Australia. http://www.agriculture.gov.au/ag-farm-food/levies/rates/
papaya.
7. Horticulture Innovation Australia, Papaya. 2016; Available
from: http://horticulture.com.au/grower-focus/papaya/. 18. Horticulture Innovation Australia, Pineapple, Papaya and
Persimmon industries join forces at the Sydney Royal
8. Food and Agriculture Organization of the United Nations, Easter Show. 2015 10/11/2016]; Available from: http://
Value of Agricultural Production by Country 2015. horticulture.com.au/pineapple-papaya-and-persimmon/.
9. McKillop, C., Record papaw production driven by drier, 19. Australian Government National LandCare Programme.
warmer weather and increased plantings. 2015, ABC The Australian Government Reef Programme. 2016
Rural. 26/10/2016]; Available from: http://www.nrm.gov.au/
national/continuing-investment/reef-programme.
10. Akers, T., Queensland Business Monthly: Griffith
University research puts papaya farms in sweet spot,
in Courier Mail. 2016.
11. Horticulture Innovation Australia, Research to boost
Queensland papaya quality, trade appeal. 2016
8/11/2016]; Available from: http://horticulture.com.au/
growing-innovation-issue4-papaya/.
HORT INNOVATION 28 PAPAYA STRATEGIC INVESTMENT PLAN – 2017-2021APPENDICES
APPENDIX 5:
Outputs of industry engagement
ABCD Analysis – Papaya SIAP
VISION: WHERE DO WE WANT TO BE?
Price/kg >$2.16/kg (based on 2016 CPI)
Sydney wholesale sale price on stand Harvest 2M–2.5M cartons/year
therefore BNE $2.06 and Melb $2.26 Export 12 pallets/week = 600T per year 25,000T
3-5 YEARS
Genetic Improvements
Chemical access
–G rowing practices impact here and review of access and priorities with the SARP.
Include dieback, FSB and Phytophthora in particular especially with more organic
practices
1-2 YEARS
Breeding and industry development project
–A lign taste profile with traits that are preferential and match with current
commercial varieties and breeding program varieties then match this with
consumer preferences
– Identify health benefits and possible claims that could be used in marketing –
further research into the health profile of papaya
STRATEGY: ACTIONS Chemical access
TIME
HOW DO WE DRIVEN BY –G rowing practices impact here and review of access and priorities with the
GET THERE? STRATEGY SARP. Include dieback, FSB and Phytophthora in particular especially with
more organic practices
0-6 MONTHS
Genetic Improvements
Post harvest – uniform consistency and shelf life
–S ometimesYou can also read