Quality Management at Kentucky Fried Chicken
←
→
Page content transcription
If your browser does not render page correctly, please read the page content below
Quality Management at Kentucky Fried
 Chicken
UDAY M . APTE                                           COX School of Business
                                                        Southern Methodist Universitif
                                                        Dallas. Texas 75275-0333

CHARLES C . REYNOLDS                                    KFC  National Management Company
                                                        5605 North MacArthur Boulevard. No. 650
                                                        Irving. Texas 75038

Kentucky Fried Chicken (KFC) Corporation, a member of the
quick-service restaurant industry, uses a sophisticated program
to manage the quality of service it offers to its customers. In the
last quarter of 1989, the south central division of KFC launched
a test program in four Oklahoma City restaurants to improve
the speed of service at its drive-through-window operation. It
proved extremely successful. The restaurants cut service time
by more than half while improving labor productivity. They
also dramatically outperformed other restaurants in the division
in profits, sales growth, and growth in customer transactions.
The improved processes in the test restaurants have served as
benchmarks for other KFC restaurants aiming for continuous
process improvement, while the reduced service time now
serves as the revised specification in KFC's quality measure-
ment and management program.

K         entucky Fried Chicken (KFC) Corpo-

       ration, USA, is a member of the Pep-
                                                        erated sales of over $3 billion while serv-

                                                        ing over 600 million customers. KFC bas
sico family of quick-service restaurants. Es-           several basic types of restaurants; the most
tablished in 1952, the KFC system consists              common type being a dine-in restaurant
of 2,000 company-owned and over 3,000                   with a customer seating area that includes
franchised restaurants. In 1992, KFC gen-               a condiment bar and a drive-through-
CopynfiKt fc 199S, Inslitute for Operations Ki'sodrth   [NDUSTRrtS—AGRICULTURE/FOOD
and the ManaHfmcnt Sciences                             PRODUCTION/SCHEDULING-WORK STUDIES
(KI91-2l;l2/'»S/:503/UlU)f.$UI.2.S
This pjper ivjh rfffrptd.

INTERFACES 25: 3 May-June 1995 (pp. 6-21)
KENTUCKY FRIED CHICKEN

window (DTW) designed for drive-               the creation of most services. Service cus-
through customers.                             tomers generally care about the service
   Tlie quick-service restaurant industry is   outcome and about the way a service pro-
one of the most competitive and saturated      cess is executed. Consequently, quality
industries in the United States. Growth in     management in services revolves around
market share for one company generally         managing both of these factors (Apte,
comes only at the expense of some other        Karmarkar, and Pitbladdo [1994] discuss
company's market share. The competitive        the measurement and management of ser-
pressure that restaurants in this industry     vice quality in detail). For example, KFC's
face also means that to simply hold on to      management needs to control not only the
its current customer base, a quick-service     taste, temperature, and appearance of the
restaurant must offer consistent, high-        fried chicken, but also the courtesy and the
quality service. Moreover, Improving ser-      speed of service it offers to its customers.
vice quality can also mean improved pro-          Quality management at KFC recognizes
ductivity, leading to lower costs and higher   this fundamental dichotomy by using two
profitability.                                 complementary programs for measuring
    Recognizing the importance of managing     quality: (1) The quality, service, and clean-
service quality, KFC became, in late 1970s,    liness (QSC) program for judging the qual-
an early adopter of a quality management       ity of service outcomes from the perspec-
program.                                       tive of a customer, and (2) the operations
KFC's Quality Managemeni Program               facility review (OFR) program for measur-
    Managing quality in a manufacturing        ing a restaurant's process implementation
company revolves around understanding          performance against KFC's process specifi-
customer expectations, defining product        cations. The results of these two quality
specifications based on these expectations,    measurement programs are incorporated
and subsequently ensuring that the prod-       into "Today's KFC restaurant quality pe-
ucts being manufactured (that is, the out-     riod report," a quarterly report prepared
come of the manufacturing process) con-        for senior management at KFC.
 form to the design specifications. In this       To understand customer expectations
 context, the detailed specifications of a     and to measure the company's perfor-
 manufacturing process, although of great      mance against that of its competitors, KFC
relevance to the success of the internal op-   regularly uses the following customer- and
erations of the company, are of no direct      market-oriented surveys to manage its ser-
 interest to the customer. In contrast, man-   vice quality. The results of these surveys
 aging quality in service businesses, al-      are also incorporated in the quarterly qual-
 though similar in spirit, is somewhat dif-    ity report.
 ferent and is more challenging because of        KFC hires a professional interviewing
 certain characteristics inherent to service   service to survey customers on their
 operations. These include the intangibility   impressions of product and service quality.
 of service outcome in some cases and the      It also periodically hires a consulting firm
 presence and participation of customers in    to identify important service attributes and

May-June 1995
APTE, REYNOLDS

  their relative Importance to the customers   vice, and cleanliness of each restaurant.
  of a quick-service restaurant. It uses the   Mystery shoppers are well trained to use
  understanding of customer expectations it    the standard QSC form (Figure 1) so that
 gains in designing and continually revising they perform each evaluation in an objec-
 its quality measurement schemes.              tive, accurate, and consistent manner. KFC
     KFC receives customer complaints via      revises and updates the form frequently to
 complaint cards available at ali KFC res-     ensure that it reflects the ever-changing
 taurants and through letters and phone        customer expectations, as revealed in the
 calls from customers, A KFC representative surveys.
 responds to each customer complaint by           Mystery shoppers conduct a QSC evalu-
 letter or phone. KFC also monitors and        ation of each restaurant twice a month.
 tracks the number and the types of com-       However, restaurant general managers use
 plaints different restaurants receive.        a shortened version of the same form, the
    KFC regularly uses market tracker sur-     "QSC alert form," to conduct daily self-
 veys to measure its performance on key       evaluations of their restaurants. It helps
 customer service attributes compared to      managers to take immediate improvement
 that of its competitors (such as Mc-         actions, such as instructing and helping
 Donald's and Wendy's). The customer ser- employees to perform their jobs in the
 vice attributes it tracks include speed of   right way. It also helps managers to incul-
 service, mispacks, courtesy, product qual-   cate an awareness of customer expectations
 ity, and value for money spent.              among restaurant employees.
    The quarterly quality report plays an im- Operations Facility Review
portant role in KFC's quality management         Customers expect consistent and high
program. Providing data on customer ex-       quality products and services in all KFC
pectations and KFC's performance allows       restaurants. Hence, operarional excellence
management to take immediate corrective       is critical to KFC's success. The objective of
actions. KFC's quality management pro-        the operations facility review (OFR) is to
gram also emphasizes continuous improve- help KFC to ensure nationally consistent,
ment of processes, employee empower-          high operating standards and performance
ment, and training of employees in the use in all its restaurants through the use of a
of quality management tools and               standardized evaluation program. The OFR
techniques.                                   evaluation program measures a restau-
Quality, Service, Cleanliness (QSC)           rant's performance against KFC's operating
Program                                       standards {Figure 1).
    KFC implemented the QSC program in           The OFR program parallels the QSC
1977, This program is designed to measure program except that the OFR evaluators
and evaluate quality at each KFC restau-      are KFC employees, KFC trains the OFR
rant, company owned or franchised, from       evaluators rigorously to ensure that they
the viewpoint of a customer, "Mystery         perform all evaluations in an objective, ac-
shoppers," independent individuals con-       curate, and consistent manner. Restaurant
tracted by KFC, evaluate the quality, ser-    general managers are required to complete

INTERFACES 25:3
KENTUCKY FRIED CHICKEN

                                        QSC Evaluation Form
Service Quality (50 Points)
o   Service time (total and window time)
O   Attentive, energetic, warm, and courteous service
o   Professional appearance, including wearing a uniform
o   Accuracy of order taking and filling (no missing or extra items)
o   Helpful, suggestive selling
Product Quality (30 Points)
The following criteria are measured for all products—chicken products (original recipe, crispy, hot
wings, etc.), cold and hot side items (such as cole slaw, potato salad, French fries, biscuits, etc.)
and beverages:
o Standard temperature
o Absence of visible shortening and proper breading of chicken
o Color, texture, overall appearance
o Proper filling and closing of containers

Cleanliness (20 Points)
o   Clean entrance doors and windows
o   Clean and well-supplied rest rooms
o   Clean and neat service counter and surrounding area
o   Clean and neat customer seating area
o   Neat exterior, well-maintained landscaping
                                  Operations Facility Review Form
Product/Process Quality (44 Points)
Evaluate each product using the following criteria:
o Quality standards for ingredients used
o Storage and handling of ingredients
o Cooking procedures; time, temperatures, cleanliness, etc.
o Hold time
Facilities (16 Points)
Clean, neat, and well-maintained facilities (interior and exterior) and fixtures
Customer Viewpoint—Service and Product Quality (15 Points)
Selected items from QSC form: service time, courtesy, order taking and filling accuracy, product
temperature, and appearance
Sanitation/Operations (15 Points)
o Procedures used and frequency of cleaning processes for kitchen, service counters, seating
  areas, and rest rooms
o Equipment clean, well maintained, and in good working order
Critical Issues
o   Presence of rodents, cockroaches, other insects
o   Cross contamination potential due to faulty procedures or equipment
o   Spoiled, reprocessed, or unapproved products being sold
o   Employee(s) with communicable disease

Figure 1: Kentucky Fried Chicken uses two quality management instruments, the QSC
evaluation form and the operational facility review form.

May-June 1995                                          9
APTE, REYNOLDS

 OFR evaluations for their own restaurants         vantage over the double drive-through or
 at least once a week. Managers must also          other major quick service restaurants that
run training programs for restaurant em-           used drive-through as a major portion of
ployees and maintain facilities, equipment,        their business. KFC could lose market
and premises in accordance with KFC's              share.
operating standards.                                  Slow service could also have a ruinous
Drive-through-Window Test                          impact on product innovation activity. KFC
    As a part of its major responsibilities, the   might introduce new products, but if cus-
senior management of KFC's South Cen-              tomers had to wait too long to get these
tral division {roughly the Texas and Okla-         products, they were not likely to come
homa area) routinely evaluates the divi-           back to KFC to try these products again.
sion's financial and operating performance         The real dilemma here was that the com-
compared to that of other divisions and its        pany might think that customers were
competitors. In the fourth quarter of 1989,        turned off by the new products, when in
it became apparent that KFC restaurants in         fact it was the slow service that turned
the division were experiencing serious             them off.
problems. The profit margin had eroded                KFC, therefore, set a dramatic improve-
from 16 to eight percent. KFC's perfor-            ment in DTW speed of service as its pri-
mance on key customer attributes, as re-           mary goal for restaurants in the division.
vealed by the QSC, OFR, and market                 The critical question was, could this really
tracker surveys, was also suffering. For ex-       be done? The perceived wisdom in the
ample, KFC was being ranked in the bot-            company was that the DTW operation had
tom half of the quick-service restaurant in-       been fine-tuned over many years, and
dustry in the categories of (1) speed t)f ser-     hence, cutting down on service time was
vice and (2) value for money spent.                nearly impossible. However, Chuck
   From historical sales data, KFC knew            Reynolds, then regional manager, sought a
that roughly 50 percent of its sales volume        way to reduce service time by conducting a
was contributed by the drive-through-              test at a few restaurants.
window (DTW) operation. Slow service, as           Organizing the Test at Oklahoma City
perceived by customers, was a particularly            After some analysis and discussion,
critical problem for DTW, since speed of           Reynolds chose four KFC-owned restau-
service is unquestionably the most impor-          rants in Oklahoma City as sites for the
tant dimension of service quality for a            DTW test. These restaurants were known
quick-service restaurant. The division was         for their good operations, motivated man-
also experiencing a high level of competi-         agers, and for low turnover among man-
tive pressure from new double drive-               agement. Oklahoma City was an isolated
through hamburger operators, such as Ral-          market in the region in the sense that these
ly's and Checkers. This competitive pres-          restaurants did not participate in any mar-
sure combined with the slowness of service         keting cooperative. This factor combined
spelled trouble.                                   with KFC's ownership meant that KFC had
   KFC had no marketable competitive ad-           total control over the marketing (advertis-

INTERFACES 25:3                                    10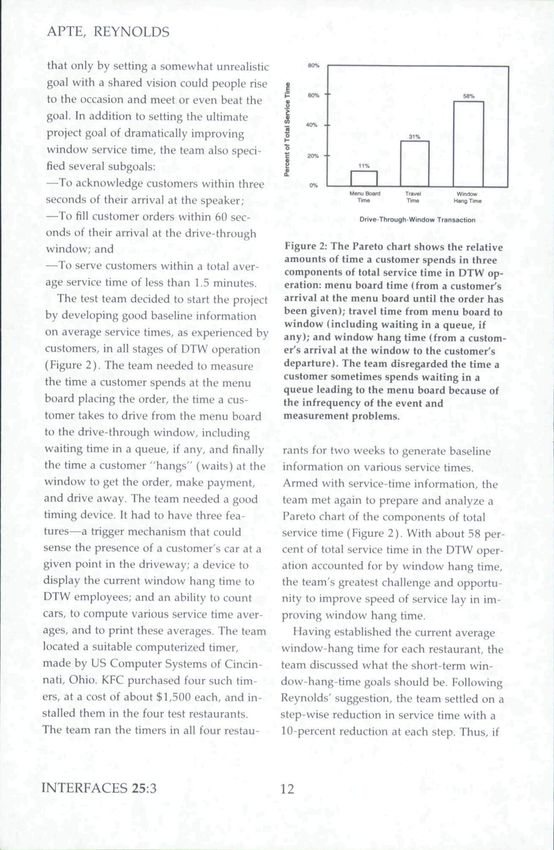
KENTUCKY FRIED CHICKEN

ing and promotion) activities at the restau-     Shingo, formerly a manufacturing engineer
rants. This ensured that any improvements        at Toyota, is primarily known for dramatic
in financial and market performance real-        reduction in machine setup time through
ized during the test would emanate solely        waste reduction, for zero quality control
frt)m improving speed of service and other       through poka-yoke (or mistake-proof
operational changes, and not from adver-         methods), and for process improvement
tising and promotion programs. Before            techniques in manufacturing, his methods
starting the test, Reynolds secured permis-      have been found to be equally useful in
sion from the president of domestic opera-       the service arena. Their knowledge of
tions and the vice-president of operations       quality-management concepts, tools, and
at the regional level to insure that no inter-   techniques proved very useful to the team
nal obstacles (such as the marketing de-         members during the test as they systemati-
partment introducing a new promotion             cally analyzed data, generated ideas for
program in the region or the industrial en-      improvements, and implemented them in
gineering department insisting on intro-         their individual restaurants.
ducing new procedures and equipment in           Test Team in Action
the midst of the test) would prevent the            The first meeting of the team in Okla-
test from being successful.                      homa City was chaired by Reynolds. It
    After choosing the test restaurants,         was devoted mainly to a discussion of the
Reynolds formed the DTW test team. This          problems facing KFC, the importance of
team, led by Reynolds, included the mar-         improving drive-through operation, the
 ket manager, four restaurant general man-       need for the test, and the test's potential
agers, the training manager, a maintenance       benefit to their individual restaurants and
coordinator, and an operations specialist        to the company. The discussion helped
 from operation services. As a result of their   raise the team members' commitment to
 participation in the "quality foundation        the fundamental goal of improving the
 workshop," all team members were well           speed of service at DTW. During the meet-
 versed in quality management concepts,          ing, Reynolds charged the team members
 such as the nature of variability and           with responsibility for finding and imple-
 Deming's "plan-do-check-act" methodol-          menting ways to continuously improve
 ogy. They were also knowledgeable in            DTW speed of service, and in return, he
 data-collection techniques and problem-         promised to fully back them up in their ac-
 solving tools and techniques, such as           tions.
 Pareto charts, fishbone diagrams, flow              Based on the benchmark data for com-
 charts, and statistical process-control          petitors' service times gathered through
 charts. Through self-guided quality man-         market tracker surveys, Reynolds and the
 agement training programs that relied on         team decided to reduce service time at
 videos and books, the team members were          drive-through windows from over two
 also exposed to the teachings of Shigeo          minutes to 60 seconds at all the test restau-
 Shingo [1987, 1988a, 1988b], a noted Jap-        rants. Everyone in the division considered
 anese quality management guru. Although          this goal unrealistic, but Reynolds believed

May-June 1995                                    U
APTE, REYNOLDS

  that only by setting a somewhat unrealistic
  goal with a shared vision could people rise    1                                             S8%
  to the occasion and meet or even beat the      P    60% •
                                                 8
  goal. In addition to setting the ultimate
                                                 *    40%   .
  project goal of dramatically improving
  window service time, the team also speci-      •s
  fied several subgoals;                                          11%

 —^To acknowledge customers within three              OS
                                                                Menu BoaW                    WWiilovv
 seconds of their arrival at the speaker;                         Time                      Hang Timf

 —To fill customer orders within 60 sec-                          Drive-Through-Window Transaction

 onds of their arrival at the drive-through
 window; and                                     Figure 2: The Pareto chart shows the relative
                                                 amounts of time a customer spends in three
 —To serve customers within a total aver-        components of total service time in DTW op-
 age service time of less than 1.5 minutes.      eration: menu board time (from a customer's
    The test team decided to start the project   arrival at the menu board until the order has
 by developing good baseline information         been given); travel time from menu board to
                                                 window (including waiting in a queue, if
 on average service times, as experienced by     any); and window hang time {from a custom-
 customers, in all stages of DTW operation       er's arrival at the window to the customer's
 (Figure 2). The team needed to measure          departure). The team disregarded the time a
                                                 customer sometimes spends waiting in a
 the time a customer spends at the menu          queue leading to the menu board because of
 board placing the order, the time a cus-        the infrequency of the event and
 tomer takes to drive from the menu board        measurement problems.
 to the drive-through window, including
 waiting time in a queue, if any, and finally     rants for two weeks to generate baseline
the time a customer "hangs" (waits) at the        information on various service times.
window to get the order, make payment,            Armed with service-time information, the
and drive away. The team needed a good            team met again to prepare and analyze a
timing device. It had to have three fea-          Pareto chart of the components of total
tures—a trigger mechanism that could             service time (Figure 2). With about 58 per-
sense the presence of a customer's car at a      cent of total service time in the DTW oper-
given point in the driveway; a device to         ation accounted for by window hang time,
display the current window hang time to          the team's greatest challenge and opportu-
DTW employees; and an ability to count           nity to improve speed of service lay in im-
cars, to compute various service time aver-      proving window hang time.
ages, and to print these averages. The team         Having established the current average
located a suitable computerized timer,           window-hang time for each restaurant, the
made by US Computer Systems of Cincin-           team discussed what the short-term win-
nati, Ohio. KFC purchased four such tim-         dow-hang-time goals should be. Following
ers, at a cost of about $1,500 each, and in-     Reynolds' suggestion, the team settled on a
stalled them in the four test restaurants.       step-wise reduction in service time with a
The team ran the timers in all four restau-      10-percent reduction at each step. Thus, if

INTERFACES 25:3                                  12
KENTUCKY FRIED CHICKEN

the current window hang time for a res-         needed to fill a customer's order.
taurant was 122 seconds, they asked the            The team members also needed addi-
restaurant to reduce the time by 12 sec-        tional specific ideas to implement in their
onds, setting a hang-time goal of UO sec-       restaurants. From the fundamentals of
onds, Reynolds suggested this conservative      quality management, they knew that the
10-percent reduction rule because, during       DTW employees were the hest sources of
some unrelated previous experiments,            specific improvement ideas. To tap this
Reynolds had noticed that when targeted         source, they decided to motivate their em-
improvement gaps were too large, restau-        ployees and make it simple for them to
rant employees became frustrated by their       generate and implement innovative ideas
inability to close those gaps quickly. These    for improvement. For that reason the team
prior experiments had invariably failed;        decided to form in each restaurant a team
improvements made, if any, were short-          of experienced DTW employees (called the
lived; and the restaurant performance sim-      restaurant team). The restaurant teams,
ply fell back to its former level. This time,   under the leadership of test team mem-
all four restaurant general managers            bers, were responsible for generating pro-
agreed that a 10-percent improvement at         cess improvement ideas and for imple-
each step was not too big a gap, and that       menting them in individual restaurants.
their employees could meet this goal. It           The test team decided to introduce a
was important that the DTW employees            "blocker log" in which DTW employees
experienced early success so that they          could record "blockers," underlying causes
could build their self-confidence to make       of delays. The blocker log was a simple $2
continuous improvement towards the ulti-        spiral binder with a pen attached. When-
mate goal of 60 seconds window hang             ever they could not fill a customer order
time.                                           within the target window hang time, a
Improving the DTW Processes                     buzzer on the timer would go off signaling
    In the same meeting in which it devel-      DTW employees to identify the blocker
oped the Pareto chart, the team also brain-     and write it down in the blocker log. In
stormed to generate ideas for reducing          many cases, the blocker was obvious,
hang time. Using Shigeo Shingo's process        while in others DTW employees held im-
improvement methods, the team devel-             promptu discussions to figure out what the
oped several general rules for eliminating      blocker was.
unnecessary motion and thereby reducing            The team systematically analyzed the
window hang time:                                reasons recorded in the blocker logs every
—Take no more than two steps to get              two weeks. The team used Pareto charts
what is needed to fill a customer's order.      and fishbone diagrams to identify the
—Do not bend over to get anything                most frequent and important blockers.
needed to fill a customer's order.               They challenged and encouraged the DTW
—Do not lift anything up that is needed to       employees to generate solutions for elimi-
fill a customer's order,                         nating or reducing the frequency of impor-
—Reach up and pull things down that are          tant blockers. The managers implemented

May-June 1995                                   13
APTE, REYNOLDS
selected solutions, and then the whole pro- solved the headset problem by instituting a
cedure was repeated. procedure for testing all headsets regularly
In one of the early meetings, the team to ensure that they worked properly, and
developed a fishbone chart (Figure 3) by ordering and stocking adequate supplies
identifying three key causes of slow ser- of frequently needed batteries and replace-
vice: problems with headsets, out-of- ment belts.
product condition, and poor equipment The four restaurants repeated this pro-
layout. With the help of restaurant teams cess for about 10 months until they
and DTW employees, the team members achieved the major goal of 60 seconds
developed and implemented plans for window hang time. The following are
solving each of these problems in each of some of the major changes they made to
the four restaurants. For example, they operational procedures and facilities.
Equipment
'No headsets and
headsets not working*
Poor equipment Inadequate staffing
layout*
No order-display
monitors
Too many types of Menu-board clarity
packaging boxes
Item pricingATime spent in
Low sales items counting change
Packing errors
No best-practice
standards
Methods
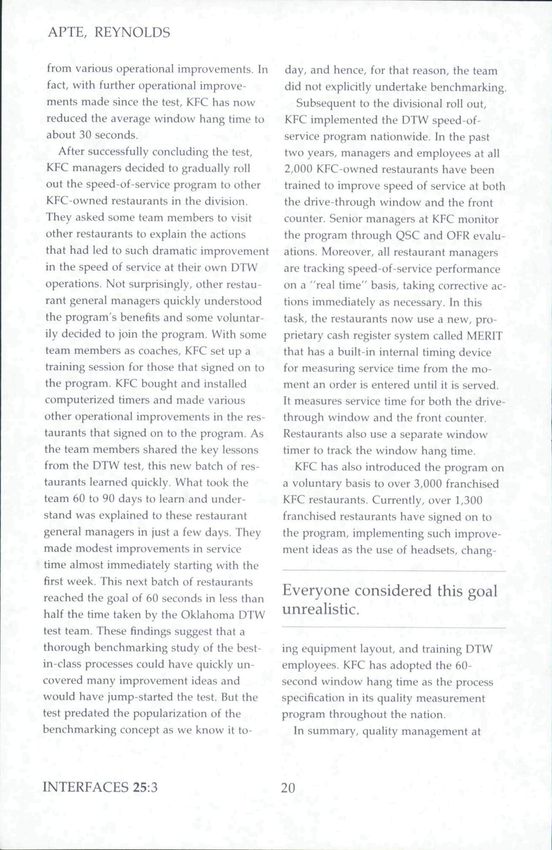
Figure 3: The DTW lest team used the blocker log to construct this fishbone chart during its
second brainstorming session when it analyzed the causes of delay at drive-through-window
operations of the four test restaurants. It then classified the causes and plotted them. Next it
determined the most important causes based on the frequency of their occurrence and the im-
pact of each cause. The team identified three major causes (*). The test team and the restaurant
teams generated solutions for eliminating these causes and implemented them in the test
restaurants.
INTERFACES 25:3 14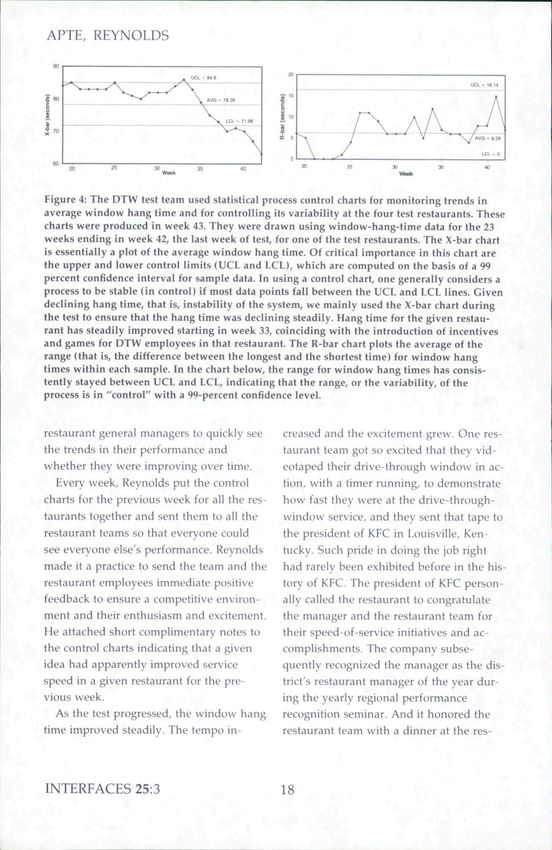
KENTUCKY FRIED CHICKEN

categorized under the lessons learned in         (2) They changed the product mix and
the test:                                     specifications. The restaurants streamlined
   (1) They rationalized process flow and     their menus to eliminate the "out-of-
improved equipment layout to eliminate        product" blocker. They eliminated a num-
wasted motion and to reduce service time.     ber of slow-moving items, such as French
The employees of each restaurant totally      fries, Kentucky nuggets, and sandwiches.
reorganized their drive-through areas, put-   At one restaurant, this alone reduced aver-
ting products, condiments, bags, boxes,       age window hang time by as much as 20
cups, and salads in more convenient loca-     seconds. They replaced multiple desserts
tions. They positioned each item along the
pack line according to its demand level.
High demand products were made easily         The profit margin had eroded
accessible to the packers and were also       from 16 to eight percent.
placed in the display packing system to be
more visible to the cooks and the DTW         with a single dessert item. The team tested
leaders so that they could replenish those    "even-dollar pricing" for the big-pack
just in time. Changing the orientation of     items on the menu board. For example,
the display packing system from its origi-    they priced a 10-piece (chicken) meal at
nal position parallel to the window to per-   $11.18 so that inclusive of tax it totalled to
pendicular, at an average cost of about       $12,00. Both the customer and the cashier
$7,000, turned out to be a simple but very    saved a lot of effort and time counting
powerful idea. It streamlined the move-       change. The even-dollar items averaged 15
ment of products from the kitchen to the      to 20 seconds less at the window.
packing area to the window. Moreover, it          (3) Many small process improvements
reduced the number of steps a packer took     ultimately added up to a large improve-
 from about six to two and saved precious     ment. The restaurants implemented a
 time and effort in packing each order. The   number of process improvement ideas.
restaurants also bought some additional       Each idea may have had only a tiny im-
equipment. For example, they installed        pact on service time. However, collectively,
 "pack monitors" that were connected to       these ideas had a large impact. For exam-
 the order-taking system. These pack moni-    ple, the restaurants eliminated redundant
 tors were instrumental in accurately and     packaging boxes so that packers needed
 quickly informing packers of the specific    only one or two standard boxes to pack
 contents of every order while the order      any order. Thus, packers could focus on
 was being taken and entered into the sys-     packing orders in the shortest possible time
 tem by the window person. Finally, the        without worrying about whether they were
 restaurant moved its equipment (coolers,     using the proper box.
 warming cabinets, cup dispensers, and so         (4) They used headsets to create cus-
 forth) around to make walking through         tomer focus and to convert serial activities
 and servicing the drive-through area much     into parallel ones. The use of headsets by
 easier.                                       all DTW employees allowed them to per-

May-]une 1995                                 15
APTE, REYNOLDS

 form their jobs while simultaneously lis-            (7) They created an environment con-
 tening to customer orders. For example,           ducive to problem-solving, established
 the headset allowed a packer to begin             simple procedures so that employees could
 packing as soon as a customer placed an           suggest improvements, and acted immedi-
 order, instead of waiting for the order           ately on suggestions. In addition to making
 taker to relay the completed order. This          the blocker log available, Reynolds and the
 also helped improve order accuracy. Con-          team strived to create a nonthreatening en-
 verting serial activities into parallel ones in   vironment and to encourage DTW employ-
 this manner proved very useful in reduc-          ees to come up with ideas for improving
 ing the window hang time. By listening to         the process. They implemented several of
 customer orders cooks better understood           these ideas; some worked, others did not.
 the demand patterns for different products
 and could more effectively adjust produc-
 tion quantities and timings,                      Converting serial activities into
    (5) Given the customer's participation         parallel ones proved very
 in the service process, the customer should       useful.
 be given clear instructions on what he or
 she is supposed to do. One simple idea             But the team made it a point to encourage
 was to install clear signs, such as an order-      employees to try anything that seemed
 here sign at the drive-through menu board          reasonable. The team monitored the im-
 speaker. This reduced customer confusion           pact of implemented changes closely so
and thereby the time spent at the menu              that it could discontinue whatever change
board. Another idea was to rearrange the           didn't seem to work. One of the important
menu board to improve its clarity so that          rules the team followed was to act immedi-
customers could place orders faster and            ately on employee suggestions, that is, to
more easily.                                       decide quickly if it would implement a
    (6) The restaurants used the timer as a        suggestion and, if so, to implement it im-
focal point for motivating team members.           mediately. This created an unprecedented
The DTW timer was perhaps the single               level of excitement and enthusiasm among
most important tool in improving the               DTW employees.
speed of service. The timer served as a               (8) Rigorous training and motivating
constant reminder to the DTW employees             employees through individual or team in-
that the customers were waiting. Once              centives were keys to process improve-
each customer departed, the timer dis-             ment. Prior to the test, employees were
played both the window hang time for               simply assigned to DTW without receiving
that customer as well as the average win-          any special training in how to work effec-
dow hang time since the beginning of that          tively and efficiently in the DTW area. The
day. Serving as a scorecard and as a focal         team made specific DTW training a re-
point for motivation, the timer helped each        quirement for all employees working in
restaurant's DTW leader set a pace during          that area. Productivity and camaraderie
rush times.                                        improved noticeably. The team recognized

INTERFACES 25:3                                    16
KENTUCKY FRIED CHICKEN
that several resources, cooks and restau- (10) The team always kept an eye on
rant equipment, for example, were shared the competition. Through the use of mar-
by both the DTW area and the front coun- ket tracker surveys, the team regularly
ter area serving the dine-in customers. conducted service-time studies on immedi-
Consequently, actions of the front counter ate competitors within the test area. The
employees influenced the performance of only way to remain competitive was to set
the DTW area. To achieve the test goals, suitably aggressive service-time targets.
all employees in the restaurant had to con- The restaurant general managers contin-
tribute to its success. Some restaurants ually sent notes to Reynolds outlining their
used games and awards to get all their em- success stories and sometimes even their
ployees involved in the DTW test. For ex- failures. They also sent timer tapes from all
ample, if the DTW employees hit the target the restaurants each week. Reynolds en-
window hang time, all the restaurant em- tered the window-hang-time results for the
ployees, and not just the DTW employees, individual test restaurants into a PC-based
were rewarded for their performance. software package that generated process
These rewards included specially printed control charts, such as X-bar and R-bar
T-shirts, gift certificates, and pizza parties. charts (Figure 4). The main reason for
The rewards proved powerful in strength- choosing this software package was that it
ening the pride that DTW employees took was easy to use and had attractive graphics
in improving their speed of service while that the team could interpret easily. As the
also improving the morale of the entire restaurants gradually implemented process
restaurant team. improvement ideas, the team expected the
(9) The restaurants made process im- window hang time to decline steadily.
provement a way of life for managers. The Hence, by definition, the system was not
compensation of restaurant general man- expected to be in a stable state while the
agers is tied to the performance of their in- DTW test was in progress. Therefore, the
dividual restaurants. As the test pro-
gressed, operational performance began to
improve noticeably, and the general man-
Slow service could have a
agers became increasingly committed to ruinous impact on product
the idea of continuous improvement. They innovation activity.
assumed ownership of the test, and they
started to identify so closely with the goal team did not use the X-bar chart during
of reducing service time that it became in- the test for statistical process control per se
grained in their thinking. Interestingly, the but used it mainly to ensure that the trend
language of restaurant general managers line for window hang time was a declining
changed. Even during casual conversa- one. On the other hand, the team used the
tions, they talked in terms of speed-of- R-bar chart in the traditional manner to
service times. For example, they would say ensure that the range, that is, the variabil-
that they had had a 48-second day or a ity, of the system was under control and
40-second lunch hour. was not increasing. The charts allowed all
May-June 1995 17APTE, REYNOLDS
20 25 35 40
Figure 4: The DTW lest team used statistical process control charts for monitoring trends in
average window hang lime and for controlling its variability at the four tesl restaurants. These
charts were produced in week 43. They were drawn using window-hang-time data for the 23
weeks ending in week 42, the last week of test, for one of the test restaurants. The X-bar chart
is essentially a plot of the average window hang time. Of critical importance in this chart are
the upper and lower control limits (UCL and LCL), which are computed on the basis of a 99
percent confidence interval for sample data. In using a control chart, one generally considers a
process to be stable (in control) if most data points fall between the UCL and LCL lines. Given
declining hang time, that is, instability of the system, we mainly used the X-bar chart during
the test to ensure that the hang time was declining steadily. Hang time for the given restau-
rant has steadily improved starting in week 33, coinciding with the introduction of incentives
and games for DTW employees in that restaurant. The R-bar chart plots the average of the
range (that is, the difference between the longest and the shortest time) for window hang
times within each sample. In the chart below, the range for window hang times has consis-
tently stayed between UCL and LCL, indicating that the range, or the variability, of the
process is in "control" with a 99-percent confidence level.
restaurant general managers to quickly see creased and the excitement grew. One res-
the trends in their performance and taurant team got so excited that they vid-
whether they were improving over time. eotaped their drive-through window in ac-
Every week, Reynolds put the control tion, with a timer running, to demonstrate
charts for the previous week for all the res- how fast they were at the drive-through-
taurants together and sent them to all the window service, and they sent that tape to
restaurant teams so that everyone could the president of KFC in Louisville, Ken-
see everyone else's performance. Reynolds tucky, Such pride in doing the job right
made it a practice to send the team and the had rarely been exhibited before in the his-
restaurant employees immediate positive tory of KFC, The president of KFC person-
feedback to ensure a competitive environ- ally called the restaurant to congratulate
ment and their enthusiasm and excitement. the manager and the restaurant team for
He attached short complimentary notes to their speed-of-service initiatives and ac-
the control charts indicating that a given complishments. The company subse-
idea had apparently improved service quently recognized the manager as tbe dis-
speed in a given restaurant for the pre- trict's restaurant manager of the year dur-
vious week. ing the yearly regional performance
As the test progressed, the window hang recognition seminar. And it honored the
time improved steadily. The tempo in- restaurant team with a dinner at the res-
INTERFACES 25:3 18KENTUCKY FRIED CHICKEN
Compared to the rest of the district and
the division, the four test restaurants sub-
stantially improved their overall perfor-
mance during 1991 as compared to their
overall performance in 1990:
(1) They increased customer transac-
Figure 5; Drive-through-window-service time tions. The annual DTW customer transac-
shows a steady improvement. Average win- tions for the test restaurants increased by
dow hang time was computed for the four 29.5 percent while the transactions for the
test restaurants together during the DTW test. district and the division decreased by three
The average window hang time declined
from the initial average of 125 seconds to 60 percent and one percent respectively.
seconds at the end of the 42-week test period. (2) They achieved higher sales growth.
The DTW sales volume at the test restau-
rants grew by 17.5 percent while the sales
taurant of its choice. for the district and the division declined by
Over a period of 42 weeks, the team was 0.5 percent and one percent respectively.
able to reduce average window hang time (3) They improved productivity. Labor
from the initial 125 seconds to the goal of productivity as measured in DTW transac-
60 seconds {Figure 5). With a total im- tions per team labor hour for the test res-
provement of 65 seconds, the window taurants increased by 12.3 percent while
hang time was cut by more than half! the productivity for the district and the di-
The Results vision declined by 0.4 percent and three
The team achieved the seemingly impos- percent in the same time-frame. It is also
sible goal of 60 seconds window hang interesting to note that the total DTW la-
time. The restaurants did not advertise this bor hours, that is, the number of employ-
speed-of-service improvement, but the ees in the DTW area, were not reduced in
customers certainly found out, for business any of the test restaurants.
grew significantly. Though it was not an Looking at these improvements, one
explicit goal of the test, the labor produc- may ask, was this simply a Hawthorne ef-
tivity showed substantial improvement fect? (That is, were these improvements a
with obvious implications for cost perfor- result of all the attention the team gave the
mance. As a result, the profit margin in- DTW employees and not a result of var-
creased from about eight percent before ious operational improvements?) KFC has
the test to about nine percent after the test. replicated the operational changes imple-
The QSC and OFR scores for the test res- mented in the test at other restaurants and
taurants went up and their performance on has seen a similar persisting improvement
the key customer attributes in the market in speed of service and labor productivity.
tracker survey showed across-the-board The answer to that question is no, it is not
improvement. As expected, the speed of a Hawthorne effect. The improved perfor-
service category showed dramatic im- mance has come primarily from the quality
provement. management program, or more specifically.
May-June 1995 19APTE, REYNOLDS
from various operational improvements. In day, and hence, for that reason, the team
fact, with further operational improve- did not explicitly undertake benchmarking.
ments made since the test, KFC has now Subsequent to the divisional roll out,
reduced the average window hang time to KFC implemented the DTW speed-of-
about 30 seconds. service program nationwide. In the past
After successfully concluding the test, two years, managers and employees at all
KFC managers decided to gradually roll 2,000 KFC-owned restaurants have been
out the speed-of-service program to other trained to improve speed of service at both
KFC-owned restaurants in the division. the drive-through window and the front
They asked some team members to visit counter. Senior managers at KFC monitor
other restaurants to explain the actions the program through QSC and OFR evalu-
that had led to such dramatic improvement ations. Moreover, all restaurant managers
in the speed of service at their own DTW are tracking speed-of-service performance
operations. Not surprisingly, other restau- on a "real time" basis, taking corrective ac-
rant general managers quickly understood tions immediately as necessary. In this
the program's benefits and some voluntar- task, the restaurants now use a new, pro-
ily decided to join the program. With some prietary cash register system called MERIT
team members as coaches, KFC set up a that has a built-in internal timing device
training session for those that signed on to for measuring service time from the mo-
the program. KFC bought and installed ment an order is entered until it is served.
computerized timers and made various It measures service time for both the drive-
other operational improvements in the res- through window and the front counter.
taurants that signed on to the program. As Restaurants also use a separate window
the team members shared the key lessons timer to track the window hang time.
from the DTW test, this new batch of res- KFC has also introduced the program on
taurants learned quickly. What took the a voluntary basis to over 3,000 franchised
team 60 to 90 days to learn and under- KFC restaurants. Currently, over 1,300
stand was explained to these restaurant franchised restaurants have signed on to
general managers in just a few days. They the program, implementing such improve-
made modest improvements in service ment ideas as the use of headsets, chang-
time almost immediately starting with the
first week. This next batch of restaurants
reached the goal of 60 seconds in less than Everyone considered this goal
half the time taken by the Oklahoma DTW unrealistic.
test team. These findings suggest that a
thorough benchmarking study of the best- ing equipment layout, and training DTW
in-class processes could have quickly un- employees. KFC has adopted the 60-
covered many improvement ideas and second window hang time as the process
would have jump-started the test. But the specification in its quality measurement
test predated the popularization of the program throughout the nation.
benchmarking concept as we know it to- In summary, quality management at
INTERFACES 25:3 20KENTUCKY FRIED CHICKEN KFC rests on the rigorousness of the OFR ing speed of service at the critical drive- and QSC programs to continually assess through point of sale, this team was able the quality of both service processes and not only improve customer service but also outcomes. These measurements are further to improve the financial position of the used to improve the underlying processes units involved. Transactions increased al- for achieving better overall performance. most 30 percent in these stores versus KFC strives to change its detailed specifica- three percent in the rest of the market and tions as the needs of the marketplace sales outpaced the nontest markets by over evolve and industry practices change. As 17 percent all while reducing window ser- confirmed by its experience with the DTW vice time from over 120 seconds to 60 sec- speed of-service test, the notions of pro- onds—clearly a win for both the consum- cess focus and continuous improvement ers and the company. through empowering its employees are the "In addition to being the model for the foundations of the ongoing quality man- company's current drive-through service agement program at Kentucky Fried time standard, this process has also been Chicken. adopted in over 1,300 of our franchised References restaurants as well," Apte, U- M.; Karmarkar, U. S.; and Pitbladdo, R. 1994, "Quality management in services: Analysis and applications," working paper 94-09-01, Cox School of Business, Southern Methodist University, Dallas, Texas, forth- coming in Practice of Quality Management. eds. U. Karmarkar and P. Lederer, Harvard Business School Press, Cambridge, Massachu- setts. Shingo, Shigeo 1987, The Sayings of Shigeo Shingo: Key Strategies for Plant Improvement. translated by A. P. Dillon, Productivity Press, Cambridge, Massachusetts. Shingo, Shigeo 1988a, Non-Stock Production: The Shingo System for Continuous Improve- ment. Productivity Press, Cambridge, Massa- chusetts. Shingo, Sbigeo 1988b, The SMED Systew. video, translated by A. P. Dillon, Productivity Press, Cambridge, Massachusetts. Starlette Johnson, Finance Director, KFC, writes, "The drive-through-window (DTW) test in Oklahoma City served as the foundation for the company's current 60-second drive-through service time goal established in 1992. "By focusing the OKC team on improv- May-June 1995 21
You can also read