Teacher Voice Omnibus Survey - March 2018 Robert Smith, Caroline Sharp, David Sims, Sarah Millar, Jo Nossiter, Rebecca Menys, Chloe Rush - The ...
←
→
Page content transcription
If your browser does not render page correctly, please read the page content below
Teacher Voice
Omnibus Survey
Research report
March 2018

Robert Smith, Caroline Sharp, David
Sims, Sarah Millar, Jo Nossiter, Rebecca
Menys, Chloe Rush – The National
Foundation for Educational Research
Contents

List of figures                                   3
List of tables                                    5
1.    Introduction                                6
2.    Executive Summary                           7
3.    Aspiration for school leadership            14
4.    Flexible working patterns                   17
5.    Sources of support for schools              20
6.    Teacher workload                            23
7.    Budget planning                             27
8.    Behaviour/impact of poor behaviour          29
9.    Alternative provision                       32
10.     Exclusion                                 34
11.     Attendance                                37
12.     PSHE/Sex and Relationships Education      40
13.     Mental health                             43
14.     Pupil premium                             47
15.     Assessment processes/capacity             50
16.     Use of systematic synthetic phonics       52
17.     SEND                                      54
18.     New GCSEs and the English Baccalaureate   57
19.     Teachers moving schools                   60
Annex 1: Supporting information                   62
References                                        69

                                              2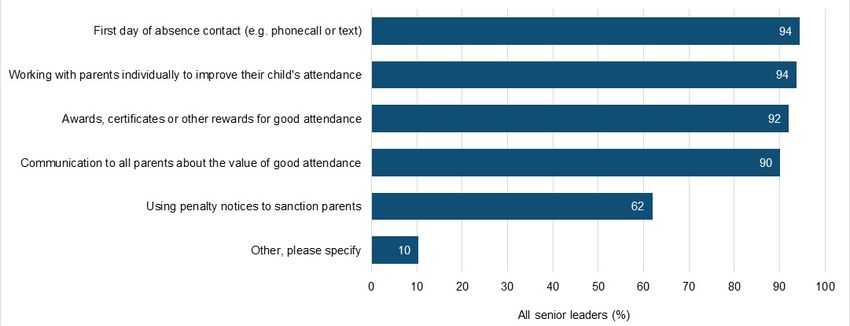
List of figures
Figure 1 Do you aspire to be a headteacher?                                                14

Figure 2 When did respondents hope to become a headteacher                                 15

Figure 3 Reasons why respondents did not aspire to headship                                16

Figure 4 Is it easy for teachers in your school or for teachers returning to teaching to
agree part-time working arrangements or flexible working patterns?                         17

Figure 5 Most significant barriers to agreeing part-time working arrangements or flexible
working patterns for teachers in your school or teachers returning to teaching          19

Figure 6 Which of the following do you think are effective sources of support for schools
in your local area?                                                                     21

Figure 7 What has your school done to evaluate and reduce unnecessary workload?            24

Figure 8 What has your school done to evaluate and reduce unnecessary workload?
Open-ended responses                                                                       25

Figure 9 Which of the following actions, if any, have you found useful in getting the most
out of your budget?                                                                      28

Figure 10 How would you rate pupil behaviour in your school?                               30

Figure 11 Thinking of Alternative Provision in your area, please indicate the needs for
which there are insufficient quality places                                             32

Figure 12 Which of the following do you think schools are able to do under the existing
rules on exclusions and pupil registration?                                             35

Figure 13 Which of the following interventions does your school use to promote and
improve school attendance?                                                                 38

Figure 14 How do you currently teach PSHE and Sex and Relationships Education              41

Figure 15 To what extent do you agree/disagree with the following statements about your
school’s capacity to support children and young people’s mental health?              44

Figure 16 To what extent do you agree/disagree with the following statements about your
capacity to support children and young people’s mental health at your school?        45

Figure 17 Barriers to evidence-based decision making on the use of the pupil premium in
the school (percentage of respondents who ranked each as their number one barrier) 48

Figure 18 Would staff benefit from additional training on assessment without levels?       50

                                              3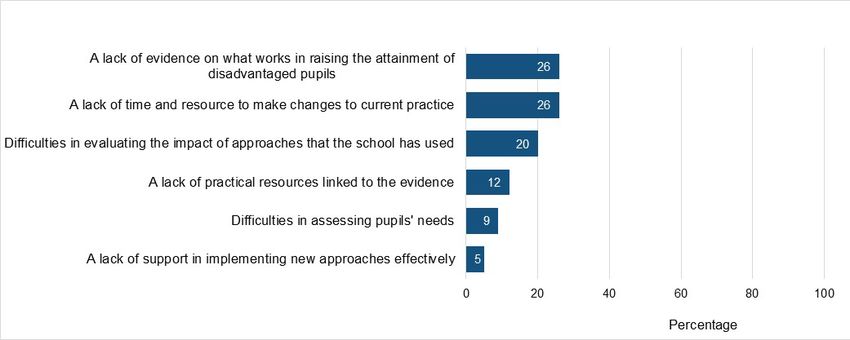
Figure 19 Does your school use systematic synthetic phonics (SSP) for teaching
children to read?                                                                     52

Figure 20 Do you agree with the following statements about the Special Educational
Needs (SEN) support for pupils in your school?                                        55

Figure 21 How confident is your school to teach, from September 2017, the third wave of
new GCSEs?                                                                           58

Figure 22 Thinking about moving schools, what would attract you to work in a particular
school? (Percentage of respondents who ranked the main factors as their number one
reason)                                                                                60

                                           4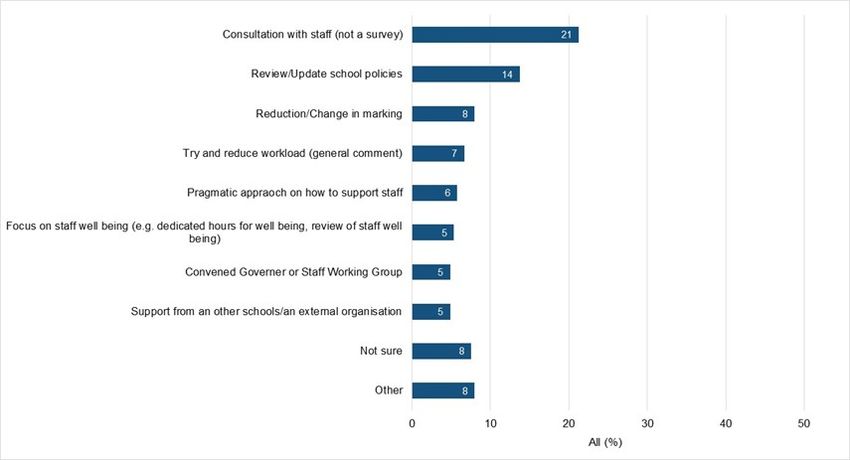
List of tables
Table 1 Representation of (weighted) primary schools compared to primary schools
nationally                                                                            63

Table 2 Representation of secondary schools compared to secondary schools nationally
                                                                                   64

Table 3 Representation of all schools (weighted) compared to all schools nationally   65

Table 4 Comparison of the achieved (weighted) sample with the national population by
grade of teacher (not including academies)                                           66

Table 5 Comparison of the achieved (weighted) academies sample with the national
population by grade of teacher                                                        67

Table 6 Precision of estimates in percentage point terms                              68

                                            5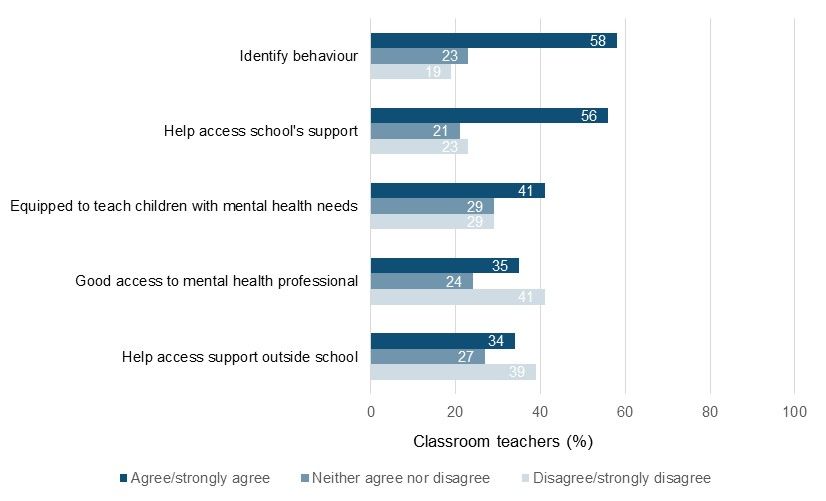
1. Introduction
The Department for Education (DfE) submitted a total of 34 questions to be included in
the Teacher Voice Omnibus Survey and a Senior Leader Booster Survey conducted in
the summer of 2017. The Teacher Voice Omnibus Survey was completed online between
5th and 8th of May 2017. Participants were contacted from the NFER Teacher Voice
panel which contains practicing teachers and senior leaders from schools across
England who sign up to complete surveys approximately three times a month. The Senior
Leader Booster Survey was completed online and on paper between 12th June and 7th
July 2017. This was carried out in order to increase the number of senior leaders
completing the survey. A random sample of schools across England was drawn by NFER
and letters were sent to these schools targeting the senior leaders to take part.

The questions explored teachers’ and senior leaders’ views on, and activities relating to a
range of areas such as: teacher workload, poor behaviour and attendance, alternative
provision, mental health, pupil premium and the new GCSEs.

In total, 1,962 practising teachers from 1,619 schools in the maintained sector in England
completed the survey. This is approximately 8% of the population in the target sample.
The effect of this on precision of estimates can be found in table 11. Eight hundred and
ninety-nine (46 per cent) of the respondents were teaching in primary schools and 1063
(54 per cent) were teaching in secondary schools. In terms of role, 945 respondents (48
per cent) were classroom teachers and 1017 (52 per cent) were senior leaders.

Findings are provided for the overall sample, and are broken down by school phase
(primary and secondary) and role (senior leader or classroom teacher), where relevant.

Both the primary school sample and the combined sample differed significantly from the
national population by free school meals eligibility. To address this, weights were
calculated using the free school meals data and then applied to the primary and
combined samples to create a more representative sample of schools. The secondary
sample did not require weighting on free school meals eligibility. More detail regarding
the survey sample can be found in Annex 1 of the report.

                                            6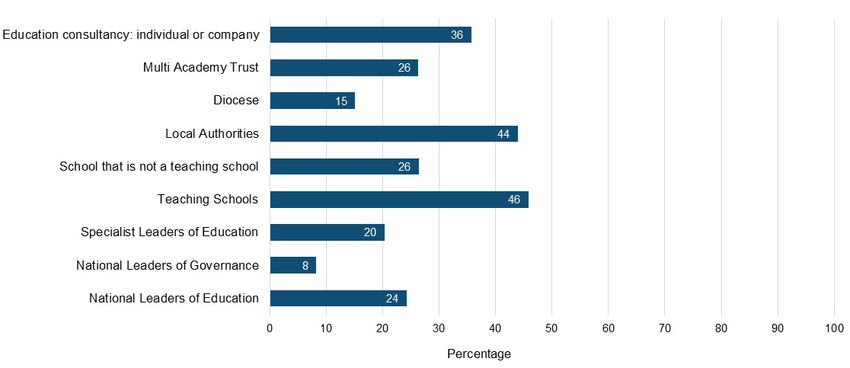
2. Executive Summary

2.1 Aspiration for school leadership
Strengthening school and system leadership is at the heart of the Government’s strategy
for education and children’s social care services. The Department for Education (DfE)’s
Strategy for 2015-20 (DfE, 2016) highlights the importance of ensuring a ‘strong,
consistent supply’ of school leaders. The survey asked senior leaders and classroom
teachers whether they aspired to become a headteacher, and if so, when they were
planning to do so. More than three-quarters (78 per cent) of all those who responded to
the question said that they did not aspire to become a headteacher and about a fifth (22
per cent) planned on doing so at some point in the future. While nearly half (45 per cent)
of senior leaders wanted to become a headteacher at some point in the future, the
percentage of classroom teachers who wanted to do so (9 per cent) was much smaller.

2.2 Flexible working patterns
The DfE published its 2017 Flexible Working Guidance, to advise teachers who are
considering working flexibly and to help schools and employers consider how best to
encourage, support and enable flexible working requests. Respondents were asked how
easy they thought it was for a teacher in their school or returning to teaching to arrange
part-time or flexible working. They were then asked to rank how important were some of
the possible barriers to these arrangements. Most respondents (60 per cent) said that it
was easy for teachers in their school or returning to teaching to arrange part-time or
flexible working arrangements. A higher percentage of senior leaders (68 per cent) than
classroom teachers (51 per cent) said that it was possible to arrange part-time or flexible
working arrangements. The 27 per cent of respondents who felt that it was not easy to
arrange part-time or flexible working, ranked timetabling issues and lack of support from
senior managers and/or governors as the two most important barriers.

2.3 Sources of support for schools
Sources of support are an important aspect of the self-improving school system. The
system is based on schools taking responsibility for their own improvement, schools
learning from each other so that effective practice is disseminated and the best schools
and leaders extending their reach thereby contributing to school improvement across the
system. School leaders were asked what sources of support they considered to be
effective for schools in their area and which sources of support their school had ever
used. Nearly half of the school leaders identified teaching schools (46 per cent) and LAs
(44 per cent) as providing effective support. Senior leaders reported that the most
frequently used sources of support were local authorities (68 per cent), teaching schools
(52 per cent) and an education consultancy (52 per cent).
2.4 Teacher workload
Removing unnecessary workload is high on the education agenda. The DfE published
the 2016 Teacher Workload Survey report, a commitment from the 2014 Workload
Challenge, alongside an action plan setting out the steps to be taken. Respondents were
asked which tools their schools had used to help them to address the issue of teacher
workload. Those who said that their school had used one of these methods were asked
what impact the changes had on their workload. Nearly a third of respondents (32 per
cent) said their school had used the independent reports on marking, planning and
resources and/or data management as a basis to review current policies with a view to
reducing workload. A similar proportion (31 per cent) had used advice from Ofsted (e.g.
Ofsted handbook or #OfstedMyths). A higher percentage of senior leaders than
classroom teachers indicated that they had used each of the methods listed in the
survey. About half (53 per cent) of the respondents who indicated that their school had
taken action said the changes had effectively reduced unnecessary workload.

2.5 Budget planning
The DfE publishes online tools and guidance to help schools plan their budgets and
improve their efficiency and long-term financial health. Senior leaders were asked which
of a range of actions they had found useful in getting the most out of their budget. The
majority of senior leaders identified two of the actions: around three-quarters (77 per
cent) had found it useful to review their staffing structure, and two-thirds (66 per cent)
had found it useful to review how they buy goods and services.

2.6 Behaviour/impact of poor behaviour
The DfE recognises that poor behaviour in schools impedes learning and prevents pupils
from achieving their full potential. They have committed to ensuring that all teachers are
equipped with the skills to tackle both serious behaviour issues that compromise the
safety and wellbeing of pupils, as well as low level disruption that too often gets in the
way of effective learning. Nearly three-quarters of respondents (73 per cent) indicated
that behaviour was good or very good at their school. More than half (59 per cent) of
respondents believed that up to five minutes in each hour of teaching time was lost due
to the impact of poor behaviour. Around three-quarters of respondents (76 per cent) said
they were fairly confident or very confident in their school’s ability to deal with challenging
pupils. Three-fifths (59 per cent) of respondents rated their school as good or very good
at parental engagement where behaviour was an issue.

2.7 Alternative provision
Alternative provision is the education put in place for any child of compulsory school age
who would not otherwise receive suitable education because of illness, permanent

                                               8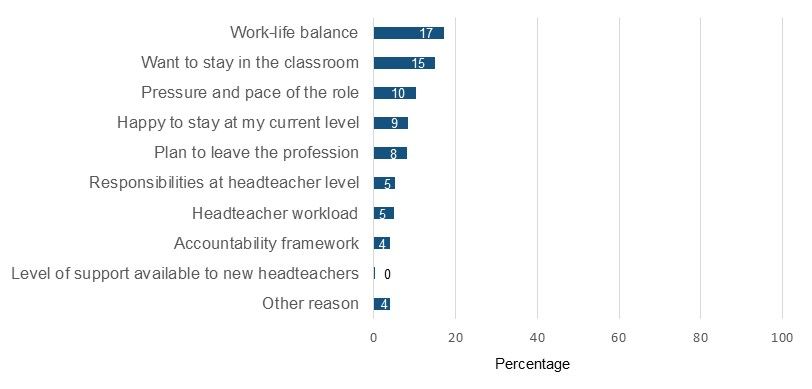
exclusion or for any other reason. More than four-fifths (84 per cent) of school leaders
said there were insufficient places for pupils with mental health needs in their area.
Around three-quarters (74 per cent) said there were insufficient places for pupils without
Special Education Needs (SEN) who had behavioural issues and the same percentage
(74 per cent) said there were insufficient places for pupils with SEN who had behavioural
issues. Around three-quarters (78 per cent) of senior leaders said there were insufficient
quality places for pupils with mental health needs. About two-thirds (67 per cent) said
there were insufficient quality places for pupils with SEN who had behavioural issues and
the same percentage said there were insufficient quality places for pupils without SEN
who had behavioural issues.

2.8 Exclusion
The DfE’s policy on pupil exclusion is set out in statutory guidance: Exclusion from
Maintained Schools, Academies and Pupil Referral Units in England (2017). This states
that good discipline in schools is essential to ensure that all pupils can benefit from the
opportunities provided by education. Respondents were asked a series of questions
about which actions (including two permitted and six not permitted under the guidance)
they thought schools were able to take under the existing rules on exclusions and pupil
registration. The majority of respondents indicated that they thought schools were able to
take the permitted actions: 87 per cent believed that the rules on exclusions and pupil
registration allowed them to formally exclude pupils for a fixed period for reasons of poor
behaviour and about two-thirds (65 per cent) thought they could formally exclude pupils
permanently for reasons of poor behaviour. Six per cent of respondents or fewer
indicated that schools were able to take actions not permitted under the guidance, except
for just over a fifth (22 per cent) who believed they could encourage parents to withdraw
their child and apply to another school, as an alternative to a permanent exclusion.

2.9 Attendance
The DfE’s guidance on pupil attendance at school (2016) underlines the educational
benefits of pupils attending school regularly and the importance of this for raising
progress towards achieving standards in education. The survey asked senior leaders
what methods were used in respondents’ schools to improve attendance and then
explored what factors respondents believed prevented pupils from improving their
attendance. The vast majority responded that they used the following methods in their
schools: first day of absence contact (94 per cent), working with parents individually to
improve their child's attendance (94 per cent), giving awards, certificates or other rewards
for good attendance (92 per cent), and communicating with parents about the value of
good attendance (90 per cent), using penalty notices to sanction parents (62 per cent).
More than four-fifths (83 per cent) of respondents stated that parents of pupils at their
school did not understand or value the importance of regular school attendance.

                                             9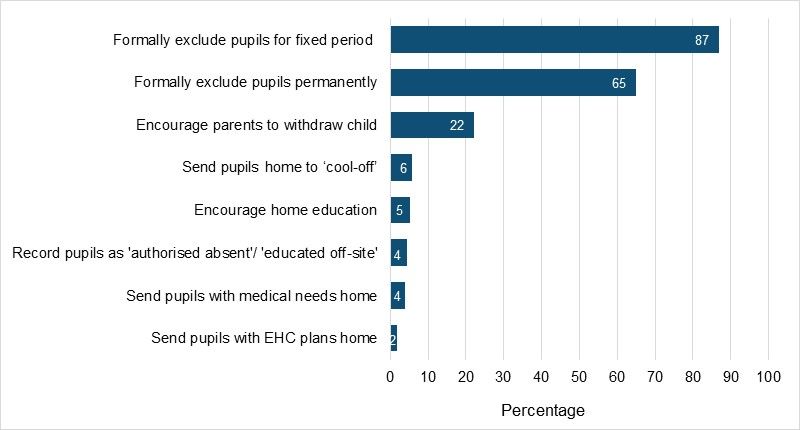
2.10 PSHE/Sex and Relationships Education
The Children and Social Work Act 2017 places a duty on the Secretary of State for
Education to make regulations requiring schools to provide Relationships Education for
pupils in all primary maintained schools, academies and independent schools and
Relationships and Sex Education (RSE) for pupils in all secondary maintained,
academies and independent schools. Respondents were asked how their school
addressed PSHE and Sex and Relationships Education at their school. The vast majority
(85 per cent) of senior leaders said that their school taught both PSHE and Sex and
Relationships Education. When asked what type of support would enable their school to
introduce mandatory PSHE and Relationships Education, around two-thirds (65 per cent)
of senior leaders believed they would need teaching materials. Equal numbers (51 per
cent) said they would need a Continuous Professional Development (CPD) programme
and examples of good practice.
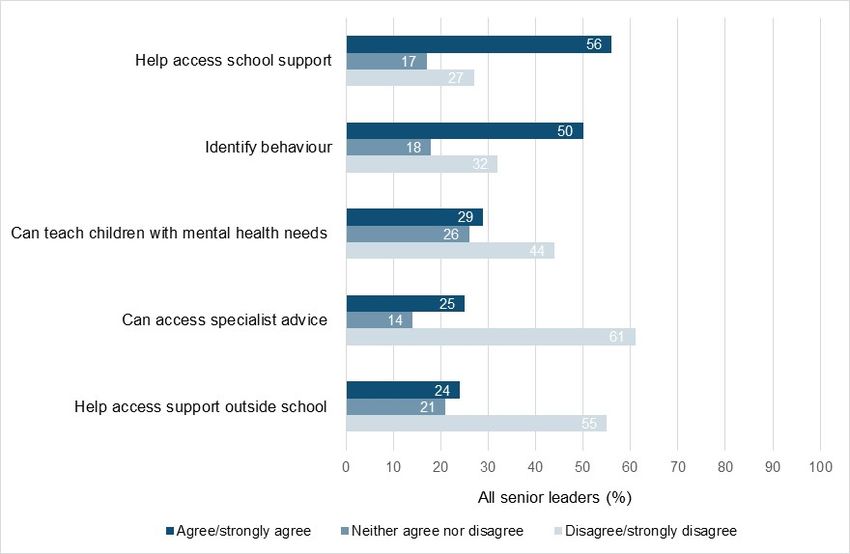
2.11 Mental health
Supporting and protecting vulnerable children is at the heart of the Government’s
approach to children’s social care and education policy and is an explicit feature of the
Department for Education’s (DfE) strategic priorities for 2015-20 (DfE, 2016). Senior
leaders were asked to respond to a series of questions about their school’s provision for
pupils with mental health issues. Half of senior leaders (50 per cent) said they agreed or
strongly agreed with the statement ‘most staff are equipped to identify behaviour that
may be linked to a mental health issue’. The corresponding figures for other statements
were: ‘most staff know how to help students with mental health issues access support
offered by my school’ (56 per cent), ‘most staff know how to help students with mental
health issues access specialist support outside of my school’ (24 per cent), ‘most staff
are equipped to teach children in their classes who have mental health needs (29 per
cent) and ‘most staff have good access to a mental health professional if they need
specialist advice on students’ mental health’ (25 per cent).
When classroom teachers were asked whether they agreed with the statement: ‘I feel
equipped to identify behaviour that may be linked to a mental health issue’, 58 per cent
agreed or strongly agreed. The corresponding figures for other statements were: ‘I know
how to help pupils with mental health issues access support offered by my
school/college’ (56 per cent), ‘I feel equipped to teach children in my class who have
mental health needs’ (41 per cent), ‘I have access to mental health professionals if I need
specialist advice on pupils' mental health’ (35 per cent) and ‘I know how to help pupils
with mental health issues access specialist support outside of school/college’ around a
third (34 per cent).
102.12 Pupil premium
The pupil premium is additional funding for publicly funded schools in England to raise
the attainment of disadvantaged pupils of all abilities and to close the gaps between them
and their peers. It was introduced in 2011 as a means of raising the attainment of
disadvantaged pupils.
Respondents who thought their schools were experiencing barriers to evidence-based
decision making on the use of the pupil premium were invited to rank six potential
barriers in order of significance. Just over a quarter (26 per cent) of those who thought
their schools had experienced barriers ranked ‘a lack of time and resource to make
changes to current practice’ as the most significant barrier affecting their school’s
evidence-based decision making on the use of the pupil premium. Just over a quarter (26
per cent) of respondents ranked ‘a lack of evidence on what works in raising the
attainment of disadvantaged pupils’ as the most significant barrier and a fifth (20 per
cent) ranked ‘difficulties in evaluating the impact of approaches that the school has used’
as the most significant barrier. Around a third (34 per cent) of respondents agreed with
the statement: ‘My school has not experienced any barriers to making evidence-based
decisions on the use of the pupil premium’.
2.13 Assessment processes/capacity
On introduction of the new national curriculum in September 2014, the requirement for
schools to use national curriculum ‘levels’ to report pupils’ attainment and progress was
removed. Schools now have much greater freedom to develop their own approach to
ongoing, non-statutory, in-school assessment. Schools were asked how they collected
data to track pupil progress between statutory and end-of-key-stage assessments. About
half (51 per cent) of respondents said that their school collects and records data at the
end of each term and two-fifths (43 per cent) said that they collect and record data more
than once a term. Three-fifths of respondents (60 per cent) said that staff would benefit
from training on assessment without levels.
2.14 Use of systematic synthetic phonics
Systematic synthetic phonics, which map incremental progression in pupils’ phonic
knowledge and skills, enables teachers to track children's progress and identify
difficulties, so that appropriate support can be provided. DfE provides information for
schools including core criteria that define the key features of an effective phonics
teaching programme. Primary schools were asked what their current practice was in
terms of the use of synthetic phonics as a method to teach children to read. More than
three quarters (77 per cent) of primary school respondents said that they used systematic
synthetic phonics. About three-fifths (61 per cent) of respondents answering the question
said that it was the primary method used to teach children to read.
112.15 SEND
A child or young person has Special Educational Needs or Disability (SEND) if he or she
has a learning difficulty or disability which calls for special educational provision to be
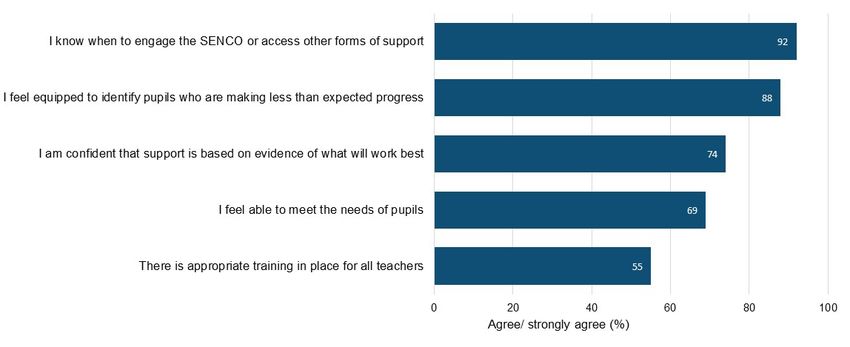
made for him or her. Respondents were asked a series of questions about the SEN
support for pupils in their school who have SEND but who do not have a statement or an
Education, Health and Care plan. The majority (88 per cent) agreed or strongly agreed
with the statement ‘I feel equipped to identify pupils who are making less than expected
progress and who may have a SEN or a disability’. The corresponding figures for other
statements were: ‘I feel able to meet the needs of pupils on SEN support’ (69 per cent),
‘there is appropriate training in place for all teachers in supporting SEN support pupils’(55
per cent), ‘I know when to engage the Special Educational Needs Coordinator (SENCO)
or access other forms of support in relation to SEN support pupils’ (92 per cent) and ‘I am
confident that when support is put in place for SEN support pupils, it is based on
evidence of what will work best to meet their needs, and enables them to make progress
towards good outcomes’ (74 per cent).
2.16 New GCSEs and the English Baccalaureate
Since 2011, the Government has been engaged in a process of curriculum and
qualification reform in England. New GCSE qualifications in English language, English
literature and mathematics were introduced from 2015 with other subjects introduced in
2016 and 2017. The English Baccalaureate (EBacc) was introduced as a school
performance measure in 2010. It allows people to see how many pupils get a grade C or
above in the core academic subjects at key stage 4 in any government-funded school.
Secondary schools were asked how confident they were about introducing the new
GCSEs due to be taught from September 2017, whether they had concerns about
particular subjects listed, what percentage of pupils would be studying the English
Baccalaureate (EBacc) subjects of English, mathematics, the sciences, languages and
humanities and separately, what proportion would be studying a language GCSE. Almost
three-quarters (72 per cent) of secondary senior leaders said they were very confident or
fairly confident they would be able to teach the new GCSEs from September 2017.
Nearly half (48 per cent) of secondary senior leaders said that more than half of those
pupils starting key stage 4 in September 2017 would be studying the subjects required
for the EBacc and a quarter (27 per cent) said that more than 70 per cent of pupils would
be doing so. Most secondary senior leaders (63 per cent) said that they intended to keep
the proportion of pupils entering key stage 4 who would be studying the subjects required
to enter the EBacc broadly the same. Nearly half (48 per cent) of secondary senior
leaders said that more than half of those starting key stage 4 in September 2017 would
be studying a language GCSE.
122.17 Teachers moving schools
The DfE report, Schools workforce in England 2010 to 2015: trends and geographical
comparisons (2016), showed that school-to-school teacher mobility was the biggest
source of new teacher entrants to schools and therefore a key driver of increased
recruitment activity in schools.
Classroom teachers were asked what factors would attract them to a school, or put them
off working in another school. They were presented with 13 potential factors and were
asked to rank them from most to least important. Nearly a quarter (24 per cent) of all
classroom teachers ranked ‘positive school reputation’ as the most important factor for
why they would want to work in a particular school. A fifth (20 per cent) of classroom
teachers ranked ‘quality of leadership’ as the most important reason and almost a fifth
(19 per cent) ranked ‘distance from where I live’. When asked what factors would put
them off wanting to teach in a particular school, about a quarter (26 per cent) of
classroom teachers ranked ‘distance from where I live’ as the most important factor.
Other factors were ‘quality of leadership’ (17 per cent) ‘poor Ofsted rating’ (12 per cent),
‘high workload’ (12 per cent), ‘poor school reputation’ (11 per cent) and ‘challenging pupil
behaviour’ (10 per cent).
133. Aspiration for school leadership
Strengthening school and system leadership is at the heart of the Government’s strategy
for education and children’s social care services. The Department for Education (DfE)’s
Strategy for 2015-20 (DfE, 2016) highlights the importance of ensuring a ‘strong,
consistent supply’ of school leaders across England, especially in schools which may
have struggled to attract leaders in the past (DfE, 2016). These ambitions require a pool
of suitable applicants who aspire to becoming headteachers both in the short and
medium term.
The survey obtained the views of 549 deputy and assistant headteachers and 943
classroom teachers on whether they aspired to become a headteacher in the next three
years, during the next decade, or at some other point in the future. Those who were not
interested in pursuing this goal were asked to give their reasons by choosing one of nine
specified options and had the opportunity to add a further open-ended response.
Figure 1 Do you aspire to be a headteacher?
Source: Teacher Voice Omnibus Survey May 2017 and Senior Leader booster May 2017
Due to rounding, percentages may not sum to 100
N=1492
The responses show that more than three-quarters (78 per cent) of all of those who
responded to the question said they did not aspire to become a headteacher and that a
fifth (22 per cent) planned on doing so at some point in the future. However, although 18
14per cent of respondents planned to become a headteacher during the next decade, only
half of them (9 per cent) aimed to do so in the next three years.
Figure 2 When did respondents hope to become a headteacher
Source: Teacher Voice Omnibus Survey May 2017 and Senior Leader booster May 2017
Due to rounding, percentages may not sum to 100
N=1492
As might be expected, there was an important difference between the responses of
senior leaders and classroom teachers. While nearly half (45 per cent) of senior leaders
wanted to become a headteacher at some point in the future, the percentage of
classroom teachers who wanted to do so (9 per cent) was much smaller. Even so, more
than half of the senior leaders who responded to the survey (55 per cent) did not aspire
to headship.
The three main reasons selected by respondents for not aspiring to headship were:
• issues related to work-life balance (17 per cent)
• a desire to stay in the classroom (15 per cent)
• perceptions of the pressure and pace of the role (10 per cent).
15Figure 3 Reasons why respondents did not aspire to headship
Source: Teacher Voice Omnibus Survey May 2017 and Senior Leader booster May 2017
Due to rounding, percentages may not sum to 100
N=1492
Respondents working in primary and secondary schools gave similar answers to this
question.
164. Flexible working patterns
The DfE wishes to encourage schools to give more teachers the opportunity to work
flexibly around their caring and family commitments, including part-time working and job
sharing. They want to ensure talented teachers are not lost because of a lack of flexible
working opportunities. The DfE published its 2017 Flexible Working Guidance, based
around real-life school and individual teacher case studies, to advise teachers who are
considering working flexibly and to help schools and employers consider how best to
encourage, support and enable flexible working requests. The Department is also
planning a range of activities to support schools to deploy all their staff effectively and
efficiently, which will include re-scoping projects to support teachers to return to the
profession in flexible working positions; improving coaching offers for women teachers
and piloting whole organisation approaches to increase and support flexible working.
The survey asked respondents about their opinion on part-time and flexible working
arrangements in their school.
Figure 4 Is it easy for teachers in your school or for teachers returning to teaching to agree part-
time working arrangements or flexible working patterns?
Source: Teacher Voice Omnibus Survey May 2017 and Senior Leader booster May 2017
Due to rounding, percentages may not sum to 100
N=1955
Most respondents (60 per cent) said that it was easy for teachers in their school or
returning to teaching to arrange part-time or flexible working arrangements. However,
around a quarter (27 per cent) said that it was not easy for teachers in their school or
returning to teaching to arrange part-time/flexible working and the remainder (13 per
cent) replied ‘don’t know’.
A higher percentage of senior leaders (68 per cent) than classroom teachers (51 per
cent) said that it was possible to arrange part-time or flexible working arrangements. This
17difference may have been influenced by the fact that nearly a fifth (19 per cent) of
classroom teachers replied ‘don’t know’ to the question.
The survey asked those who responded that it was not easy to arrange part-time or
flexible working to rank five potential barriers to such arrangements in their schools in
order of significance.
Two barriers were identified as the most significant by more than three-quarters of
respondents. Nearly half (47 per cent) ranked ‘timetabling issues’ as the most significant
barrier to part-time or flexible working and a further 20 per cent ranked this as their
second most significant barrier.
Almost twice as many senior leaders (63 per cent) as classroom teachers (33 per cent) in
secondary schools ranked this factor as the most significant barrier to part-time or flexible
working. A higher percentage of respondents in secondary schools (62 per cent) than in
primary schools (32 per cent) also ranked this as the most significant barrier.
Just under a third (31 per cent) of all respondents ranked ‘senior management and/or
governors are not supportive’ as the most significant barrier to part-time and flexible
working. A further 14 per cent ranked this as their second most significant barrier.
The percentage of classroom teachers (46 per cent) who ranked this as the most
significant factor was much higher than senior leaders (13 per cent). At the same time,
nearly two-fifths (37 per cent) of primary school respondents ranked this as the most
significant factor compared with 24 per cent of those in secondary schools.
Only a small percentage of respondents selected any of the other options as the most
significant barriers to flexible or part-time working. The same percentage of respondents
(6 per cent) ranked ‘policies on flexible working and job-sharing do not exist’ and
‘advertisements specify full-time only’ as the most significant barrier while three per cent
selected ‘issues with childcare’.
Figure 5 shows the percentage of all respondents, senior leaders and classroom
teachers who selected each of the statements as the most significant barrier.
18Figure 5 Most significant barriers to agreeing part-time working arrangements or flexible working
patterns for teachers in your school or teachers returning to teaching
Source: Teacher Voice Omnibus Survey May 2017 and Senior Leader booster May 2017
Due to rounding, percentages may not sum to 100
N=520
195. Sources of support for schools
Sources of support are an important aspect of the self-improving school system. The
system is based on schools taking responsibility for their own improvement, schools
learning from each other so that effective practice is disseminated and the best schools
and leaders extending their reach, thereby contributing to school improvement across the
system (DfE (2010), The Importance of Teaching).
The Government provides a framework of support for schools through the National
College for Teaching and Leadership (NCTL) which aims ‘to improve academic
standards by recruiting and developing a workforce to meet the needs of our school
system, and to help schools to help each other to improve’. NCTL’s priorities for 2016-17
included encouraging schools to develop their own networks of high-quality school-to-
school support and enabling schools to broker support from the best school leaders and
teachers working with Teaching School Alliances, the Teaching School Council, National
Leaders of Education, and national support schools. Schools can also access support
from other sources such as local authorities (LAs), multi-academy trusts (MATs),
dioceses and education consultancies offer important sources of support for schools in
this respect.
The survey investigated senior leaders’ views about the effectiveness of nine sources of
support that may be available to them and asked which their school had used.
Respondents were also given the opportunity to add a further open-ended response in
answer to both questions.
When asked to identify sources of effective support for schools in their areas, nearly half
of the school leaders who responded selected teaching schools (46 per cent) and LAs
(44 per cent). Over a third (36 per cent) identified education consultancies (individual or
company) as providing effective support, while around a quarter identified each of the
following sources: a MAT (26 per cent), a school that is not a teaching school (26 per
cent) and National Leaders of Education (24 per cent). Specialist Leaders of Education
were identified as effective sources of support by a fifth of senior leaders (20 per cent).
Less than one in ten (8 per cent) of school leaders said they had accessed support from
National Leaders of Governance.
20Figure 6 Which of the following do you think are effective sources of support for schools in your
local area?
Source: Teacher Voice Omnibus Survey May 2017 and Senior Leader booster May 2017
More than one answer could be given, so percentages may sum to more than 100
N=1017
There were several differences between the responses from senior leaders in primary
and secondary schools to this question:
• A higher proportion (57 per cent) of primary school leaders identified LAs as an
effective source of support compared with 33 per cent of secondary school
leaders.
• A higher percentage of secondary school leaders (49 per cent) selected Teaching
Schools as an effective source of support compared with 42 per cent of primary
school leaders.
• A higher percentage of primary school leaders (40 per cent) selected an education
consultancy as an effective source of support compared with a third (32 per cent)
of those in secondary schools.
• A higher proportion of secondary school leaders (36 per cent) identified MATs as
an effective source of support compared with 15 per cent of primary school
leaders.
• A higher percentage of primary school leaders (31 per cent) selected schools that
are not Teaching Schools compared with a quarter (23 per cent) of secondary
schools.
• A higher percentage of primary schools (21 per cent) than secondary schools (11
per cent) identified a diocese as an effective source of support.
21The 118 respondents who identified another source of support referred to partnerships
such as local learning networks (37 respondents), clusters of schools (28 respondents)
and local headteachers (13 respondents). These responses suggest some differences in
the sources of support identified as effective by primary and secondary school leaders. A
total of 26 primary school senior leaders referred to cluster of schools, but this was noted
by only two secondary school leaders. Similarly, 11 primary school leaders referred to
support from local headteachers, but this option was noted by only two secondary school
leaders. PiXL Club was identified as an effective source of support exclusively by senior
leaders in secondary schools (15 respondents).
Senior leaders were then asked which of the nine listed sources of support their school
had ever accessed. The responses showed that three main sources of support were
accessed by the majority of respondents’ schools. More than two-thirds of senior leaders
(68 per cent) said their school had accessed support from local authorities. More than a
half had accessed support from teaching schools (52 per cent) and the same percentage
said that they had done so from an education consultancy (52 per cent). A smaller
proportion of senior leaders said that their school had used the other sources of support
listed.
There were some differences in response between senior leaders in primary and
secondary schools. More than three quarters of primary school leaders (78 per cent) said
their school had accessed support from the LA compared with 60 per cent of those in
secondary schools. Almost three fifths of secondary senior leaders (57 per cent) said that
they had accessed support from teaching schools compared with 46 per cent of primary
senior leaders.
A higher proportion of secondary schools (37 per cent) had accessed support from a
MAT, compared with 20 per cent of those in primary schools. Similarly, a higher
percentage of secondary schools (28 per cent) than primary schools (22 per cent) had
accessed support from National Leaders of Education. Likewise, the percentage of
secondary school leaders whose schools had accessed support from Specialist Leaders
of Education (27 per cent) was higher than those in primary schools (21 per cent).
Conversely, a higher percentage of primary school leaders (26 per cent) than those in
secondary schools (15 per cent) reported that their school had accessed support from a
diocese.
A total of 80 people identified another source of support their school had used. The most
common were: school partnerships (26 senior leaders, mainly from primary schools),
cluster groups (13 respondents), and PiXL Club (12 respondents, all of whom worked in
secondary schools).
226. Teacher workload
Removing unnecessary workload is high on the education agenda. The Government
undertook the Workload Challenge in 2014, which asked teachers about unnecessary or
unproductive tasks, strategies in schools to manage workload and what more
government and schools could do to minimise workload. The three tasks that were most
commonly reported as adding unnecessary burdens were: recording, inputting,
monitoring and analysing data, excessive/depth of marking and detail/frequency of
lesson planning. Respondents most commonly said that the burden of their workload was
driven by accountability/perceived pressures of Ofsted, tasks set by senior/middle
leaders, working to policies set at local/school level and policy change at national level.
The Government’s response to the Workload Challenge was published on 6 February
2015 and included a comprehensive programme of action to help address the complex
issues that were raised. Independent review groups were set up in 2015 to help address
the three biggest issues raised by teachers in the Workload Challenge which contribute
to unnecessary or burdensome work: marking, planning and resources and/or data
management. The reports, published on 26 March 2016, set out principles and made
recommendations for action at every level in the school system.
On 24 February 2017 the Department published the results of the 2016 teacher workload
survey, a commitment from the Workload Challenge. Results from the survey help track
teacher workload so that further action can be taken if needed. DfE also published a
clear action plan; providing an update on how it is meeting the recommendations from
the three review groups and setting out further steps it will take to help tackle the issues
identified in the survey.
In addition, the Department reissued the reviewed DfE protocol giving schools a year’s
lead-in time for significant changes to accountability, curriculum and qualifications. Ofsted
have also set out clear guidance about what they do and do not need to see in
inspections in order to reduce workload; this is now incorporated into The School
Inspection Handbook.
Senior leaders and classroom teachers were presented with four statements and asked
to select the ones that were relevant to their school. They were also given the opportunity
to add a further open-ended response.
Nearly a third of respondents (32 per cent) said their school had used the independent
reports on marking, planning and resources and/or data management as a basis to
review current policies. A similar proportion (31 per cent) had used advice from Ofsted
(e.g. Ofsted handbook or #OfstedMyths) to change practice in the school. Around a
quarter (26 per cent) had carried out a workload survey of staff. Just over a fifth (22 per
cent) actively addressed the recommendations for schools in the reports on marking,
planning and resources, and/or data management.
23Figure 7 What has your school done to evaluate and reduce unnecessary workload?
Source: Teacher Voice Omnibus Survey May 2017 and Senior Leader booster May 2017
More than one answer could be given, so percentages may sum to more than 100
N=1962
There were some differences between the responses of senior leaders and classroom
teachers to this question, which suggested that senior leaders were more positive than
classroom teachers about their schools’ actions to reduce workload. A higher percentage
of senior leaders than classroom teachers indicated that their school had carried out
each of the actions listed in the question.
A higher percentage of senior leaders (47 per cent) than classroom teachers (17 per
cent) said that they had used the independent reports on marking, planning and
resources and/or data management as a basis to review current policies.
A higher percentage of senior leaders (34 per cent) than classroom teachers (8 per cent)
said that their school actively addressed the recommendations for schools in the reports
on marking, planning and resources and/or data management. At the same time, a
higher percentage of senior leaders (48 per cent) than classroom teachers (13 per cent)
said they used advice from Ofsted (e.g. Ofsted handbook or #OfstedMyths) to change
practice in the school. A third (32 per cent) of senior leaders said they had carried out a
workload survey of staff compared with a fifth (19 per cent) of classroom teachers.
There was little difference by school phase. However, a higher percentage of secondary
school respondents (30 per cent) said they had carried out a staff workload survey
compared with 21 per cent of those in primary schools.
A total of 226 respondents said that their school had used some other strategy to
evaluate and reduce unnecessary workload. The largest single response (made by 21
24per cent of respondents giving another response) was that their school had consulted
with staff in ways other than a survey. In addition, 14 per cent of those giving another
response said that they had reviewed or updated school policies and eight per cent of
those giving another response said they had reviewed marking arrangements.
Figure 8 What has your school done to evaluate and reduce unnecessary workload? Open-ended
responses
Source: Teacher Voice Omnibus Survey May 2017 and Senior Leader booster May 2017
More than one answer could be given, so percentages may sum to more than 100
N=226
Respondents who indicated their school had taken action to evaluate and reduce
unnecessary workload were asked to estimate the average impact of the changes their
school had made. About half (53 per cent) of the respondents who indicated that their
school had taken action to evaluate and reduce unnecessary workload said the changes
had effectively reduced unnecessary workload; nearly two-fifths (39 per cent) of
respondents said that the workload was reduced by up to 2 hours a week, with some
saying that workload was reduced by more than two hours per week (14 per cent).
A higher percentage of senior leaders thought the changes had made a difference. Just
over two-fifths of senior leaders (43 per cent) thought that it had reduced average teacher
workload by up to two hours per week, compared with a third (32 per cent) of classroom
teachers). A sixth of senior leaders (17 per cent) thought it had reduced average teacher
workload by more than two hours per week. This compared with only one in ten (10 per
cent) of classroom teachers.
25There was little difference between primary and secondary respondents. Just over half
(58 percent) of those in primary thought it had been successful in reducing workload
compared to half (50 percent) of those in secondary schools.
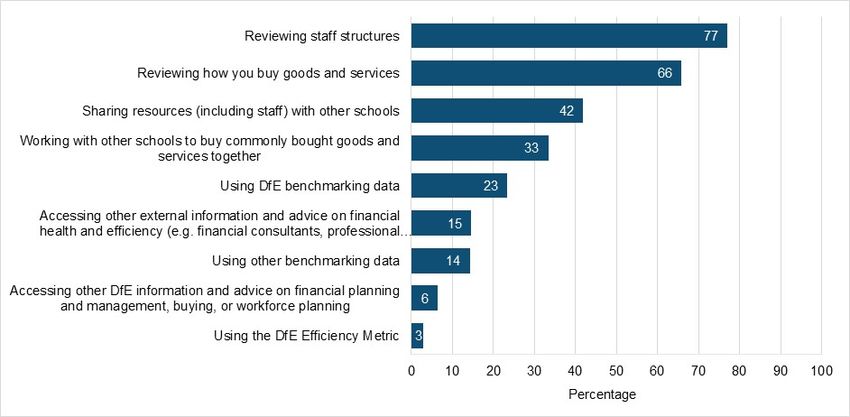
267. Budget planning
It is vital that schools get best value from all their resources to achieve the best outcomes
for all their pupils and promote social mobility. The Department for Education publishes
online tools and guidance to help schools plan their budgets and improve their efficiency
and long-term financial health. This includes:
• improved financial benchmarking service (launched in July 2017 following
feedback from users) that enables schools to compare their performance data and
spending levels with schools that share similar characteristics;
• efficiency metric that helps schools to understand whether they could improve
their efficiency relative to other similar schools;
• workforce planning guidance and curriculum planning tools; and
• several initiatives as part of a schools’ buying strategy (published in January 2017)
that builds on current support to help schools to improve how they buy goods and
services and save £1bn by 2019-20 on their non-staff spend.
The survey asked senior leaders about the actions they had found useful in getting the
most out of their school budget. The question provided nine possible actions and asked
which, if any, they had found useful. They were also invited to identify any other action
they had taken.
Two actions were identified as useful by the majority of senior leaders: around three
quarters (77 per cent) had found it useful to review their staffing structure, and two thirds
(66 per cent) had found it useful to review how they buy goods and services.
A minority of respondents identified the remaining seven listed actions as useful in
getting the most out of their school budget, although the following three were identified as
useful by a substantial minority: ‘sharing resources (including staff) with other schools’
(42 per cent), ‘working with other schools to buy goods or services’ (33 per cent) and
‘using DfE benchmarking data’ (23 per cent). A much smaller percentage of the senior
leaders selected the other options: ‘accessing other external information and advice on
financial health and efficiency’ (15 per cent), ‘using other benchmarking data’ (14 per
cent), ’accessing other DfE information and advice on financial planning and
management, buying, or workforce planning’ (6 per cent), and ‘using the DfE Efficiency
Metric’ (3 per cent).
27Figure 9 Which of the following actions, if any, have you found useful in getting the most out of
your budget?
Source: Teacher Voice Omnibus Survey May 2017 and Senior Leader booster May 2017
More than one answer could be given, so percentages may sum to more than 100
N=1017
There was little difference in the responses of primary and secondary school leaders
except that a higher percentage of senior leaders in secondary schools (82 per cent)
identified ‘reviewing staff structures’ as useful compared with leaders in primary schools
(71 per cent). On the other hand, a higher proportion of senior leaders in primary schools
(40 per cent) identified ‘working with other schools to buy goods or services’ as useful,
compared with 28 per cent of secondary school leaders.
The open-ended responses suggested that school leaders had taken a very wide range
of other actions in order to get the most out of their school’s budget, but few actions were
identified by more than one respondent other than ‘support from MAT’ (six respondents),
‘business manager employed’ (five respondents), ‘letting/renting out facilities’ (four
respondents), and ‘working with a government agency’ (four respondents).
288. Behaviour/impact of poor behaviour
The DfE recognises poor behaviour in schools impedes learning and prevents pupils
from achieving their full potential. They have committed to ensuring that all teachers are
equipped with the skills to tackle both serious behaviour issues that compromise the
safety and wellbeing of pupils as well as low level disruption that too often gets in the way
of effective learning.
In September 2014, Ofsted expressed concern about the amount of time lost due to low-
level behaviour issues in school (Ofsted 2014). They estimate that children could be
losing the equivalent of a five hours each week (or 38 days per year) due to such
behaviour.
While Ofsted has linked the issue of behaviour with the standard of teaching and learning
(arguing that good teaching in itself promotes positive behaviour), the DfE has also
emphasised schools’ duties to promote effective behaviour and has clarified what
teachers are able to do in response to disruptive pupils.
The DfE requires schools to create behaviour policies that promote consistency, outline
procedures and sanctions, and support pupils to develop a positive attitude to learning
and their school. These are public documents, designed to ensure that parents, pupils,
and staff understand the expectations, the way the policies will be implemented, and
what their own roles are in relation to behaviour (DfE, 2016).
Respondents were asked to rate pupil behaviour in their school and to estimate how
much lesson time was lost due to misbehaviour. They were then asked how confident
they were in their school’s ability to deal with challenging pupils and to rate their school in
terms of parental engagement where behaviour is an issue.
Nearly three quarters (73 per cent) responded that behaviour was good or very good and
a third (31 per cent) said it was very good. Most of the other respondents (19 per cent)
described behaviour as acceptable and only a small percentage (8 per cent) said it was
poor or very poor.
Four-fifths (80 per cent) of respondents in primary schools described their pupils’
behaviour as good or very good as did just over two-thirds (68 per cent) of those in
secondary schools. Moreover, nearly two-fifths (38 per cent) of primary school
respondents described behaviour as very good, a view shared by around a quarter (26
per cent), of secondary school respondents. Most other primary and secondary school
respondents rated behaviour as acceptable.
29Figure 10 How would you rate pupil behaviour in your school?
Source: Teacher Voice Omnibus Survey May 2017 and Senior Leader booster May 2017
Due to rounding, percentages may not sum to 100
N=1959
Senior leaders had a more positive view of behaviour than classroom teachers. More
than four fifths of senior leaders (86 per cent) rated behaviour as good or very good. This
compared to three fifths (59 per cent) of classroom teachers. It is noticeable that the
proportion of senior leaders who rated behaviour in their school as very good (43 per
cent) was more than twice the percentage of classroom teachers (19 per cent).
Conversely, one eighth (13 per cent) of classroom teachers rated behaviour as poor or
very poor (compared to a mere 3 per cent of senior leaders).
The survey then explored how much learning time respondents believed was lost in each
hour of teaching when a single episode of challenging behaviour occurs. 1 More than half
(59 per cent) of respondents believed that up to five minutes in each hour of teaching
time was lost when such an issue arose. A fifth (19 per cent) thought that six to ten
minutes was lost because of challenging behaviour. However, less than one in ten (8 per
cent) thought that more than ten minutes was lost in this way.
A higher percentage of classroom teachers responded that lesson time was lost due to
challenging behaviour. One in three (33 per cent) classroom teachers thought that more
than six minutes in each hour of teaching time was lost when a single episode of
challenging behaviour occurred. This view was shared by a much lower percentage (21
per cent) of senior leaders.
1
Challenging behaviour was defined as behaviour which has a duration, frequency, intensity or persistence
that is beyond the normal range that schools tolerate; and most unlikely to respond to the customary
strategies used in the classroom and school.
30There was little difference in the views of respondents in primary and secondary schools.
However, a higher percentage of primary school respondents (17 per cent) than those in
secondary schools (11 per cent) said that the time lost due to challenging behaviour
varied too much for them to be able to say.
The survey also explored how confident respondents were in their school’s ability to deal
with pupils that present the most challenging behaviours. Around three quarters of
respondents (76 per cent) said they were fairly confident or very confident in their
school’s ability to deal with this issue. A much smaller percentage of respondents said
they were not very confident (11 per cent) or not at all confident (3 per cent).
However, although a large majority of respondents said they were confident or very
confident in their schools ability to deal with such issues, the percentage was higher
among senior leaders (88 per cent) than classroom teachers (64 per cent). Furthermore,
the percentage of senior leaders who said they were very confident (44 per cent) was
more than twice the percentage of classroom teachers who said so (19 per cent).
A higher percentage of respondents in primary schools (81 per cent) than in secondary
schools (72 per cent) were confident or very confident their school would be able to deal
with pupils that present the most challenging behaviours.
Finally, respondents were asked to rate how effective their school was at parental
engagement where behaviour was an issue; three-fifths (59 per cent) of respondents
rated their school as good or very good in this respect. More than a quarter (29 per cent)
rated this aspect of their school’s work as acceptable and much smaller numbers rated it
as poor (9 per cent) or very poor (2 per cent).
The percentage of senior leaders who said their school was good or very good at
parental engagement where behaviour was an issue (71 per cent) was much higher than
classroom teachers (47 per cent). Conversely, more than a third of classroom teachers
(36 per cent) said it was acceptable, compared with a fifth (21 per cent) of senior leaders.
A higher percentage of respondents from primary schools (64 per cent) than secondary
schools (56 per cent) rated this aspect of their school’s work as good or very good.
319. Alternative provision
Alternative provision (AP) is the education put in place for any child of compulsory school
age who would not otherwise receive suitable education because of illness, permanent
exclusion or for any other reason.
Local authorities have a duty to put AP in place in most cases, with the exception of
education during fixed period exclusions of over five days, where schools have a duty to
put AP in place. Schools can also choose to direct pupils offsite without issuing an
exclusion in some circumstances.
The AP put in place must be suitable and full time or as close to full time as in the child’s
best interest because of his or her health needs. It is up to the commissioner to
determine the most appropriate AP for a child but they take into account the views of the
pupil, their parents and other professionals.
The survey asked school leaders which pupil needs they felt there were insufficient
places for different categories of pupils who needed alternative provision and also
whether they considered there were insufficient quality places for those groups of
learners.
More than four fifths (84 per cent) of school leaders said there were insufficient places for
pupils with mental health needs. Around three quarters (74 per cent) said there were
insufficient places for pupils without SEN who had behavioural issues and the same
percentage (74 per cent) said there were insufficient places for pupils with SEN who had
behavioural issues. A much smaller percentage (25 per cent) said there were insufficient
places for pupils with physical health needs.
There was little difference in the views expressed by senior leaders in primary and
secondary schools except that 90 per cent of secondary senior leaders felt that there
were insufficient places for pupils with mental health needs compared with 77 per cent of
primary senior leaders.
As noted above and shown in Figure 11 the second question sought senior leaders’
opinion about whether there were insufficient quality places, regardless of whether there
were sufficient places overall. Around three quarters (78 per cent) of senior leaders felt
there were insufficient quality places for pupils with mental health needs. About two thirds
(67 per cent) said there were insufficient quality places for pupils with SEN who had
behavioural issues and the same percentage (67 per cent) said there were insufficient
quality places for pupils without SEN who had behavioural issues.
Figure 11 Thinking of Alternative Provision in your area, please indicate the needs for which there
are insufficient quality places
32You can also read