THE WEAK LINK THE ROLE OF LOCAL INSTITUTIONS IN ACCOUNTABLE NATURAL RESOURCE MANAGEMENT PERU - Oxfam International
←
→
Page content transcription
If your browser does not render page correctly, please read the page content below
OXFAM RESEARCH REPORT

THE WEAK LINK
THE ROLE OF LOCAL INSTITUTIONS
IN ACCOUNTABLE NATURAL
RESOURCE MANAGEMENT

PERU
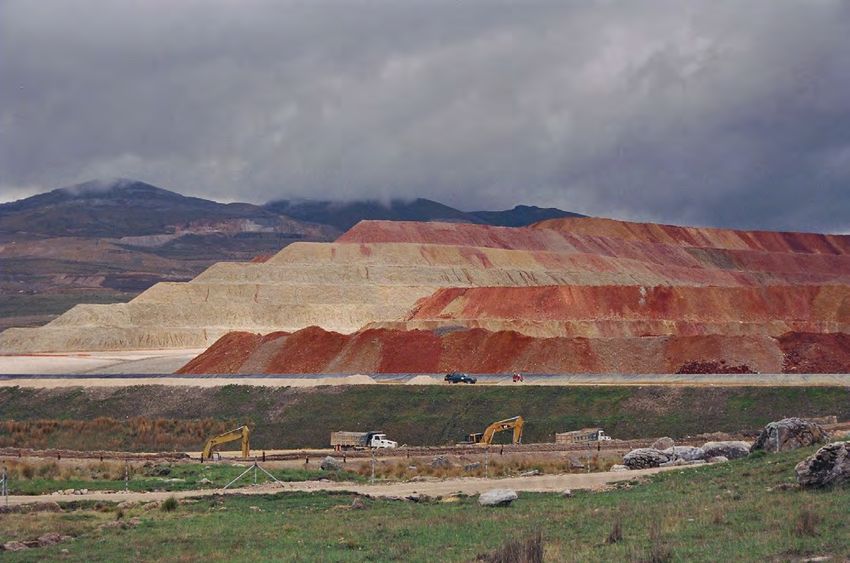
COVER: Area near Tintaya Copper Mine (Espinar),
                     Cusco.

                     Chris Hufstader / Oxfam America

2   Oxfam America | The Weak Link: The Role of Local Institutions in Accountable Natural Resource Management, Peru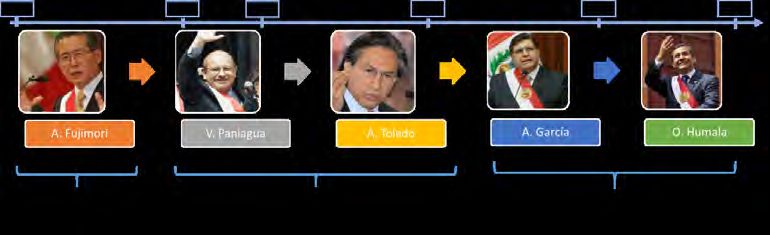
CONTENTS
Executive Summary .............................................................................................. 2

   Acronyms Used in This Report .......................................................................... 5

1. Introduction ....................................................................................................... 7
   An Overview of Extraction ............................................................................... 10

2. Methods and Conceptual Framings ................................................................ 13

3. Revenue Sharing in Peru ................................................................................ 15

   Understanding Revenue Sharing in Peru ........................................................ 19

   Understanding the “Canon” ............................................................................. 32

   Accountability and Revenue Sharing............................................................... 36

4. The Budget Process in Peru ........................................................................... 39
   Controlling the Execution of the Budget .......................................................... 41

   Failings in the Budget Process ........................................................................ 41

5. Influencing Revenue Allocations ..................................................................... 45

6. The Accountability Context ............................................................................. 52

   Implications of Limited Accountability .............................................................. 56

   Understanding a Persistent Lack of Accountability ......................................... 59

7. A Note on Decentralization ............................................................................. 65

8. Opportunities for CSO Influence ..................................................................... 67

9. Conclusion ...................................................................................................... 73

References .......................................................................................................... 76


     The Weak Link: The Role of Local Institutions in Accountable Natural Resource Management, Peru | Oxfam America         1
EXECUTIVE SUMMARY Peru’s mining sector is well established and has contributed significantly to the country’s economic growth. The country has likewise made significant gains in terms of addressing both income-based inequality and poverty. Despite these gains, however, more than seven million Peruvians persist in a state of poverty while levels of inequality remain stark. As such, despite the positive outcomes that have been produced by the country’s natural resource wealth, it appears that there is more that could be achieved with these riches in terms of addressing human development. This research is inspired by the desire to improve the extent to which natural resource wealth contributes to poverty alleviation. The focus of the work is on exploring the possibilities for (i) increasing the quantity of revenues that remain in Peru as a result of the exploitation of their natural resources, and (ii) making sure that the revenues which flow from extractive industries are effectively allocated towards fighting poverty. To these ends the report is focused on understanding the political economy of revenue sharing agreements, budget processes and oversight institutions. Peru’s extractive sector includes both petroleum and minerals. Despite this, due to the dominance of the mining sector in the country’s economy this work focuses only on mining. Peru’s ability to capture revenues from the mineral sector has been shaped most prominently by the fact that the sector was reformed under conditions of radical structural adjustment. Within this process the mining sector was identified as the spearhead of efforts to attract foreign investment to the country and salvage the foundering economy. As such the terms offered to companies operating in the sector have historically been generous. Since then, the extractive industry revenues in Peru have been contested. In general, these contests have included popular demand for the state to receive a greater portion of the revenues from extractive industries, an executive tolerance for neo-liberal economics focused on attracting investment, and a mining lobby focused on ensuring that agreements and regulations in the sector remained minimal and that those revenues which were collected were oriented towards the populations in affected areas—in order to create favorable conditions for extraction. 2 Oxfam America | The Weak Link: The Role of Local Institutions in Accountable Natural Resource Management, Peru
Over time, and with the boom in commodity prices, the Peruvian state has been
able to wrest back control over the revenues raised from the sector and partially
improve the terms for revenue collection so that they are more favorable towards
the state. Illustrative of this has been the creation of royalties for mining
companies, the renegotiation and amendment of fiscal stability agreements in the
mining sector, the creation of the voluntary mining fund, and the establishment of
a special mining tax. Despite these changes, the fiscal terms contained in Peru’s
mining laws are still thought to be relatively generous towards companies,
especially given the country’s attractiveness in terms of its mineral potential.

Revenues from Peru’s extractive industries are allocated through the “canon
system,” by which fifty percent of the value of the mineral resources are
transferred back to subnational governments in producing regions. The
remaining fifty percent of the natural resource revenues enter the national
budget.

Although the canon was introduced in the 1970s as part of the means to manage
the revenues from oil production, it was translated to the mining sector in the
1990s as a means to provide subnational governments with a share of the
income collected from the mining sector. The canon was retained in the 2000s as
a means to fund decentralization in the country. Today the canon is largely
understood as a compensation mechanism for dealing with the impacts of mining
in production areas. Notably, although there has been significant national debate
over the generosity of the agreements between the government and mining
companies, historically the issue of how revenues are allocated through the
canon has been more contentious.

Despite the large sums of money contained in the canon, its developmental
outcomes have been somewhat disappointing. Significant differences in the flow
of resources between producing and non-producing areas has created inequality
in the country. Similarly, because local level government budgets are determined
by the participatory budgeting process, and this process is susceptible to
dominance by urban elites, the spending of canon revenues has benefited urban
centers more than rural areas. In addition, problems of maladministration at the
local level have created problems for the effective use of canon revenues.

In general, there is no specialized accountability mechanism monitoring revenues
from the mining sector and revenues are audited under the existing
administrative systems. There are, however, laws covering the transparent use of
natural resources in Peru.

Despite these allowances oversight of the sector suffers from significant
constraints. The capacity of the state to audit companies has historically been
limited, as the tax authority has been unable to verify production volumes, costs
and transaction prices; and there are no rules in place to assess mineral volumes

   The Weak Link: The Role of Local Institutions in Accountable Natural Resource Management, Peru | Oxfam America   3
and values. Likewise, the country has historically shown little political will to audit
its own budget process (including the canon).

The result is that the effectiveness of transparency legislation in the country is
limited by the fact that resources are only open to public scrutiny once they are in
the system of public finances. The points at which they leave and enter the
system are not thought to experience suitable oversight, and this is where the
largest leakages are thought to occur. In addition, even those transparency laws
that do exist are compromised by the fact that they lack any sort of enforcement
mechanism, and exclude much company data. Finally, the data which is made
publicly available is thought to be too technical to be understood by the lay
public.

The budget process, and the process of resource distribution which takes place
through it, is dominated by the Ministry of the Economy and Finance (MEF)
which was empowered as a result of the structural adjustment reforms which
took place in the country. At the subnational level, budget priorities are set
through the participatory budget. Due to the costs involved in participating in this
institution, however, the participatory budget tends to be dominated by urban
interests. In addition, the process of approving the participatory budget still
places the process under the control of the MEF.

Budget oversight principally falls to Congress who has to formally approve the
budget; however, Congress is unable to effectively carry out this function due to
capacity and incentive problems. At the same time, internal oversight
mechanisms, in the form of the Internal Control Entities, are insufficient.

The outcome of executive control over the budget is that budget allocations are
driven by a competition between president and the MEF, with the former
generally pushing to increase social expenditure, while the latter maintains a
relatively austere approach to social expenditure.

The specific accountability failings regarding the budget and extractive revenues
in Peru are related to the broader institutions of accountability which operate in
the country more generally. In this respect failings of oversight regarding
extractive revenues are related to problems in the Congress, the media and the
judiciary. All of these institutions are thought to have failed to recover from the
Fujimori regime under which power was centralized within the executive, the
independence of the media was compromised, and the autonomy of oversight
functions was compromised.

Today, problems with the Congress persist as a result of the general public’s
mistrust of the established political parties, which means that it is difficult for any
issue to achieve consensus in Congress. In addition, this lack of trust drives a
high rate of turnover in elected officials which means that those officials have
limited incentives to act in fidelity with their election promises. The result is that

4   Oxfam America | The Weak Link: The Role of Local Institutions in Accountable Natural Resource Management, Peru
issues of maladministration are hard to pursue, while the structural changes
needed to address these problems cannot get political traction. At the same time,
the media has become an important channel for shaping popular opinion, being
generally sympathetic to a neoliberal agenda.

Within this context civil society’s ability to undertake effective audits of
government expenditure, based on information published under the country’s
transparency legislation, has been limited. Successes have largely been confined
to cases focusing on budget transfers, however, when trying to audit actual
expenditures, efforts are often frustrated by the fact that access to information
requests are frequently ignored. Likewise, problems of record keeping at the
local level prove an important hurdle to effective social auditing.

ACRONYMS USED IN THIS REPORT
APRA: party—American Popular Revolutionary Alliance

CCL: Local Coordination Councils

CCR: Regional Coordination Councils

CGR: Comptroller General of Peru

CSR: Corporate Social Responsibility

DD: Dignidad y Democracia

DIGESA: Department of Environmental Health

DNPP: National Directorate of the Public Budget

FONCODES: Cooperation for Development Fund

FONCOMUN: Municipal Compensation Fund

ICSID: International Center for the Settlement of Investment Disputes

IEM: Special Mining Tax

MEF: Ministry of Economy and Finance

MIDIS: Ministry of Development and Social Inclusion

MIMP: Ministry for Women and Vulnerable Populations

MINEM: The Ministry of Energy and Mining

OCI: Internal Control Entities

OECD: Organization for Economic Co-operation and Development

   The Weak Link: The Role of Local Institutions in Accountable Natural Resource Management, Peru | Oxfam America   5
PCM: Prime Minister’s Office

RLIE: Latin American Network on the Extractive Industries

SIAF: Comprehensive Financial Administration System

SNIP: National Public Investment System

SNMPE: National Society for Mining, Oil and Energy

This report was commissioned by Oxfam America, and produced by Laura Soria
at Societas Consultora de Analisis Social. Collaborators on the report included
Augusto Navarro, who reviewed the details of the law governing the extractive
industries since the 1990s; Patricia Fuertes analyzed the country’s economic and
institutional evolution and described the public budgeting system; Beatriz Soria
and Máximo Gallo carried out the interviews with the specialists from various
sectors; Marilyn Ishikawa helped collate the qualitative and quantitative
information. Gerardo Castillo offered comments on the report’s content. After
production the report was then edited into a final edition by Oxfam America staff.

The report forms part of a larger study, funded by the Gates Foundation, looking
at the role of local institutions in the management of extractive industry revenues.

The report was commissioned with the intention of creating a space for critical
reflection on the part of Oxfam America regarding their engagement with efforts
to improve natural resource management through empowering citizens to hold
their governments to account. The views expressed in this report do not
represent the formal views of Oxfam America.

We would like to thank Sharon Flynn, Cynthia Sanborn and Jonathan Fox, all of
whom were part of the vetting committee that reviewed early drafts of this work
and provided useful input.

6   Oxfam America | The Weak Link: The Role of Local Institutions in Accountable Natural Resource Management, Peru
1. INTRODUCTION
Natural resources present a potentially significant opportunity for developing
countries. In 2013, for example, the 85 least developed countries in the world, ,
were estimated to have produced mineral, oil, and gas commodities (or “resource
1
rents” ), worth a total of $645 billion. That is a figure over 4.5 times the size of
2
global aid budget for the same year (see Figure 1). Despite such potential
wealth, however, a number of resource-rich countries persist in a “paradox of
plenty” whereby, despite this wealth, many citizens in resource-rich countries
continue to eke out their lives in conditions of gross material poverty. Strikingly,
many of these same countries that experience the most dramatic forms of this
paradox are also mired in corruption.
Figure
1.
Rela-ve
value
of
natural
resource
rents
Natural
resource
rents
in
developing
countries,
2012
(approximately
$645
billion)
Total
OECD
Aid,
2013
(approximately
$134
billion)
3
Source World Bank and OECD
This report is part of a broader study looking at the national (‘local’) institutions
that shape accountability systems across four countries: Peru, Senegal, Ghana
and Tanzania. These four countries represent a mix of socio-economic and
political conditions, and cover a range of levels of maturity in terms of the extent
to which extractive industries are established. Of the four countries Peru’s
1
Resource
rents
are
calculated
as
the
price
of
commodities,
multiplied
by
production
values,
less
a
“normal
return
of
capital”
(http://data.worldbank.org/indicator/NY.GDP.TOTL.RT.ZS)
2
Notably
this
includes
aid
flowing
to
many
countries
which
are
in
addition
to
those
85
3
Author
calculations.
OECD:
http://www.oecd.org/newsroom/aid-‐to-‐developing-‐countries-‐
rebounds-‐in-‐2013-‐to-‐reach-‐an-‐all-‐time-‐high.htm,
World
Bank:
http://data.worldbank.org/indicator/NY.GDP.TOTL.RT.ZS
&
http://data.worldbank.org/indicator/NY.GDP.MKTP.CD
The Weak Link: The Role of Local Institutions in Accountable Natural Resource Management, Peru | Oxfam America 7extractive sector is the most mature. The country has a long history of mining
activity, and is now one of the largest producer countries in the world, leading
4
Latin America in terms of the production of zinc, lead, tin, and gold. Mining
currently accounts for around 12% of Peru’s GDP (see Figure 2) and has
consistently contributed more than half the value of the country’s national
exports.
16%
15%
15%
15%
15%
14%
14%
14%
14%
13%
13%
13%
13%
13%
13%
13%
13%
12%
12%
12%
12%
12%
12%
12%
12%
1990
1991
1992
1993
1994
1995
1996
1997
1998
1999
2000
2001
2002
2003
2004
2005
2006
2007
2008
2009
2010
2011
2012
2013
2014
5
Figure 2: Showing mining’s economic contribution to the economy as a percentage of GDP.
Unlike the other countries in this study, Peru is a middle income country, which
6
has seen significant declines in terms of income-based poverty and inequality.
Despite this progress, high concentrations of extreme poverty persist in the
7
country with over 7.4 million people estimated to be living in poverty in 2014.
Levels of inequality also remain stark. The scope for inequality in Peru can be
seen in Figure 3, where dramatic increases in economic growth since the year
2000 have not translated into equivalent improvements in HDI.
4
Ministerio
de
Energía
y
Minas,
Lima.
Recuperado
el
12
de
febrero
de
2015,
de
http://www.minem.gob.pe/_publicacionesDownload.php?idPublicacion=282?rihoakbclgttdnza
5
Source
Formulation:
Societas
Consultora
de
Análisis
Social.
Source:
Banco
Central
de
Reserva
del
Perú,
2015
6
World
Bank
Peru
country
overview
(http://www.worldbank.org/en/country/peru/overview)
7
Source:
The
World
Bank
estimates
the
national
population
at
30,973,148,
with
a
poverty
headcount
ratio
at
24%
of
the
population
(http://databank.worldbank.org/data/reports.aspx?source=2&country=PER&series=&period=)
8 Oxfam America | The Weak Link: The Role of Local Institutions in Accountable Natural Resource Management, PeruPeru's
growth
and
human
development
(1980
-‐
2012)
0.85
HDI
(non-‐income)
2000
0.8
0.75
0.7
0.65
0
1,000
2,000
3,000
4,000
5,000
6,000
7,000
GDP/capita
($
constant
2005)
Figure 3: Showing Peru’s trajectory in terms of per capita growth and human development. Each dot on the
chart represents a year. Note the year 2000 when economic growth begins to increase rapidly without a
commensurate increase in (non-income) HDI.
Considering the above, this research is concerned with understanding how to
ensure that wealth from extractive industries is channeled into investments which
reduce poverty. The motivation for this research comes from the desire to
achieve three objectives:
1. Increase the proportion of revenues from extractive industries that
remain in the country in which those resources are located.
2. Increase the proportion of those revenues being allocated to the sorts
of pro-poor investments that will best address human development.
3. Make sure that the money which is claimed to be directed into a
country, as well as that which is allocated for expenditure in the budget,
actually correspond to real resource transfers, that reach those points
of expenditure for which they are intended.
To this end the work is focused on (i) understanding how rules for revenue
collection from extractives industries are set, as well as (ii) how budget spending
is prioritized. In the case of the former, the intention is to understand what
opportunities there might be to increase the proportion of revenues being
captured by the state. In the case of the latter, it is to understand how budget
priorities might be influenced so that an increased portion of those revenues are
spent on goods and services that are accessed by poor, rural agriculturalists, and
which have been shown to yield the greatest returns in terms of poverty
8
reduction.
8
Croppenstedt,
A.,
B.
Carisma,
S.
Lowder,
T.
Raney,
and
E.
Wielezynski.
2013.
The
State
of
Food
and
Agriculture
2013.
The
State
of
Food
and
Agriculture.
Rome:
Food
and
Agriculture
Organisation.
The Weak Link: The Role of Local Institutions in Accountable Natural Resource Management, Peru | Oxfam America 9Increasing the revenue collected by developing countries and better orienting it
towards expenditure that meets human development goals is, however, only part
of the challenge. There are also issues around how well those rules are followed
and whether or not those budgets are effectively executed. As such, this work is
similarly concerned with (iii) understanding the extent to which decision-makers
in Peru can be considered accountable or not, and what dynamics shape that
accountability (or the lack thereof).
AN OVERVIEW OF EXTRACTION
Following internal political violence and economic collapse in the 1980s, Peru
was in a state of crisis. In the early nineties the country implemented some of the
most radical economic reforms in Latin America, replacing its previously state-
centric model of development with one that stressed the recommendations of the
“Washington consensus” including fiscal balance, the opening of the economy,
9
export-driven growth and free trade. The reforms encouraged the privatization of
state enterprises and public services, liberalized markets—especially the labor
market—ensured security of tenure, and reformed the way tax was administered.
Within this context, the mining sector became the spearhead of efforts to attract
investment—especially foreign investment—to a country considered a high
financial risk. The privatization of the mines, many of which at that point were
heavily owned by the state, also offered liquidity to the government.
In late 2002, Peru entered a period of unprecedented growth as a result of the
rise in international metal prices and the expansion of production. This resulted in
10
a trade surplus of US$321 million in the same year. Since then, the mining
sector has been fundamental to the country’s growth as well as many of its
contradictions. Peru is now one of the largest mineral producers in the world (see
Table 1).
Product Latin America World
Zinc 1 3
Tin 1 3
Lead 1 4
Gold 1 7
Copper 2 3
9
Noejovich,
H.
(2002).
El
Consenso
de
Washington
y
sus
efectos:
Argentina
y
Perú,
1990-‐2000.
Recuperado
el
9
de
febrero
de
2015,
de
http://files.pucp.edu.pe/departamento/economia/LDE-‐
2009-‐02-‐11.pdf
10
Torres
Cuzcano,
V.
(2014).
Grupos
económicos
y
bonanza
minera
en
el
Perú.
Apuntes,
XLI(75),
171-‐210.
Recuperado
el
17
de
febrero
de
2015,
de
http://revistas.up.edu.pe/index.php/apuntes/article/view/483
10 Oxfam America | The Weak Link: The Role of Local Institutions in Accountable Natural Resource Management, PeruSilver 2 3
Molybdenum 2 4
Selenium 2 9
Cadmium 2 8
Rock phosphate 2 12
11
Table 1 showing Peru’s ranking in terms of mineral production, 2014
The rapid growth of mining operations has been accompanied by a significant
increase in conflicts in the sector. To a large extent, these conflicts revolve
around natural resources (especially land and water) which are the basis of the
livelihoods of many rural communities but which the companies also need for
12
their operations and pertain to the distribution of benefits that mining activity
13
generates.
14
Mineral prices have declined steadily since 2011 with the World Bank
15
forecasting a downward trend in prices over the next five years. This reduction
impacts company profits and hence the taxes paid to the treasury as well as the
resources transferred to regions and municipalities.
The oil and gas sector is less important for the country’s economy. This can be
largely explained by the scant and unreliable geological information available
16
which is a constraint to attracting investment to the area. However, the
exploitation of the Camisea gas fields is vital in terms of tax revenues for the
11
Source:.
MINEM(2015).
Perú
2014.
Anuario
minero.
Reporte
estadístico.
Lima,
Perú:
Ministerio
de
Energía
y
Minas.
Page.
31
12
Bebbington,
A.
(2013).
Industrias
extractivas,
conflictos
socioambientales
y
transformaciones
políticoeconómicas
en
América
andina.
En
A.
Bebbington
(Ed.),
Industrias
extractivas,
conflicto
social
y
dinámicas
institucionales
en
la
región
andina
(pág.
400).
Lima:
IEP,
CEPES,
GPC.;
;
Bebbington,
A.,
&
Williams,
M.
(2008).
Water
and
mining
conflicts
in
Peru.
Mountain
research
and
development,
28(3-‐4),
190-‐195.;
Bury,
J.
(2004).
Livelihoods
in
transition:
transnational
gold
mining
operations
and
local
changes
in
Cajamarca,
Peru.
The
Geographical
Journal,
170(1),
78-‐91.
13
Arellano
Yanguas,
J.
(2011).
‘Minería
sin
fronteras’
Conflicto
y
desarrollo
en
regiones
mineras
del
Perú.
Lima,
Perú:
Pontificia
Universidad
Católica
del
Perú;
Universidad
Antonio
Ruiz
de
Montoya;
Instituto
de
Estudios
Peruanos.
14
Baca,
E.,
&
Ávila,
G.
(2015).
El
fin
del
súper
ciclo
de
los
commodities
y
su
impacto
en
los
ingresos
regionales.
Lima:
Grupo
Propuesta
Ciudadana.
Recuperado
el
20
de
febrero
de
2015,
de
http://www.propuestaciudadana.org.pe/sites/default/files/publicaciones/archivos/NIA%207-‐
2015.pdf
15
World
Bank
http://www.worldbank.org/content/dam/Worldbank/GEP/GEP2015a/Price_Forecast.pdf
16
Arellano
Yanguas,
J.
(2013).
Industrias
extractivas,
descentralización
y
desarrollo
local:
economía
política
de
políticas
fiscales
y
redistributivas
en
Perú
y
Bolivia.
Assadourian,
C.
(1982).
El
sistema
de
la
economía
colonial:
mercado
interno,
regionales
y
espacio
económico.
Lima:
IEP.
The Weak Link: The Role of Local Institutions in Accountable Natural Resource Management, Peru | Oxfam America 11Cusco region and has made possible the transformation of Peru’s energy
17
matrix.
With a background to extractive industry in Peru in mind, this report is divided
into nine further sections. Section 2 briefly discusses the methods and
conceptual framings used in the work. Section 3 describes the technical
procedures surrounding revenue sharing from extractive industries, including a
discussion of how these laws and policies came to be and any major failings in
the accountability system regarding natural resource revenue management.
Section 4 describes the budget process in technical terms, as well as the
institutional failings within it. Section 5 reflects on the findings of the previous two
sections to describe which actors maintain the most influence over the budget
and over the allocation of natural resource wealth. Section 6 seeks to link
institutional failing within the budget process and mining policy to failings within
the broader accountability ecosystem in the country. To do so Section 6 details:
how accountability institutions are meant to function, how they actually function,
what the implications of their failure are and how they have been able to
stubbornly resist reform. Having focused on how power is manifest at a central
level, Section 7 of the report briefly describes the extent to which power has been
effectively decentralized in the country. Section 8 provides an overview of
opportunities for civil society to influence budget priorities and drive
accountability. Finally, Section 9 provides a brief conclusion.
17
In
the
last
twenty
years,
the
energy
matrix
has
altered
and
slightly
over
40
percent
of
electricity
consumed
in
the
country
is
supplied
by
thermoelectric
plants
run
on
natural
gas,
and
a
similar
percentage
is
provided
by
hydroelectric
plants.
Thermoelectric
plants
supplied
with
diesel,
oil
residue,
or
coal
produce
the
remainder
(Castillo,
G.
(2015).
Visión
y
manejo
tecnocrático
de
los
glaciares
andinos,
entre
amenazas
y
oportunidades:
el
caso
de
la
laguna
de
Parón
en
el
Perú.
En
C.
Yacoub,
B.
Duarte,
&
R.
Boelens
(Edits.),
Agua
y
ecología
política:
el
extractivismo
en
la
agroexportación,
la
minería
y
las
hidroeléctricas
en
Latinoamérica
(págs.
231-‐
7).
Quito:
Justicia
Hídrica-‐Paraguas;
Abya-‐Yala).
12 Oxfam America | The Weak Link: The Role of Local Institutions in Accountable Natural Resource Management, Peru2. METHODS AND
CONCEPTUAL
FRAMINGS
In addressing the research imperatives set by this project, this research adopted
a number of different methods. Given that a core framing of the research was
that accountability is not simply the outcome of rules, but also the outcome of
18
power relations, a major focus of this study was (wherever possible) on
documenting differences between what is meant to happen and what actually
happens, and then explaining any variance. Since the focus of this work was on
the means by which revenues are collected, and by which they are allocated, the
procedures that were focused on were the laws and policies defining revenue
collection, and those defining the budget process. In addition, in order to account
for the fact that power matters in establishing rules, to whatever extent was
possible some effort was also dedicated to explaining the political and economic
contexts that shaped the rules governing revenue sharing policies and the
budget.
In carrying out this research the report’s authors undertook a thorough review of:
tax laws in the extractive sector, public budgeting procedures, competencies in
the decentralization model, and the operation of public spending institutions and
auditing mechanisms. They also reviewed reports from civil society groups
whose work is considered relevant to the subject matter. Academic literature was
heavily consulted as a means to gain insights into the processes driving Peru’s
economic policy choices since the early 1990s. In order to understand instances
when laws or policies might have been broken or circumvented the work relied
heavily on the reports of investigative journalists. This has included the reports of
journalists working for major outlets (such as La República and The New York
Times) as well as smaller specialized outlets linked to civil society (Ideele and
Convoca). This approach is thought to have provided a robust account of
potential rule breaking given the extent to which Peru’s media is consolidated in
18
Fox,
J.
(2007)
Accountability
Politics:
Power
and
Voice
in
Rural
Mexico.
Oxford:
Oxford
University
Press
The Weak Link: The Role of Local Institutions in Accountable Natural Resource Management, Peru | Oxfam America 1319 pro-business hands (through El Comercio ). It should be recognized, that a number of the cases referenced in this report remain outstanding in the courts. In order to account for the direct role of citizens in accountability processes, the work also analyzed the capacity for civil society to oversee budget and revenue sharing processes, and leverage moments of mal-administration in order to garner an accountable response. This included running a survey with members of civil society regarding what they thought were the major impediments to achieving accountability. The findings from this survey are inserted into relevant points of the report. In addition the research involved a review of all the known projects which have sought to “follow the money” and audit budget expenditures by reconciling budget allocations and transfers with receipts at the point of service delivery. Finally, the information collated has been complemented with semi-structured in-depth interviews with a group of public and private sector players. These were held between December, 2014 and January, 2015. For reasons of confidentiality, the report does not reveal the identity of the interviewees. The sector where the source works is indicated at the end of each quote. 19 El Comercio controls about 70% of the country’s newspapers (Acevedo Rojas, J. (2012). Hacia una comunicación plural. Posibilidades y límites del aporte de la universidad en el campo de las políticas de comunicación en el Perú. Lima: PUCP. Recuperado el 5 de julio de 2015, de) 14 Oxfam America | The Weak Link: The Role of Local Institutions in Accountable Natural Resource Management, Peru
3. REVENUE SHARING
IN PERU
Beginning with the formal processes that dictate how revenue from extractive
industries is collected in Peru, it is worth noting that, legally, Peru’s natural
resources are considered the heritage of the nation with the state having
sovereignty over their use, including the entitlement to pass those resources on
to a third party who can carry out the activities necessary for their exploitation. In
this respect the Peruvian state grants the rights to exploit the natural resources in
its territory, with effective mining rights corresponding to payments made by
concession-holders in the form of a fee. The current fee is a fixed amount
established in US dollars and paid annually from the year in which the request for
each hectare was submitted—see Table 2 for a list of the changing concession
fees. Concession holders have the right to explore and exploit the mineral
resources found within an area with established boundaries, but to a depth which
is not defined.

 Year                   General System                 Small-Scale Miner                        Artisanal Miner

 1992 - 2000            US$ 2                          US$ 1 (also non-metal concessionaires)

 2001                   US$ 5                          US$ 1

 2002                   US$ 3                          US$ 1

 2003                   US$ 3                          US$ 1                                    US$ 0.50

        20
Table 2 . Showing fixed amount to be paid for mining validity fee. In US Dollars (US$)

According to Legislative Decree No. 674 (Sept. 1991), which regulated the
process of Promoting Private Investment in State Companies (privatization), the
resources obtained from these processes is treasury money that should be
allocated towards either development programs, aimed at eradicating poverty, or
towards pacification in the country. Regulation S.D. No. 070-92-PCM (17/07/92)
subsequently established that, under exceptional circumstances, prior to and as
an alternative to being transferred to the treasury, the revenues from subsoil
resources could be used to pay for economic, financial, legal, labor and other
recovery programs. This scheme was designed by The Peruvian Agency for

20

  Formulation:

  Societas
  Consultora
  de
  Análisis
  Social


     The Weak Link: The Role of Local Institutions in Accountable Natural Resource Management, Peru | Oxfam America   15
Promotion of Public Investment (ProInversión). Currently fees paid on
21
concessions comprise income tax (standing at 28% ), with the rate on profits
paid at 6.8%. Other fees include royalties and a special mining tax (see below for
more details). All of these fees are paid to the state.
Regardless of these different fees and taxes, Peru is thought to offer relatively
generous taxation policies towards mining companies. In this respect it is
notable, for example, that the country ranks 46th out of 122 major extractive
countries in terms of the extent to which its tax policy is perceived to encourage
22
investment. At the same time the country ranks 7th (out of 122), based on its
23
attractiveness in terms of pure mineral potential. Given that policy concerns
(which include factors in addition to tax rates) are only thought to account for
40% of investment decisions, this would suggest that Peru has scope to increase
its tax burden in the mineral sector and take greater advantage of its significant
mineral potential. Despite this, it is important to appreciate that the current law in
the country is considered less generous than it was previously (to be discussed
below).
Regarding the national distribution of resources, the central government receives
tax from concessionaires and distributes 50% of this revenue to the subnational
24 25
government—this transfer is known as the “canon” (“resource tax” ). The
transfer of the canon is an administrative operation carried out between the
different levels of government. Distribution of the canon takes place according to
indices set by the Ministry of Economy and Finance, based on measures of a
26
region’s population and poverty rate. From this total figure, 25% of revenues go
to the regional government, of which 5% must go to the universities located in the
region. 25% goes to municipalities in the specific province in which the natural
resources are located, and 10% goes to the municipality in the district where the
resource is extracted. Finally, a further 40% of total revenue goes to the
municipal government within the regions, excluding the province or provinces
where the natural resource is found (see Table 3 for details). Notably, canon
revenues can only be used to fund capital expenditure, with none of the
27
resources being available for current expenditure.
21
Expected
to
shift
to
27%,
between
2017-‐2018,
and
26%
from
2019
onwards.
22
Jackson,
T.
(2015).
Survey
of
Mining
Companies
2014.Vancouver,
Canadá:
Fraser
Institute
Annual.
Recuperado
el
2
de
febrero
de
2015,
de
http://www.fraserinstitute.org
23
Jackson,
2015
24
There
are
six
types
of
canon:
mining,
oil,
gas,
hydro
energy,
fishing
and
forestry.
25
Oré
Chávez,
I.
(noviembre
de
2008).
Canon
minero
y
poder
demanial
del
Estado.
Derecho
y
cambio
social(15).
Recuperado
el
10
de
febrero
de
2015,
de
http://www.derechoycambiosocial.com/revista015/canon%20minero.htm
26
Based
on
a
calculation
of
Unmet
Basic
Needs
27
There
are
some
small
exceptions
for
this
which
allow
part
of
the
revenues
to
be
used
for
project
design
and
maintenance.
16 Oxfam America | The Weak Link: The Role of Local Institutions in Accountable Natural Resource Management, PeruThe Weak Link: The Role of Local Institutions in Accountable Natural Resource Management, Peru | Oxfam America 17
To 2003                          Law N° 28077                      Law N° 28332

                                                                                                 September 2003 to August          August 2004 to date
                                                                                                 2004

                                                                Distribution to local            Distribution to regional and      Distribution to regional and
                                                                governments according to         local governments according       local governments according
     Criteria for canon

                                                                the criteria of the area of      to the distribution indices set   to distribution indices set by
                                                                influence of the deposit.        by the MEF based on               the MEF based on the
     distribution

                                                                                                 population and poverty            criteria of Population and
                                                                                                 criteria linked to basic needs    Unmet Basic Needs (UBN).
                                                                                                 and infrastructure deficit.

                                                                20% of total revenue must        25% of total revenue for the      25% of total revenue for the
                                                                be invested in activities with   regional governments where        regional governments where
                           province where resource government

                                                                regional impact                  the natural resource is found     the natural resource is found
                                                   Regional

                                                                                                 and the region’s state            and the region’s state
                                                                                                 universities (5%).                universities (5%).

                                                                20% of total revenue             25% of revenue for                25% of revenue for
                                                                                                 municipalities in the province    municipalities in the province
     Municipalities in the Municipalities in the

                                                                                                 where the natural resource is     where the natural resource is
                                                                                                 exploited.                        exploited.

                                                                                                 10% of total revenue for the      10% of total revenue for the
     resource is extracted is extracted

                                                                                                 municipality of the district      municipality of the district
                                                                                                 where the resource is             where the resource is
                                                                                                 extracted.                        extracted.

                                                                60% of total revenue for the     40% of total revenue for the      40% of total revenue for the
                                                                provincial and district          local governments of the          local governments of the
     region where the

                                                                municipalities of the            department or departments         department or departments
                                                                department or departments        of the regions, excluding the     of the regions, excluding the
                                                                where the natural resource       province or provinces where       province or provinces where
                                                                is found, according to           the natural resource is found.    the natural resource is found.
                                                                population density criterion.

                                  28
Table 3                                             Amendments to canon distribution, following laws passed

Finally, in addition to these fees and taxes, one-off revenues are covered by the
Social Trusts or Social Funds. These funds are geared towards meeting basic
needs and improving the quality of life of the community in the areas influenced
by mining operations. They are private, fall outside the tax system and only apply
to a limited number of companies. The Social Trusts/Funds operate through
established non-profit civil associations, whose purpose is solely to manage
these investments. The Peruvian Agency for Promotion of Public Investment
(Proinversión) awards tenders which describe the contract between the company
which won the bid and Proinversión. The latter transfers the resources to a legal
entity (civil partnership) and establishes the Fund/Trust, to be composed of
representatives of the company and the community in the company’s area of
influence.

28

  Formulation:
  Societas
  Consultora
  de
  Análisis
  Social


18               Oxfam America | The Weak Link: The Role of Local Institutions in Accountable Natural Resource Management, Peru
UNDERSTANDING REVENUE SHARING IN PERU
Understanding the relatively generous terms afforded to extractive companies in
Peru requires an exploration of the changing political and economic fortunes of
the country over the last 30 years. As was mentioned above, following the
violence of the early 1980s, Peru found itself in a state of social and economic
turmoil. By the end of the decade half of Peru was under a state of emergency.
At the same time, years of high public spending (sustained by international loans)
and economic mismanagement under the Garcia government were squeezed by
a rise in international interest rates that left the country bankrupt and unable to
pay its debts. As a result, Peru was excluded from the international financial
system and plunged into economic crisis. The extent of the crisis is captured by
the fact that, between 1988 and 1989, per capita GDP fell by 23 percent and in
1989 inflation bordered on 2,800 percent—one of the highest inflation rates in
29
world history.
It was in this context that Alberto Fujimori—until then an unknown university
lecturer—won the general elections with the support of left-wing political parties
and the APRA party. Once in office, Fujimori removed his former allies and
implemented aggressive economic liberalization reforms. In August 1990, the
government implemented extreme measures that stopped inflation, but led to
recession and drastically reduced real wages. It greatly devalued the currency,
resulting in increases in the price of goods and services; implemented fiscal
adjustments (including a huge cut in public spending, resulting in mass layoffs)
30
and removed controls on the dollar. In addition, in the face of opposition from
Parliament in 1992, the government effected a self-coup and dissolved
Congress.
Figure 4 showing Peruvian presidents 1990–2016
29
Gonzáles
de
Olarte,
E.
(16
de
abril
de
2007).
Economía
política
de
la
era
liberal
peruana:
1990-‐
2006.
Recuperado
el
12
de
diciembre
de
2014,
de
http://blog.pucp.edu.pe/item/9028/economia-‐
politica-‐de-‐la-‐era-‐neoliberal-‐peruana-‐1990-‐2006
30
Gonzales
de
Olarte,
2007
The Weak Link: The Role of Local Institutions in Accountable Natural Resource Management, Peru | Oxfam America 19Drastic as these measures were, they found strong support among much of the
population, the local business community, and international financial
organizations. Much of this support stemmed from a crisis of legitimacy within the
31
traditional parties, who were criticized for failing to tackle the country’s two
major problems: political violence and economic crisis. In this context
32
“independent candidates,” such as Fujimori, came to be seen as pragmatic and
33
successful. Fujimori's government became attractive for traditional political
34
careers, but did so within an authoritarian and extra-institutional system. The
result was that Fujimori's control over Congress was significant.
To further their control the Executive made intensive use of “emergency decrees”
both to expand the budget and to make transfers from one budget area to
35
another. Opposition to neo-liberal reform was limited as the traditional leftist
parties were in disarray following the turmoil of the 1980s. At the same time
social organizations and unions had been greatly weakened, first by political
violence and then by massive layoffs and job insecurity.
With strong international pressure to restore democratic order, the regime
promulgated a new Constitution in 1993 (which remains in force). This created a
system with a single house congress, in which Fujimori’s party enjoyed an
absolute majority. The result of these combined conditions was that economic
changes could be implemented with limited political or institutional resistance. In
particular there was no articulation of an alternative development narrative which
countered the approach focused on attracting mining investment. Specifically, the
plausibility of state ownership had become untenable due to the failure of
economic policies in the 1980s, while the environmental movements of the sort
apparent today had yet to manifest. As a Technical Secretary at the RLIE puts it:
“It was a period marked by the absence of resistance. Mining
investments came back, they had clear political support in the context of
an authoritarian regime. Not that there was no opposition or protests, of
31
Evidenced
by
their
fall
in
the
share
of
the
vote,
from
97%
in
1980
to
8%
in
1995.
32
The
first
independent
candidate
appeared
in
1989:
Ricardo
Belmont
won
the
Lima
city
elections
and
in
1995,
Fujimori
was
re-‐elected
with
an
anti-‐political
party
discourse.
33
The
popularity
of
the
regime
was
furthered
by
the
capture
of
Abimael
Guzman,
the
top
leader
of
the
PCP-‐SL,
in
September
1992
(Cotler
1998).
34
Degregori,
C.,
&
Meléndez,
C.
(2007).
El
nacimiento
de
los
otorongos.
El
congreso
de
la
república
durante
los
gobiernos
de
Alberto
Fujimori
(1990
-‐
2000).
Lima:
IEP.
35
Carranza,
L.,
Chávez,
J.
F.,
&
Valderrama,
J.
(2007).
La
Economía
Política
del
proceso
Presupuestario:
El
caso
peruano.
Lima,
Lima,
Perú:
Instituto
Peruano
de
Economía.
Carrillo,
S.
(abril-‐mayo
de
2002).
Actuación
política
de
los
medios
de
comunicación
peruanos.
Elecciones
generales
del
2000
y
2001.
Razón
y
palabra,
26.
Recuperado
el
21
de
junio
de
2015,
de
http://razonypalabra.org.mx/anteriores/n26/sluz.html
20 Oxfam America | The Weak Link: The Role of Local Institutions in Accountable Natural Resource Management, PeruYou can also read